1 Introduction
The coalescence of water drops dispersed in oil is critical to the destabilization of a water-in-oil emulsion. The electrocoalescence of an emulsion of water in crude oil plays a very significant role in the quick and efficient dehydration of crude in the oil and gas industry (Cottrell & Speed Reference Cottrell and Speed1911; Atten Reference Atten1993; Mhatre & Thaokar Reference Mhatre and Thaokar2015; Anand et al. Reference Anand, Vashishtha, Shown, Patidar, Malhotra, Ghosh, Jaguste, Naik, Thaokar and Juvekar2018). Unlike shear coalescence, when two drops approach each other under an applied electric field, although the lubrication resistance increases, the electrostatic force that brings the two drops together also increases (Davis Reference Davis1964; Khair Reference Khair2013; Mhatre, Deshmukh & Thaokar Reference Mhatre, Deshmukh and Thaokar2015). This makes electrocoalescence a highly effective method for coalescence of water drops suspended in an insulating oil (Less & Vilagines Reference Less and Vilagines2012).
Several experimental as well as numerical investigations on the electrocoalescence of two drops (a drop pair) (Pearce Reference Pearce1954; Atten Reference Atten1993; Mhatre et al. Reference Mhatre, Deshmukh and Thaokar2015) or drop interface system (Allan & Mason Reference Allan and Mason1961; Aryafar & Kavehpour Reference Aryafar and Kavehpour2007; Ristenpart et al. Reference Ristenpart, Bird, Belmonte, Dollar and Stone2009; Hamlin, Creasey & Ristenpart Reference Hamlin, Creasey and Ristenpart2012; Helmensdorfer & Topping Reference Helmensdorfer and Topping2013; Lu, Fang & Corvalan Reference Lu, Fang and Corvalan2016) in water-in-oil systems have been reported.
The coalescence under an electric field was generally assumed to follow the three steps of (i) drop approach, (ii) film drainage (continuous phase) and (iii) film rupture and coalescence (Atten Reference Atten1993). Under the application of an electric field, the droplets are polarized such that, in the far-field limit, each droplet can be considered to be a dipole. The dipole–dipole interaction then leads to an attractive or a repulsive interaction, depending upon the angle made by the line joining the centres of the two drops with the direction of the applied electric field. When an electric field is applied to a pair of drops, it leads to their deformation due to the resulting Maxwell stress, which depends upon the electrocapillary number,
 $Ca=\unicode[STIX]{x1D716}\unicode[STIX]{x1D716}_{0}aE^{2}/\unicode[STIX]{x1D6FE}$
. Here
 $a$
is the drop radius,
 $\unicode[STIX]{x1D716}$
is the dielectric constant,
 $\unicode[STIX]{x1D716}_{0}$
is the permittivity of vacuum,
 $\unicode[STIX]{x1D6FE}$
is the interfacial tension (oil–water) and
 $E$
is the electric field. The critical capillary number at which an isolated drop breaks is
 $Ca_{c}=0.21$
. On the other hand, the
 $Ca_{c}$
at which a drop in a drop pair breaks is lower and depends upon the distance between the two drops’ centres (Owe Berg, Fernish & Gaukler Reference Owe Berg, Fernish and Gaukler1963). This tendency to break up manifests as a bridge if the drops are very close to each other.
The Laplace pressure in the bridge between two drops in contact, which is determined by the two curvatures, azimuthal and meridional, of the bridge, then dictates whether the drops coalesce or undergo non-coalescence. Thus the coalescence of two drops under an electric field could be much more complicated than assumed by Atten (Reference Atten1993).
Ristenpart et al. (Reference Ristenpart, Bird, Belmonte, Dollar and Stone2009) correlated the coalescence/non-coalescence behaviour theoretically, by approximating the capillary pressure inside the bridge (drop–interface system) as
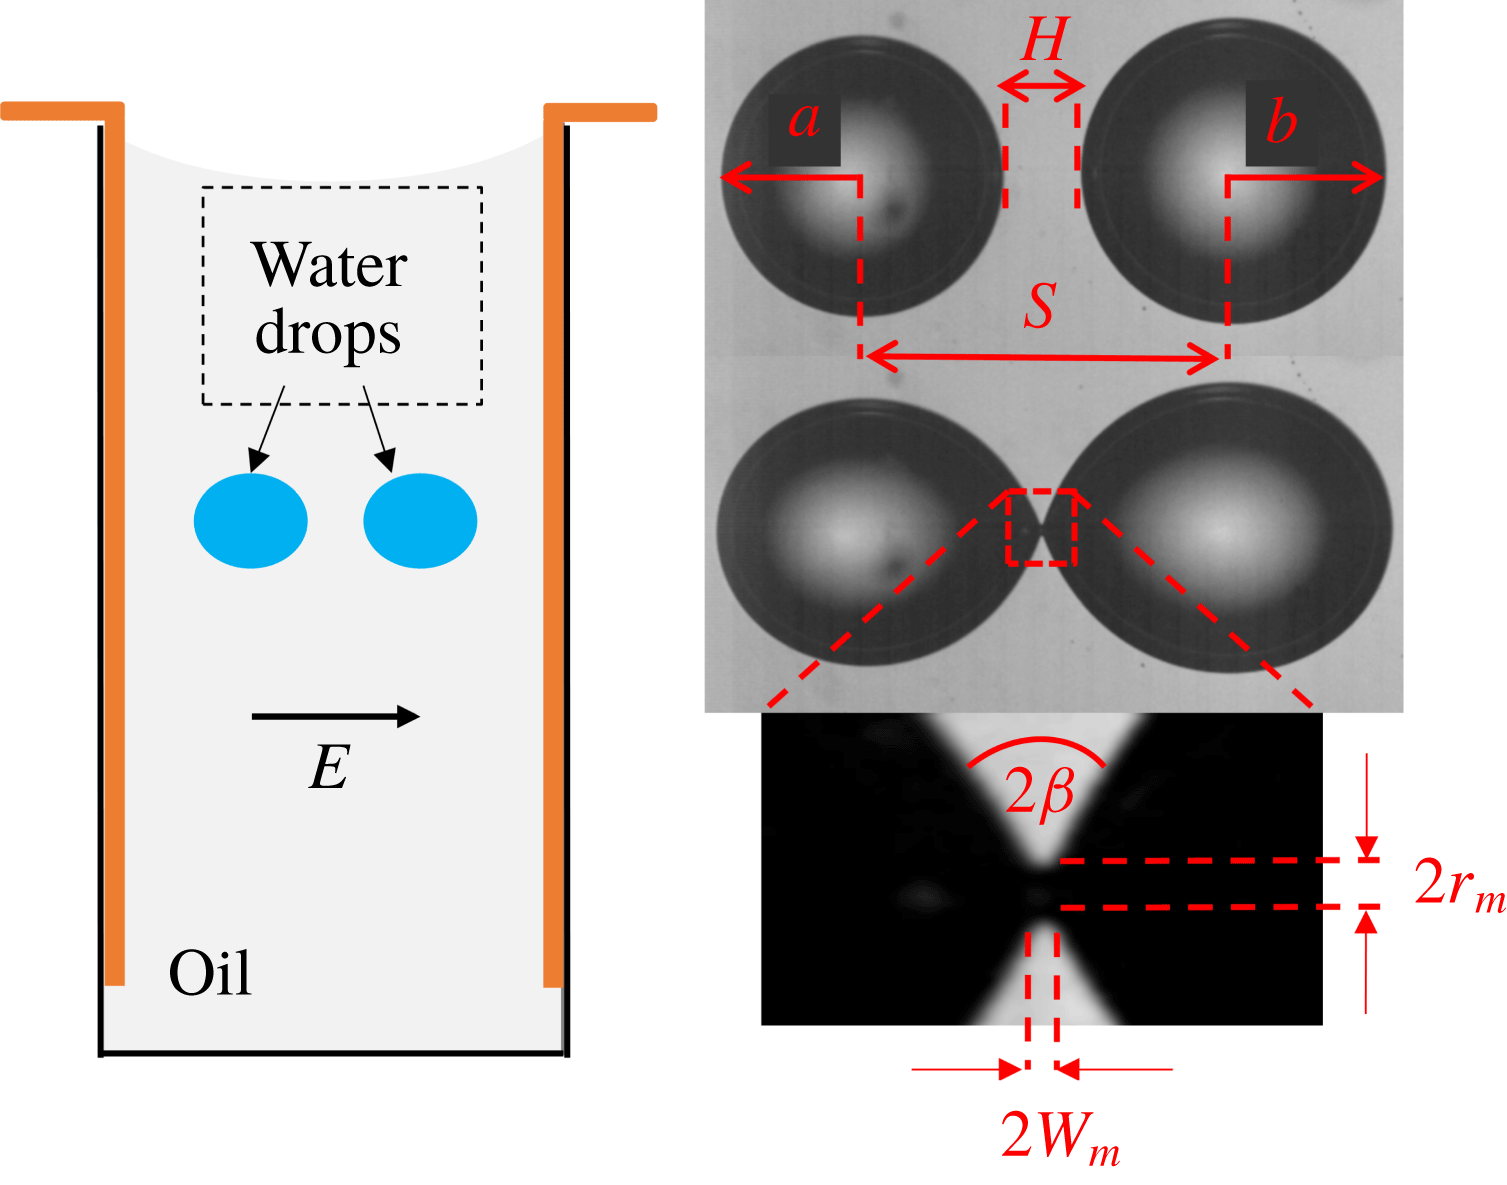
 $P_{bridge}=P_{0}+\unicode[STIX]{x1D6FE}((1/r_{m})-(1/w_{m}))$
, where
 $P_{0}$
is the ambient pressure, and
 $r_{m}$
and
 $w_{m}$
are the curvature radius and the width of the meniscus bridge. The capillary pressure inside the drop is
 $P_{drop}=P_{0}+(2\unicode[STIX]{x1D6FE}/R)$
, where
 $R$
is the radius of the drop. For
 $r_{m}\ll R$
the pressure difference between the drop (bulk) and meniscus bridge is
 $\unicode[STIX]{x0394}P\approx (\unicode[STIX]{x1D6FE}/r_{m})(\cot \unicode[STIX]{x1D6FD}-1)$
, where
 $\unicode[STIX]{x1D6FD}$
is the angle as shown in figure 1. The sign of the pressure difference now depends only on the value of
 $\unicode[STIX]{x1D6FD}$
. For a positive
 $\unicode[STIX]{x0394}P$
,
 $\unicode[STIX]{x1D6FD}>45^{\circ }$
(i.e.
 $\cot \unicode[STIX]{x1D6FD}<1$
) results in a bridge, which pushes the fluid into the drops, resulting in non-coalescence. This analysis was later refined to yield a critical angle of
 $\unicode[STIX]{x1D6FD}>30.8^{\circ }$
in a follow-up work by the same group (Bird et al.
Reference Bird, Ristenpart, Belmonte and Stone2009). In the set-up of Ristenpart et al. (Reference Ristenpart, Bird, Belmonte, Dollar and Stone2009) the opposite charges on the drops make it more unfavourable for non-coalescence to occur. On the other hand, their experiments, which were carried out in a pin–plate kind of set-up (Ristenpart et al.
Reference Ristenpart, Bird, Belmonte, Dollar and Stone2009), favoured non-coalescence. Moreover, Bird et al. (Reference Bird, Ristenpart, Belmonte and Stone2009) also studied two anchored drops under an applied electric field and, even in the anchored drop set-up, found that the coalescence/non-coalescence depends upon the cone angle, which can be controlled by varying the electric field and drop size.
Although Ristenpart et al. (Reference Ristenpart, Bird, Belmonte, Dollar and Stone2009) studied the non-coalescence of drops (i) in the pin–plate system for water drops in oil and (ii) for anchored drops in air, the result of a critical cone angle of
 $30.8^{\circ }$
should be verified for non-coalescence of a pair of drops suspended in an insulating oil. For anchored drops in air, the applied electric field is the same as the field across the interface. In the case of two drops, the field between the two drops is significantly higher than the applied field and has to be numerically estimated. In the pin–plate configuration, the electric field is non-uniform and aids non-coalescence. Thus the case of two drops in a uniform field could be different than the studies of Ristenpart et al. (Reference Ristenpart, Bird, Belmonte, Dollar and Stone2009) and is the focus of the present work.
Following the theory of Ristenpart et al. (Reference Ristenpart, Bird, Belmonte, Dollar and Stone2009), Bartlett, Généro & Bird (Reference Bartlett, Généro and Bird2015) and Lu et al. (Reference Lu, Fang and Corvalan2016) modified the bridge geometry such that the initial pressure in the bridge is negative, favouring coalescence. Their analysis was conducted for the case of two free drops in a uniform field. While Bartlett et al. (Reference Bartlett, Généro and Bird2015) predicted a cone angle of
 $25^{\circ }$
using inviscid calculations, Lu et al. (Reference Lu, Fang and Corvalan2016) modified the analysis of Bartlett et al. (Reference Bartlett, Généro and Bird2015) and included viscous stresses. They found that the critical angle for coalescence reduces further to around
 $19^{\circ }$
due to viscous effects.
The only experimental study on the non-coalescence of a pair of drops (Guo & He Reference Guo and He2014) indicated that there is a critical electric field beyond which non-coalescence of droplets under an electric field is observed and needs to be investigated in more detail.
Despite these studies, the fundamental physics of coalescence or non-coalescence of a pair of water drops in oil is not satisfactorily understood. The poorly understood issues are the dependence of coalescence on the conductivity of the oil phase, the conductivity of the drop phase, the effect of the intensity of the applied electric field, the separation distance between two drops, the viscosity ratio (
 $\unicode[STIX]{x1D706}$
) of the dispersed phase to the continuous phase (
 $\unicode[STIX]{x1D707}_{d}/\unicode[STIX]{x1D707}_{0}$
) and the applied frequency
 $f$
; and they have not been adequately addressed in the literature.
2 Experimental
Oils of different conductivities, such as silicone oil (330 cSt, and electrical conductivity
 $\unicode[STIX]{x1D70E}=1\times 10^{-12}$
S m
 $^{-1}$
) (Merck), silicone oil (630 cSt, 10 000 cSt), castor oil (650 cSt, and
 $\unicode[STIX]{x1D70E}=6\times 10^{-11}$
S m
 $^{-1}$
) and 1-(2-pyrimidyl) piperazine, were purchased from Sigma-Aldrich and were used without further purification. Deionized (DI) water was obtained from Millipore Milli-Q (
 $\unicode[STIX]{x1D70E}=5.5~\unicode[STIX]{x03BC}$
S m
 $^{-1}$
). All the experiments were conducted at room temperature (
 $25\,^{\circ }\text{C}$
). The conductivity of deionized water was altered by adding NaCl (Merck). The conductivity of brine was measured with Orion (Thermo 145A+) and the oil conductivity was measured with Alfa-A high-performance frequency analyser (Novocontrol).
Schematic diagram of the experimental set-up.

A schematic diagram of the experimental set-up for conducting studies on the coalescence behaviour of two water drops suspended in oil (water in oil) is shown in figure 1. The experimental set-up consists of two parallel copper electrodes of dimensions 10 mm
 $(\text{length})\times 1.5~\text{mm}$
(width)
 $\times 45~\text{mm}$
(height) fixed into a rectangular (
 $10~\text{mm}\times 10~\text{mm}$
) plastic cuvette. The electrode system is connected to a high-power voltage amplifier (Trek, USA, model
 $5/80$
). The desired electric field and wavefunction is generated by a function generator (Agilent Technology Pvt. Ltd., USA, model 33220A). For capturing the events of coalescence and non-coalescence, high-speed videography was conducted using a camera (Vision Research, model Phantom v12) which was connected with the stereo zoom microscope (Nikon Instruments, model SMZ1000) and a fibre optic light source (Nikon, model C-FI230). The cuvette was filled with oil and the two water drops of either distilled water or brine were put into the cuvette, by using a syringe. Care was taken such that the drops between the two electrodes were almost at the same horizontal level and the direction of the field was the same as the line joining the centres of the two drops. The drops were placed in the same plane and were carefully focused by an adjustment of the stereo zoom microscope. The videos were then analysed using the software, ImageJ.
3 Results and discussion
The dynamics of a pair of drops in the electric field include the approach phase from the start of the experiment to the point where the two cones are formed at the poles, facing each other. This is followed by an interaction between the two cones (the pre-contact phase), and the post-contact phase, which is the bridge formation. The focus in this work is on the pre-contact phase.
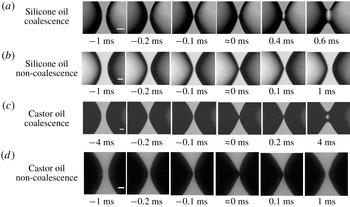
(a) Coalescence of DI water drops in silicone oil;
 $Ca=0.033$
; frequency
 $=$
50 Hz, angle
 $\unicode[STIX]{x1D6FD}=20^{\circ }$
. (b) Non-coalescence of DI water drops in silicone oil;
 $Ca=0.09$
; frequency
 $=$
50 Hz, angle
 $\unicode[STIX]{x1D6FD}=22^{\circ }$
. (c) Coalescence of DI water drops in castor oil;
 $Ca=0.063$
; frequency
 $=$
50 Hz. (d) Non-coalescence of DI water drops in castor oil;
 $Ca=0.10$
; frequency
 $=$
50 Hz. See supplementary movies 1–4 (available at https://doi.org/10.1017/jfm.2018.849), which correspond to (a)–(d), respectively. Scale bar is
 $50~\unicode[STIX]{x03BC}\text{m}$
.

3.1 Cone–cone mode of droplet coalescence in silicone oil system
In the pre-contact phase, the two approaching drops form Taylor cones, although not as sharp as for the water–air system (figure 2
a,b) (see supplementary movies 1 and 2). It is expected that the cone angle
 $\unicode[STIX]{x1D6FD}=\unicode[STIX]{x1D6FD}(Ca,\unicode[STIX]{x1D706},(H/a),f,\unicode[STIX]{x1D70E}_{i},\unicode[STIX]{x1D70E}_{e})$
, where
 $H$
is the distance between poles facing each other,
 $f$
is the applied frequency,
 $\unicode[STIX]{x1D70E}_{i}$
is the conductivity of the internal phase and
 $\unicode[STIX]{x1D70E}_{e}$
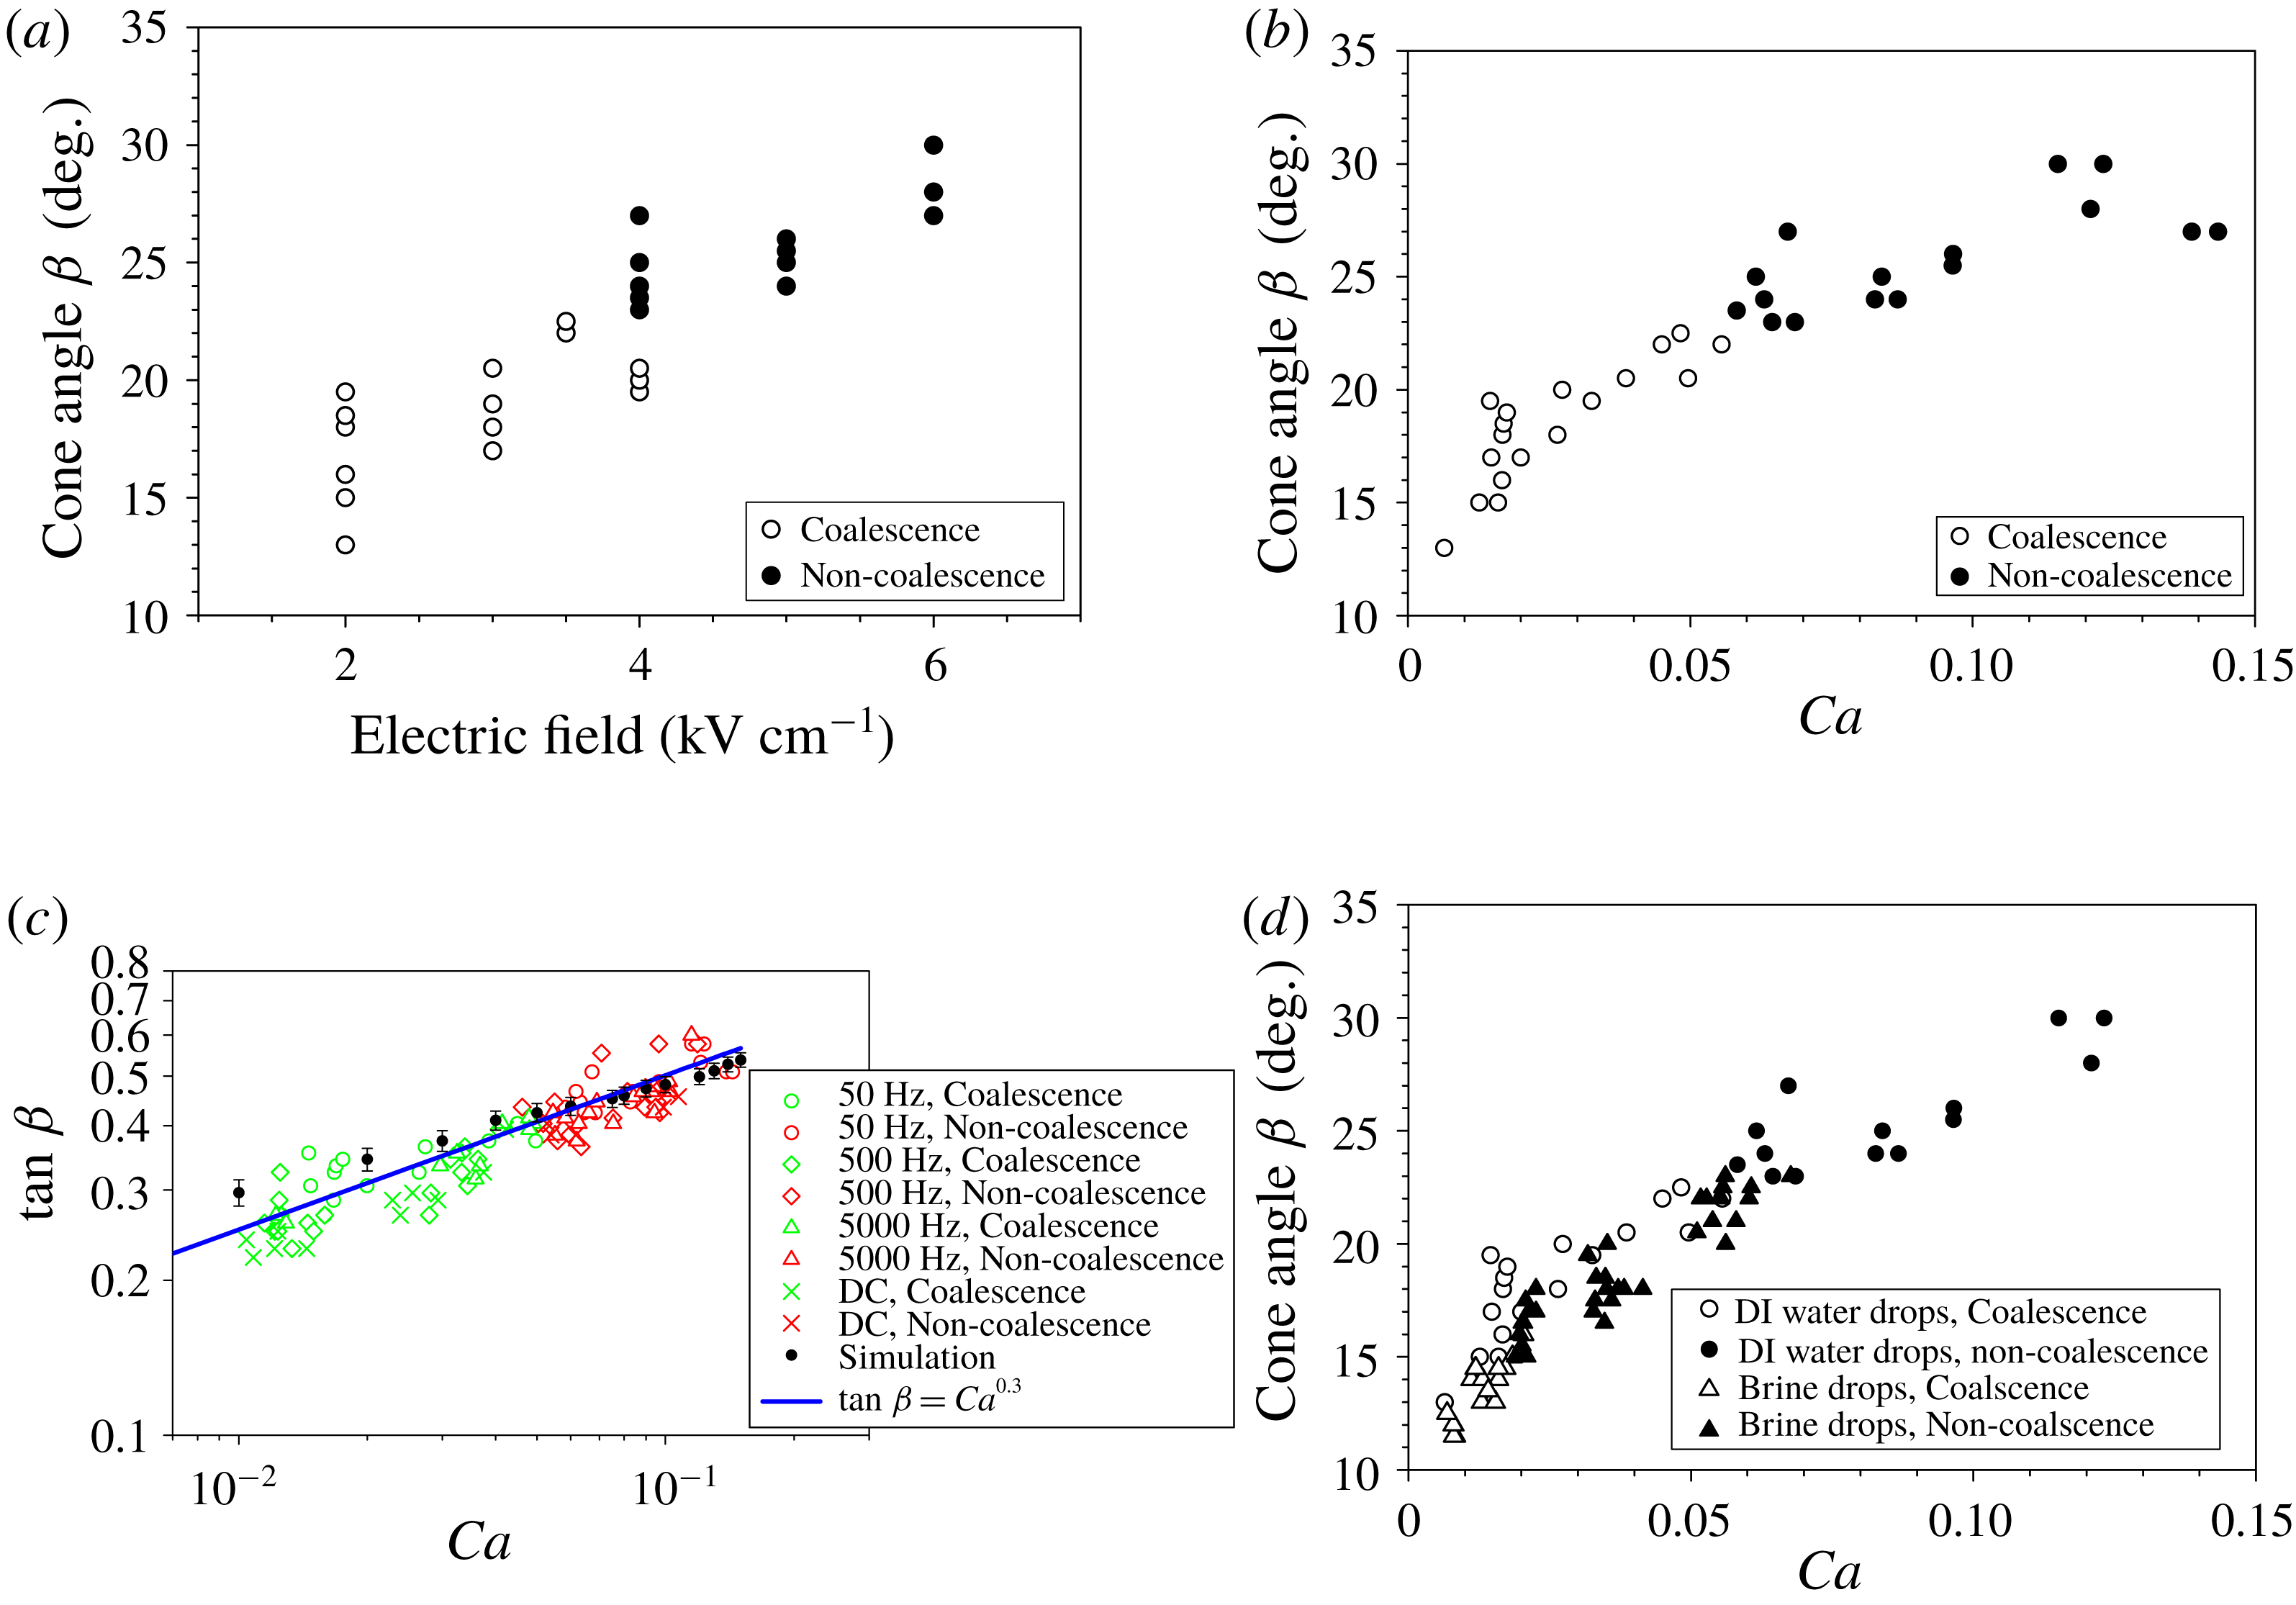
is the conductivity of the external phase. Figure 3(a) shows the variation of
 $\unicode[STIX]{x1D6FD}$
with the electric field. A fairly good data collapse is observed when the electric field is expressed in terms of the capillary number (
 $Ca$
) (figure 3
b). The cone angle is found to scale as
 $\tan \unicode[STIX]{x1D6FD}\sim Ca^{0.30}$
as shown in figure 3(c) unlike the
 $1/2$
scaling in Ristenpart et al. (Reference Ristenpart, Bird, Belmonte, Dollar and Stone2009). The variation of the cone angle with the non-dimensional initial separation
 $(H/a)$
and the viscosity ratio
 $\unicode[STIX]{x1D706}$
show weak dependence in the
 $(H/a)>1$
and
 $\unicode[STIX]{x1D706}<1$
regimes and the data are not reported here.
(a) Cone angle
 $\unicode[STIX]{x1D6FD}$
versus electric field; frequency
 $=$
50 Hz;
 $\unicode[STIX]{x1D706}=3\times 10^{-3}$
. (b) Cone angle
 $\unicode[STIX]{x1D6FD}$
versus
 $Ca$
; frequency
 $=$
50 Hz;
 $\unicode[STIX]{x1D706}=3\times 10^{-3}$
. (c) Effect of frequency on
 $\tan \unicode[STIX]{x1D6FD}$
versus capillary number for DC field and with frequency
 $=$
50 Hz, 500 Hz and 5000 Hz and comparison with simulation;
 $\unicode[STIX]{x1D706}=3\times 10^{-3}$
. (d) Cone angle
 $\unicode[STIX]{x1D6FD}$
versus
 $Ca$
for DI water drops and brine (1000 p.p.m. NaCl) drops in silicone oil; frequency
 $=$
50 Hz;
 $\unicode[STIX]{x1D706}=3\times 10^{-3}$
.

The most important feature of figure 3 is the observation of non-coalescence at an angle significantly lower than
 $30.8^{\circ }$
. One of the reasons why coalescence is observed at cone angles
 $\unicode[STIX]{x1D6FD}<30.8^{\circ }$
could be that the cones formed at the leading poles of the two drops do not contact as assumed in Bird et al. (Reference Bird, Ristenpart, Belmonte and Stone2009) but form a ‘bridge at a distance’. Since the same volume in the cones is now stretched due to action at a distance, the cone angle increases, causing a reduction in the meridional curvature and thereby inducing non-coalescence. Although a modification of the theory of Bird et al. (Reference Bird, Ristenpart, Belmonte and Stone2009) predicts a lower critical non-coalescence angle, the agreement with experiments is far from satisfactory. A question of relevance then is ‘why is there an action at a distance?’ It can be argued that the electrostatic force of attraction is so strong at the two poles of the approaching drops that the cones start to deform into a jet at significant separations without contacting, akin to an electrospray, and never really contact at a single point as assumed in the theory. The thin jet leads to high Laplace pressure and thereby results in non-coalescence (figure 2
b at
 $t\approx 0$
ms).
The cone angle, as well as the critical cone angle and the capillary numbers, are remarkably insensitive to the frequency of the applied field. The frequencies explored in this work are up to
 $\unicode[STIX]{x1D714}\sim 5000$
Hz or a time period of the order of 0.2 ms. This time scale is at least one order lower than the Maxwell–Wagner relaxation time for the system, which is of the order of 0.02 ms. Thus there is an instantaneous charge relaxation within a time period, thereby eliminating the possibility of the effect of frequency (in the
 $\unicode[STIX]{x1D714}<50\,000$
Hz range) (figure 3
c) in the approach and pre-contact phases.
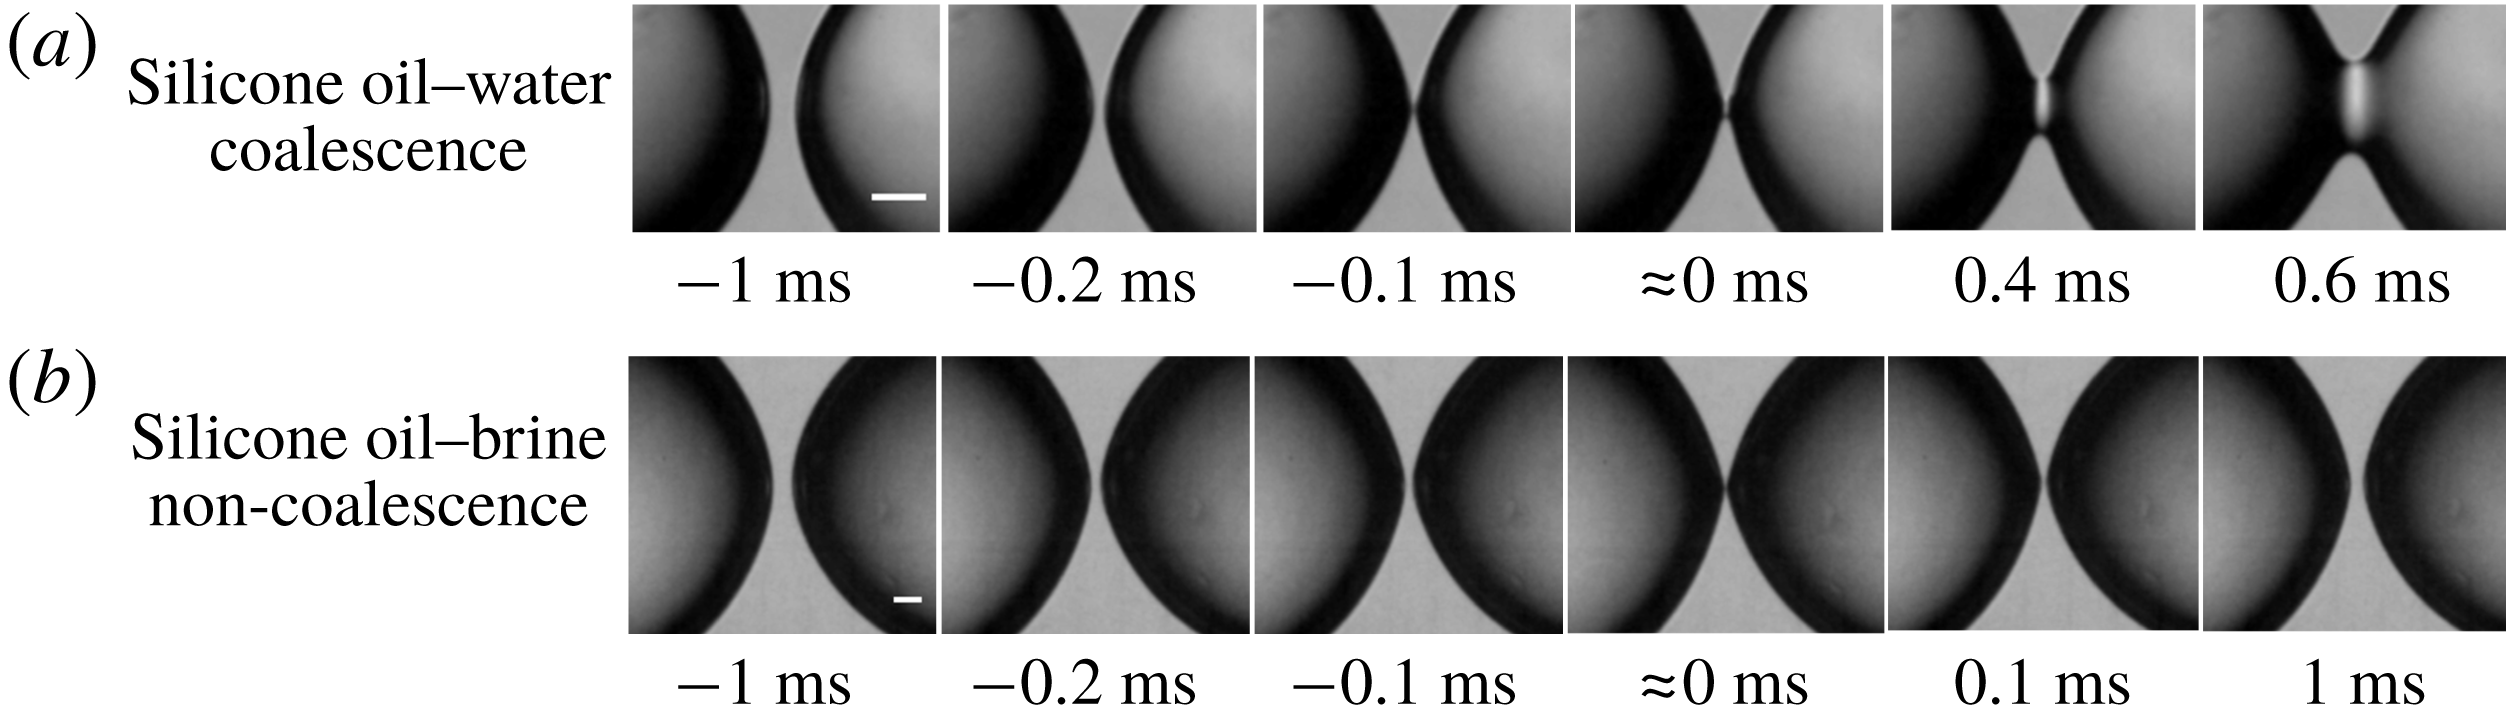
A great insensitivity of cone angle versus time to the conductivity of the droplet phase is observed during the approach phase (figure 4). The dynamics of cone angles for the same capillary number in the case of deionized water droplets and brine droplets appears to be similar in the approach (not shown) and the pre-contact phase (figure 3
d). This indicates that the conductivity does not affect the cone angle for a given capillary number during its approach. However, the critical capillary number and the critical cone angle are found to be sensitive to the conductivity of the dispersed phase. The critical capillary number decreases significantly with an increase in the droplet conductivity (
 $Ca_{c}=0.05$
for DI water drops and
 $Ca_{c}=0.02$
for brine drops (1000 p.p.m. NaCl)). The critical cone angle at which non-coalescence is seen, also decreases considerably as shown in figure 3(d) (
 $\unicode[STIX]{x1D6FD}=23^{\circ }$
for DI droplets and
 $\unicode[STIX]{x1D6FD}=15^{\circ }$
for brine droplets).
(a) Coalescence of DI water drops in silicone oil;
 $Ca=0.033$
; frequency
 $=$
50 Hz; angle
 $\unicode[STIX]{x1D6FD}=20^{\circ }$
. (b) Non-coalescence of 1000 p.p.m. brine drops in silicone oil;
 $Ca=0.035$
; frequency
 $=$
50 Hz; angle
 $\unicode[STIX]{x1D6FD}=19^{\circ }$
. Scale bar is
 $50~\unicode[STIX]{x03BC}$
m.

The non-coalescence at lower values of
 $\unicode[STIX]{x1D6FD}$
and a lower
 $Ca_{c}$
for high conductivity of the droplet phase can only be conjectured in the absence of a rigorous model. Before contact and at the end of the pre-contact phase, which is an extremely fast process, an increased conductivity leads to a higher charge due to faster charge dynamics in the case of brine (faster replenishment of lost charges due to oil conductivity). This results in a greater normal Maxwell electric force between the poles and stretching of the drops at a distance. This can lead to lower apparent cone angles due to stretching of the neck and formation of a very thin thread (that is, a large azimuthal curvature) and thereby promotes non-coalescence (due to smaller meridional curvatures) as shown in figure 4 at lower capillary number.
The small cone angles of
 $23^{\circ }$
and
 $15^{\circ }$
seen in the experiments are remarkably close to the theories of Bartlett et al. (Reference Bartlett, Généro and Bird2015) and Lu et al. (Reference Lu, Fang and Corvalan2016) (at lower Reynolds number). These angles, although very close to the experimentally observed angles in the present work, are difficult to justify. This is because, while the analyses of Bartlett et al. (Reference Bartlett, Généro and Bird2015) and Lu et al. (Reference Lu, Fang and Corvalan2016) are predominantly inviscid, the experiments reported in this work are in the highly viscous regime.
3.2 Observation of cone–dimple mode of coalescence in castor oil system
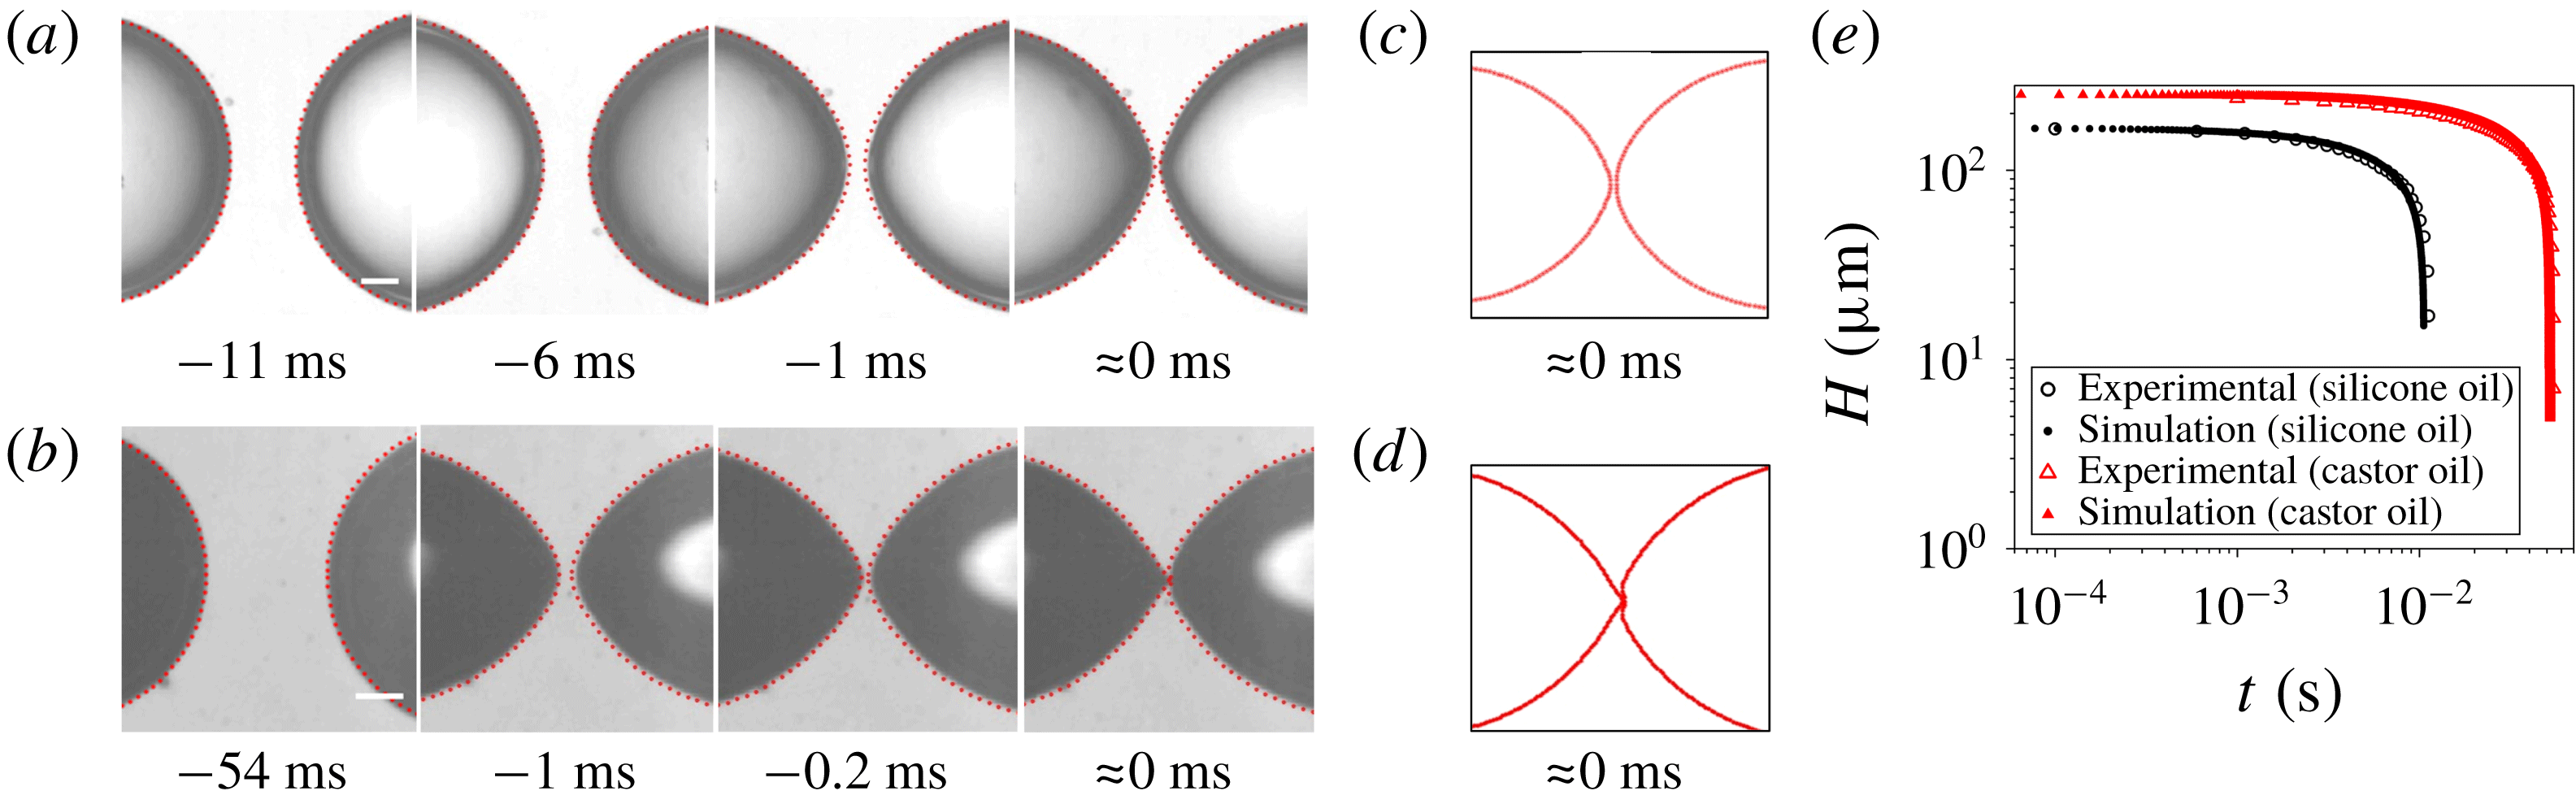
The approach phases in silicone and castor oil appear similar in experiments and are correctly predicted by the boundary element method (BEM; figure 5
a–e). At the end of the approach phase, Taylor cones (although not very sharp) are seen at the approaching poles in figure 5(a,b) for both cases. However, in the pre-contact phase, a significant difference is observed in experiments for the two systems. In the case of silicone oil, the Taylor cones of the two approaching drops continue to get sharper, and then give way to form a bridge, in an almost symmetric manner. This is despite a considerable size asymmetry between the two drops. However, in the case of castor oil, a slight asymmetry in size of the two drops leads to accentuation of the Taylor cone on the smaller drop with a simultaneous reduction of the conical region of the larger drop. The cone of the smaller drop penetrates further into the larger drop, while the interface of the larger drop at the poles withdraws into a dimple. The cone of the smaller drop forms a long thin jet into the dimple of the larger drop, finally resulting in coalescence or non-coalescence as shown in figure 2(c,d) (see supplementary movies 3 and 4). This is surprising since the conductivities of both these oils are fairly low, and the ratio of conductivity of the dispersed water phase to the conductivity of these oils is around
 $10^{3}$
or more. This justifies a perfect conductor–perfect dielectric physical or numerical model for the system involving these two insulating oils. The dielectric constants of silicone oil and castor oil are nearly the same, values of
 $2.7$
and
 $4.7$
, respectively. So it is intriguing why the coalescence in these two oils should be qualitatively different. Any attempt to explain the difference in the pre-contact phase using simple theoretical models based on the concepts of perfect conductor or perfect insulator would fail.
(a) Experimental and BEM prediction (red marker) for DI water drops in silicone oil. (b) Experimental and BEM prediction (red marker) for DI water drop in castor oil. (c) BEM prediction for silicone oil at
 $t=0$
s. (d) BEM prediction for castor oil at
 $t=0$
s. (e) Plot of
 $H$
versus time for experiment and simulation for silicone and castor oil in the approach phase. Scale bar is
 $100~\unicode[STIX]{x03BC}$
m.

The formation of the cone–dimple mode in the castor oil–water system is an important but non-intuitive observation, and cannot certainly be explained by the theory of Bird et al. (Reference Bird, Ristenpart, Belmonte and Stone2009) due to the asymmetry of the Taylor cones in the two approaching drops. In fact, the Taylor cone, unlike in the case of similarly sized drops, is formed only on the approaching pole of one of the drops, typically the smaller drop. The BEM calculations (Mhatre et al. Reference Mhatre, Deshmukh and Thaokar2015) for equal-sized drops predict symmetric Taylor cones in pre-contact phases. The BEM calculation in the present work (see the supplementary material) predicts that, when the sizes of the two drops are even slightly dissimilar, symmetric cones are formed in the approach phase, but as the pre-contact phase sets in, the Taylor cone in the smaller drop remarkably grows into a projection and initiates a dimple into the larger drop. The projection continues to grow and finally penetrates into the dimple (figure 5 c,d). The results agree well in a qualitative sense with experiment (figure 5 a,b).
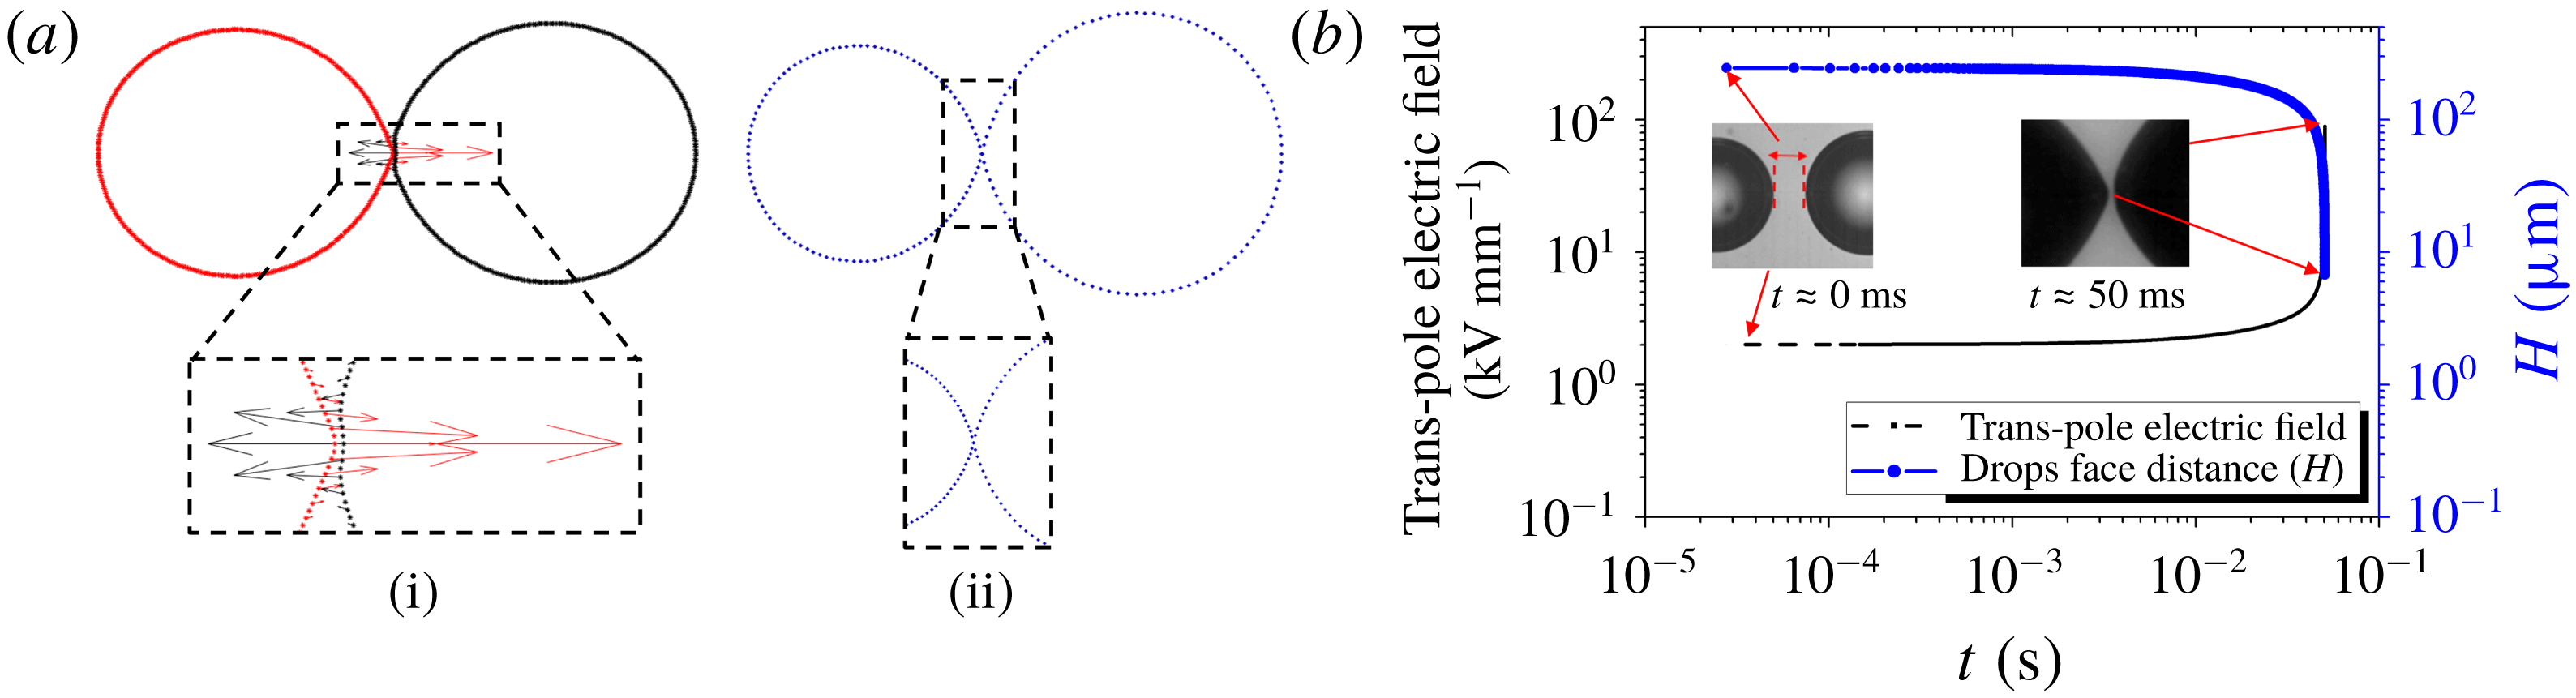
The BEM calculation (figure 6 a (i)) shows that the smaller drop forms a projection into the bigger drop. The corresponding Maxwell stress plotted shows that the smaller drop experiences much larger forces than the bigger drop near the pole, resulting in the dimple and conical projection geometry. To ascertain the role of electrostatic and hydrodynamic stresses, BEM calculations were conducted by switching off the hydrodynamic interactions. It was observed that projection and dimple formation were not observed on switching off the hydrodynamics, indicating that the deformation is caused due to electrostatic interactions mediated through hydrodynamic forces and not due to the Maxwell stress alone (figure 6 a (ii)).
It should be noted that the BEM calculations do not distinguish between silicone oil and castor oil, and assume a perfect conductor drop in a perfectly insulating oil. What they show, however, is that a slight asymmetry in size can lead to a cone–dimple configuration which is seen in castor oil.
(a) BEM calculation to show (i) Maxwell stresses experienced by the unequal drops near contact and (ii) no cone and dimple formation when the hydrodynamic effects of the drops on each other are uncoupled. (b) Plot of trans-pole electric field with time calculated using BEM, and face-to-face distance between the drops with time.

The BEM calculations allow estimation of the trans-pole potential between the two poles of the approaching drops as a function of time and is plotted in figure 6(b). It shows the variation of trans-pole electric field as a function of time, plotted till the distance between the poles is equal to the experimental separation of around
 $10~\unicode[STIX]{x03BC}\text{m}$
. It is found that at the end of the approach phase, the trans-pole potential leads to the electric field in the region between the poles growing to enormously high values, several
 $\text{kV}~\text{mm}^{-1}$
. The high values of trans-pole electric fields suggest the possibility of a dielectric breakdown of the oil between the two drops. Our experiments (not detailed here) on the other hand showed that the dielectric strengths of silicone and castor oils were around 12 and
 $16~\text{kV}~\text{mm}^{-1}$
, respectively, thereby ruling out its role.
Another hypothesis for the difference seen in the coalescence of water drops in castor and silicone oils is the role of the small but finite conductivity of the oils. The conductivity of silicone oil is around 100 times less than that of castor oil. When a thin oil film is formed between the two drops, and a huge trans-inter-pole potential and thereby field is realized, the corresponding current in the oil between the two drops could be very high, despite the low conductivity of the oils. This could lead to charge loss from the poles of the two drops, thereby reducing the attractive electrostatic force. In the case of silicone oil, since the conductivity is low, the charge loss is less, and therefore a small capillary number is required for bridge formation. In the case of castor oil, the charge loss is significant due to the high conductivity of the castor oil, leading to a loss of attractive electrostatic force. This can result in delayed dynamics and a higher capillary number is required to generate enough force for bridge formation and thereby coalescence/non-coalescence.
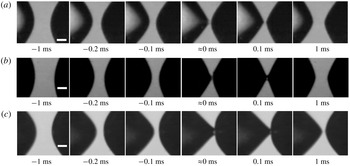
To ascertain the role of the conductivity of the oil phase in determining the droplet shapes in the pre-contact phase, several additives were added in an attempt to increase the conductivity of silicone oil. These were toluene saturated with brine, 0.5 % piperazine (which is known to absorb water readily) and 10 % –20 % D130 (a fairly high-conductivity oil of the kerosene type (mostly saturates)). It was observed that perfectly symmetric cones are formed in water–silicone oil system without additives. However, a signature of cone–dimple mode is seen for water–silicone oil with 0.5 % piperazine (
 $\unicode[STIX]{x1D70E}=2.5\times 10^{-10}$
S m
 $^{-1}$
) (figure 7
a). The cone–dimple mode in water–silicone oil system was amplified by addition of D130 in silicone oil (
 $\unicode[STIX]{x1D70E}=5.1\times 10^{-10}$
S m
 $^{-1}$
) (figure 7
b). To see if an increase in castor oil conductivity (by addition of piperazine) led to the further aggravation of the cone–dimple tendency in the water–castor oil system, around 0.5 % piperazine was added to castor oil (
 $\unicode[STIX]{x1D70E}=4.5\times 10^{-10}$
S m
 $^{-1}$
) (figure 7
c). A pronounced and unmistakable increase in the dimple formation was observed in this case, indicating that the conductivity of the oil indeed played a role in the cone–cone or cone–dimple configurations during the contact phase (figure 7).
Results for (a) 0.5 % 1-(2-pyrimidyl) piperazine in silicone oil; (b) 20 % D130 oil in silicone oil; (c) 0.5 % 1-(2-pyrimidyl) piperazine in castor oil. Scale bar is
 $50~\unicode[STIX]{x03BC}$
m.

Can this hypothesis then explain the insensitivity of Taylor cones to the difference in size in silicone oil and extreme sensitivity in the case of castor oil? Our BEM calculation assumes a perfect conductor drop and a perfectly insulating oil and leads to the formation of asymmetric Taylor cones, only in the case of size asymmetry. BEM calculation with a finite conductivity of the oil and finite charge dynamics of brine can predict this dependence and will be a part of a future correspondence.
It should be noted that the theory of Bird et al. (Reference Bird, Ristenpart, Belmonte and Stone2009) for symmetric cone angles cannot predict coalescence/non-coalescence in the cone–dimple pattern mode of interaction. Moreover, it is not straightforward to argue why the capillary number should be higher for the cone–dimple case than for the cone–cone case.
3.3 Are the bridges permanent or transient?
An important question of relevance here is whether the non-coalescence between two droplets leads to the formation of a bridge? The bridge-like structure is especially prominent at high frequencies. In fact, Thiam, Bremond & Bibette (Reference Thiam, Bremond and Bibette2009) mention a stable bridge formation at frequencies of the order of around 5 kHz. To resolve this issue, high-speed imaging was conducted at 41 000 frames per second (see supplementary movie 5, which is slowed down to
 $5~\text{frames}~\text{s}^{-1}$
). Our high-speed imaging results show that transient bridges are formed at all frequencies. The apparent length of the bridge (
 $H_{b}$
) depends upon the frequency of the applied field. The
 $H_{b}$
is really the distance travelled by the drops before they reverse direction. A balance of drag force leads to electrostatic force as
 $4\unicode[STIX]{x03C0}\unicode[STIX]{x1D707}a(\text{d}H_{b}/\text{d}t)=qE$
, where
 $\unicode[STIX]{x1D707}$
is the viscosity and
 $q$
is the charge on the drops. The drops discharge as
 $q=q_{0}\text{e}^{-(t/\unicode[STIX]{x1D70F})}$
, where
 $q_{0}$
is determined by fitting the expression data with experiments and
 $\unicode[STIX]{x1D70F}$
is the charge relaxation time (
 $\unicode[STIX]{x1D70F}=(\unicode[STIX]{x1D716}\unicode[STIX]{x1D716}_{0}/\unicode[STIX]{x1D70E})$
) where
 $\unicode[STIX]{x1D70E}$
is the conductivity of the oil. The time
 $t$
is related to the frequency as
 $t=(1/f)$
, where
 $f$
is frequency in hertz. This leads to an apparent renormalized bridge length
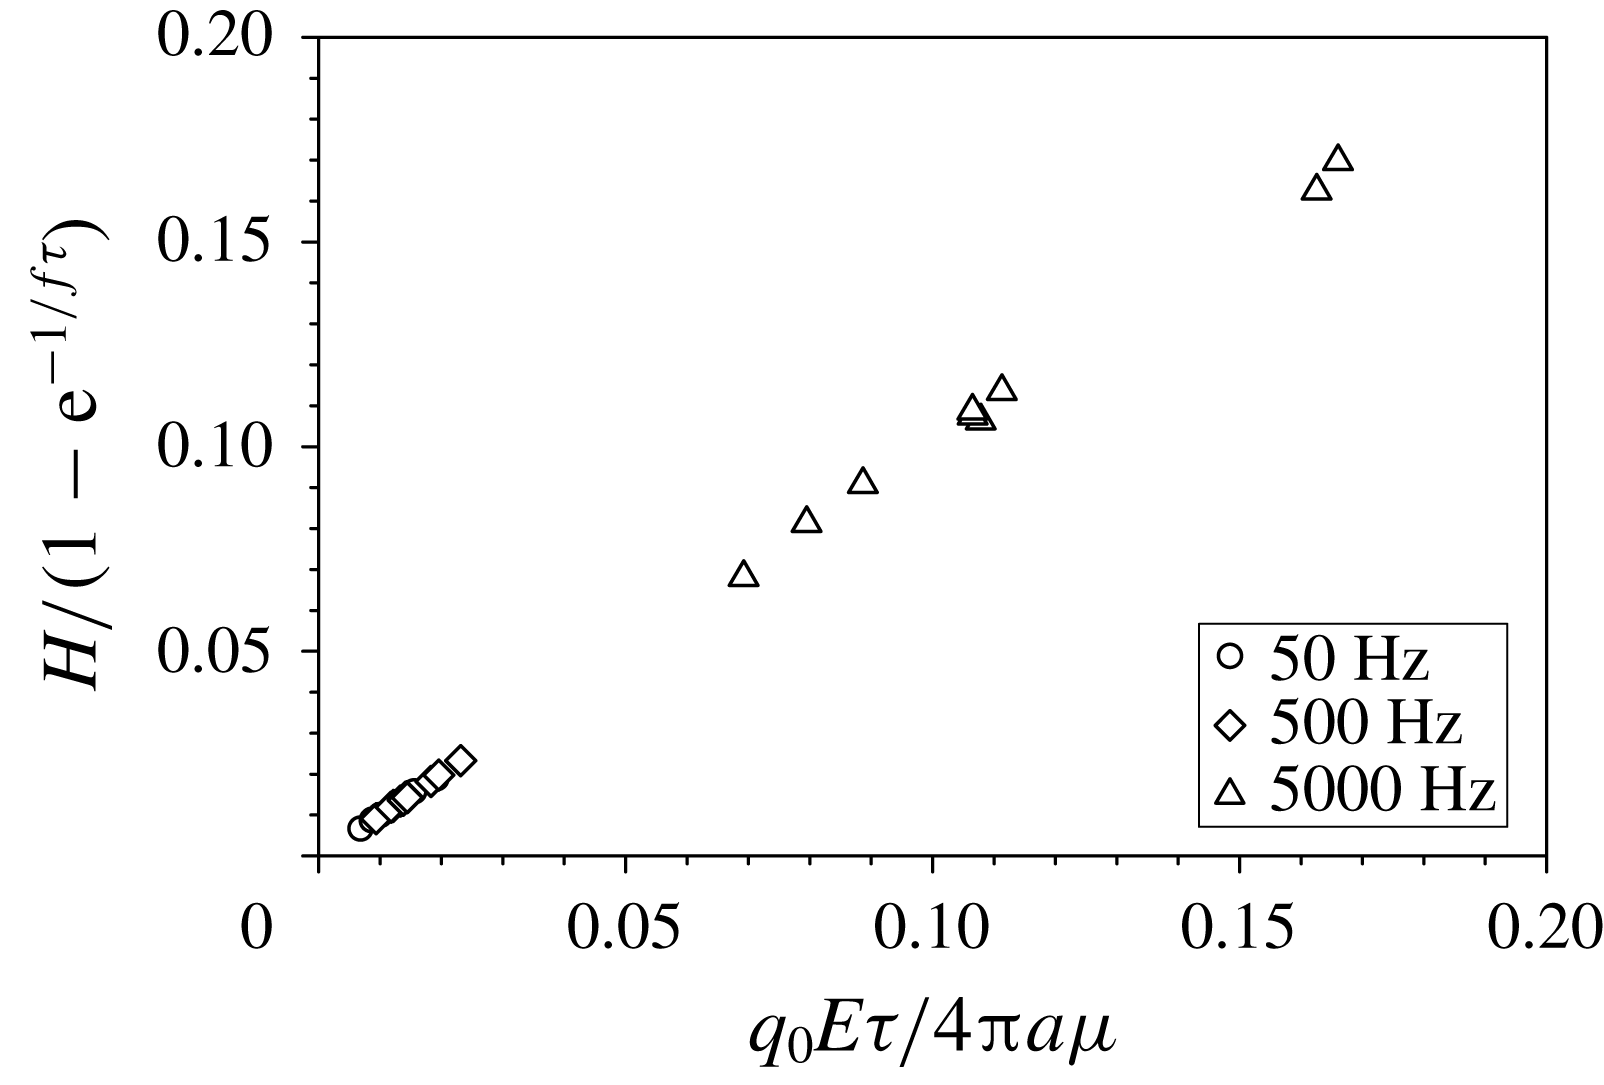
 $H_{b}=[(1-\text{e}^{-1/f\unicode[STIX]{x1D70F}})q_{0}E\unicode[STIX]{x1D70F}]/(4a\unicode[STIX]{x03C0}\unicode[STIX]{x1D707})$
and is plotted in figure 8 and yields
 $q_{0}\sim 10^{-11}$
C. This is of the same order as the charge on a hemisphere in a conducting sphere in an electric field (
 $3\unicode[STIX]{x03C0}a^{2}\unicode[STIX]{x1D716}\unicode[STIX]{x1D716}_{0}E=1.1\times 10^{-11}$
C; when typical values of
 $a=350~\unicode[STIX]{x03BC}$
m,
 $E=4\times 10^{5}$
V
 $\text{m}^{-1}$
and
 $\unicode[STIX]{x1D716}=2.7$
are used). Thus the apparent bridge observed in low-speed experiments is indeed a dynamic bridge wherein the bridge continuously forms and breaks, a characteristic of the non-coalescence process.
Renormalized apparent bridge length of two DI water drops in silicone oil. Here
 $q_{0}$
is fitted in the range of
 $1.1\times 10^{-11}$
to
 $13.5\times 10^{-11}$
C.

4 Conclusion
The coalescence of aqueous droplets in insulating oils is found to be sensitively dependent upon the conductivities of both the droplet phase as well as the oil phase. This is counterintuitive given that the deionized water droplets in nearly insulating oils have charge relaxation times varying by at least four orders of magnitude. The sensitivity of the coalescence process to conductivity of brine is essentially due to the very fast dynamics of the coalescence process which could result in the charge dynamics becoming relevant. Moreover, the small gaps and very large electric fields encountered before coalescence can lead to significant electric current and thereby charge loss even in weakly conducting oils. This has important implications in electrocoalescers wherein the conductivity of the aqueous and insulating phases can critically determine the performance of an electrocoalescer.
Acknowledgements
The authors would like to acknowledge the Department of Science and Technology (DST), India, for their financial support to this study.
Supplementary movies and material
Supplementary movies and material are available at https://doi.org/10.1017/jfm.2018.849.