


In neonates with hypoplastic left heart syndrome (HLHS), incorporation of the hypoplastic native aortic root into the reconstructed neo-aorta as part of the Norwood stage 1 palliation is essential to maintain coronary blood flow in a retrograde fashion. In these patients, native aortic root thrombus (NART) is a rare event with an incidence of 1.2% and may lead to the development of ventricular arrhythmias, electrocardiographic (ECG) signs of ischaemia, and sudden cardiac death. Reference Rajab and Mitchell1,Reference Owens, Gomez-Fifer and Ensing2 In patients with single ventricle physiology following Norwood operation who present with NART and develop acute decompensated heart failure, prompt treatment is crucial to prevent irreversible myocardial injury and includes surgical thrombectomy, catheter-directed thrombolysis, and systemic thrombolysis. Each one of these approaches carries significant risks. We describe the successful treatment of a 14-month-old with NART who suffered an acute myocardial infarction, with systemic thrombolysis leading to normalisation of systemic oxygen delivery and resolution of ECG and echocardiographic abnormalities.
Case report
A 14-month-old with HLHS mitral stenosis-aortic stenosis, status post-Norwood operation, and bidirectional Glenn palliation was diagnosed by transthoracic echocardiogram during a routine clinic visit with NART measuring 10 mm × 5.7 mm (Fig. 1, Online Supplementary Video 1). This echocardiographic finding was confirmed with a chest CT angiogram (Fig. 2). He previously had a hypercoagulability workup for inferior caval vein and carotid thrombus without abnormalities. He was admitted for therapeutic heparin bridge to warfarin. On hospital day 6, the patient developed acute distress, hypotension, and ST-segment depression (Figure 3a), followed by an acute wide complex polymorphic ventricular tachycardia (Figure 3b). Following initial resuscitation with oxygen supplementation and pain management, the rhythm gradually changed to an organised narrow QRS complex tachycardia (Figure 3c) with a 12-lead ECG consistent with ST-segment elevation myocardial infarction (STEMI) (Fig. 4).
Subcostal coronal view of the native aortic root thrombus designated by the black arrow.

Computed tomographic angiographic paracoronal view demonstrates a large thrombus in the native aortic root adjacent to the aortic valve designated by the measurement bar. DKS, Damus-Kaye-Stansel; LV, left ventricle; RV, right ventricle.

ST-segment changes ( a ) seconds before converting to a wide complex polymorphic ventricular tachycardia ( b ) and then organising back to a narrowed complex rhythm after morphine administration ( c ).

ST elevation in inferior leads and ST depression in I and aVL.

A STAT echocardiogram post decompensation no longer demonstrated the NART but showed new anterior and inferior wall motion abnormalities. Intracranial haemorrhage and stroke were ruled out with head CT and clinical exam. To avoid irreversible myocardial injury, prompt discussions with our cardiothoracic surgeon, cardiac intensivist, and interventional cardiologist concluded that there was a low likelihood of successful catheter-based or surgical recanalisation in this infant, and we elected to treat the patient with systemic tissue plasminogen activator (TPA). As per our institutional guidelines, a baseline coagulation profile and D-Dimer level were established prior to initiation of TPA with the plan to maintain normal levels of platelets, PT and INR, PTT, and fibrinogen, and monitor the expected increase in D-Dimer level. Patient blood type and screen were obtained, and packed red blood cells were ordered to be on standby in case of acute haemorrhage. In the ICU, TPA infusion was initiated, after discontinuation of heparin, and maintained at 0.5 mg/kg per hour for 6 hours. Four hours into the infusion, a coagulation profile was obtained and revealed no significant abnormalities. D-Dimer level increased from baseline of 893–4542 ng/mL (reference range ≤ 749 ng/mL). At the conclusion of the infusion, no complications were noted. Heparin infusion was resumed following that.
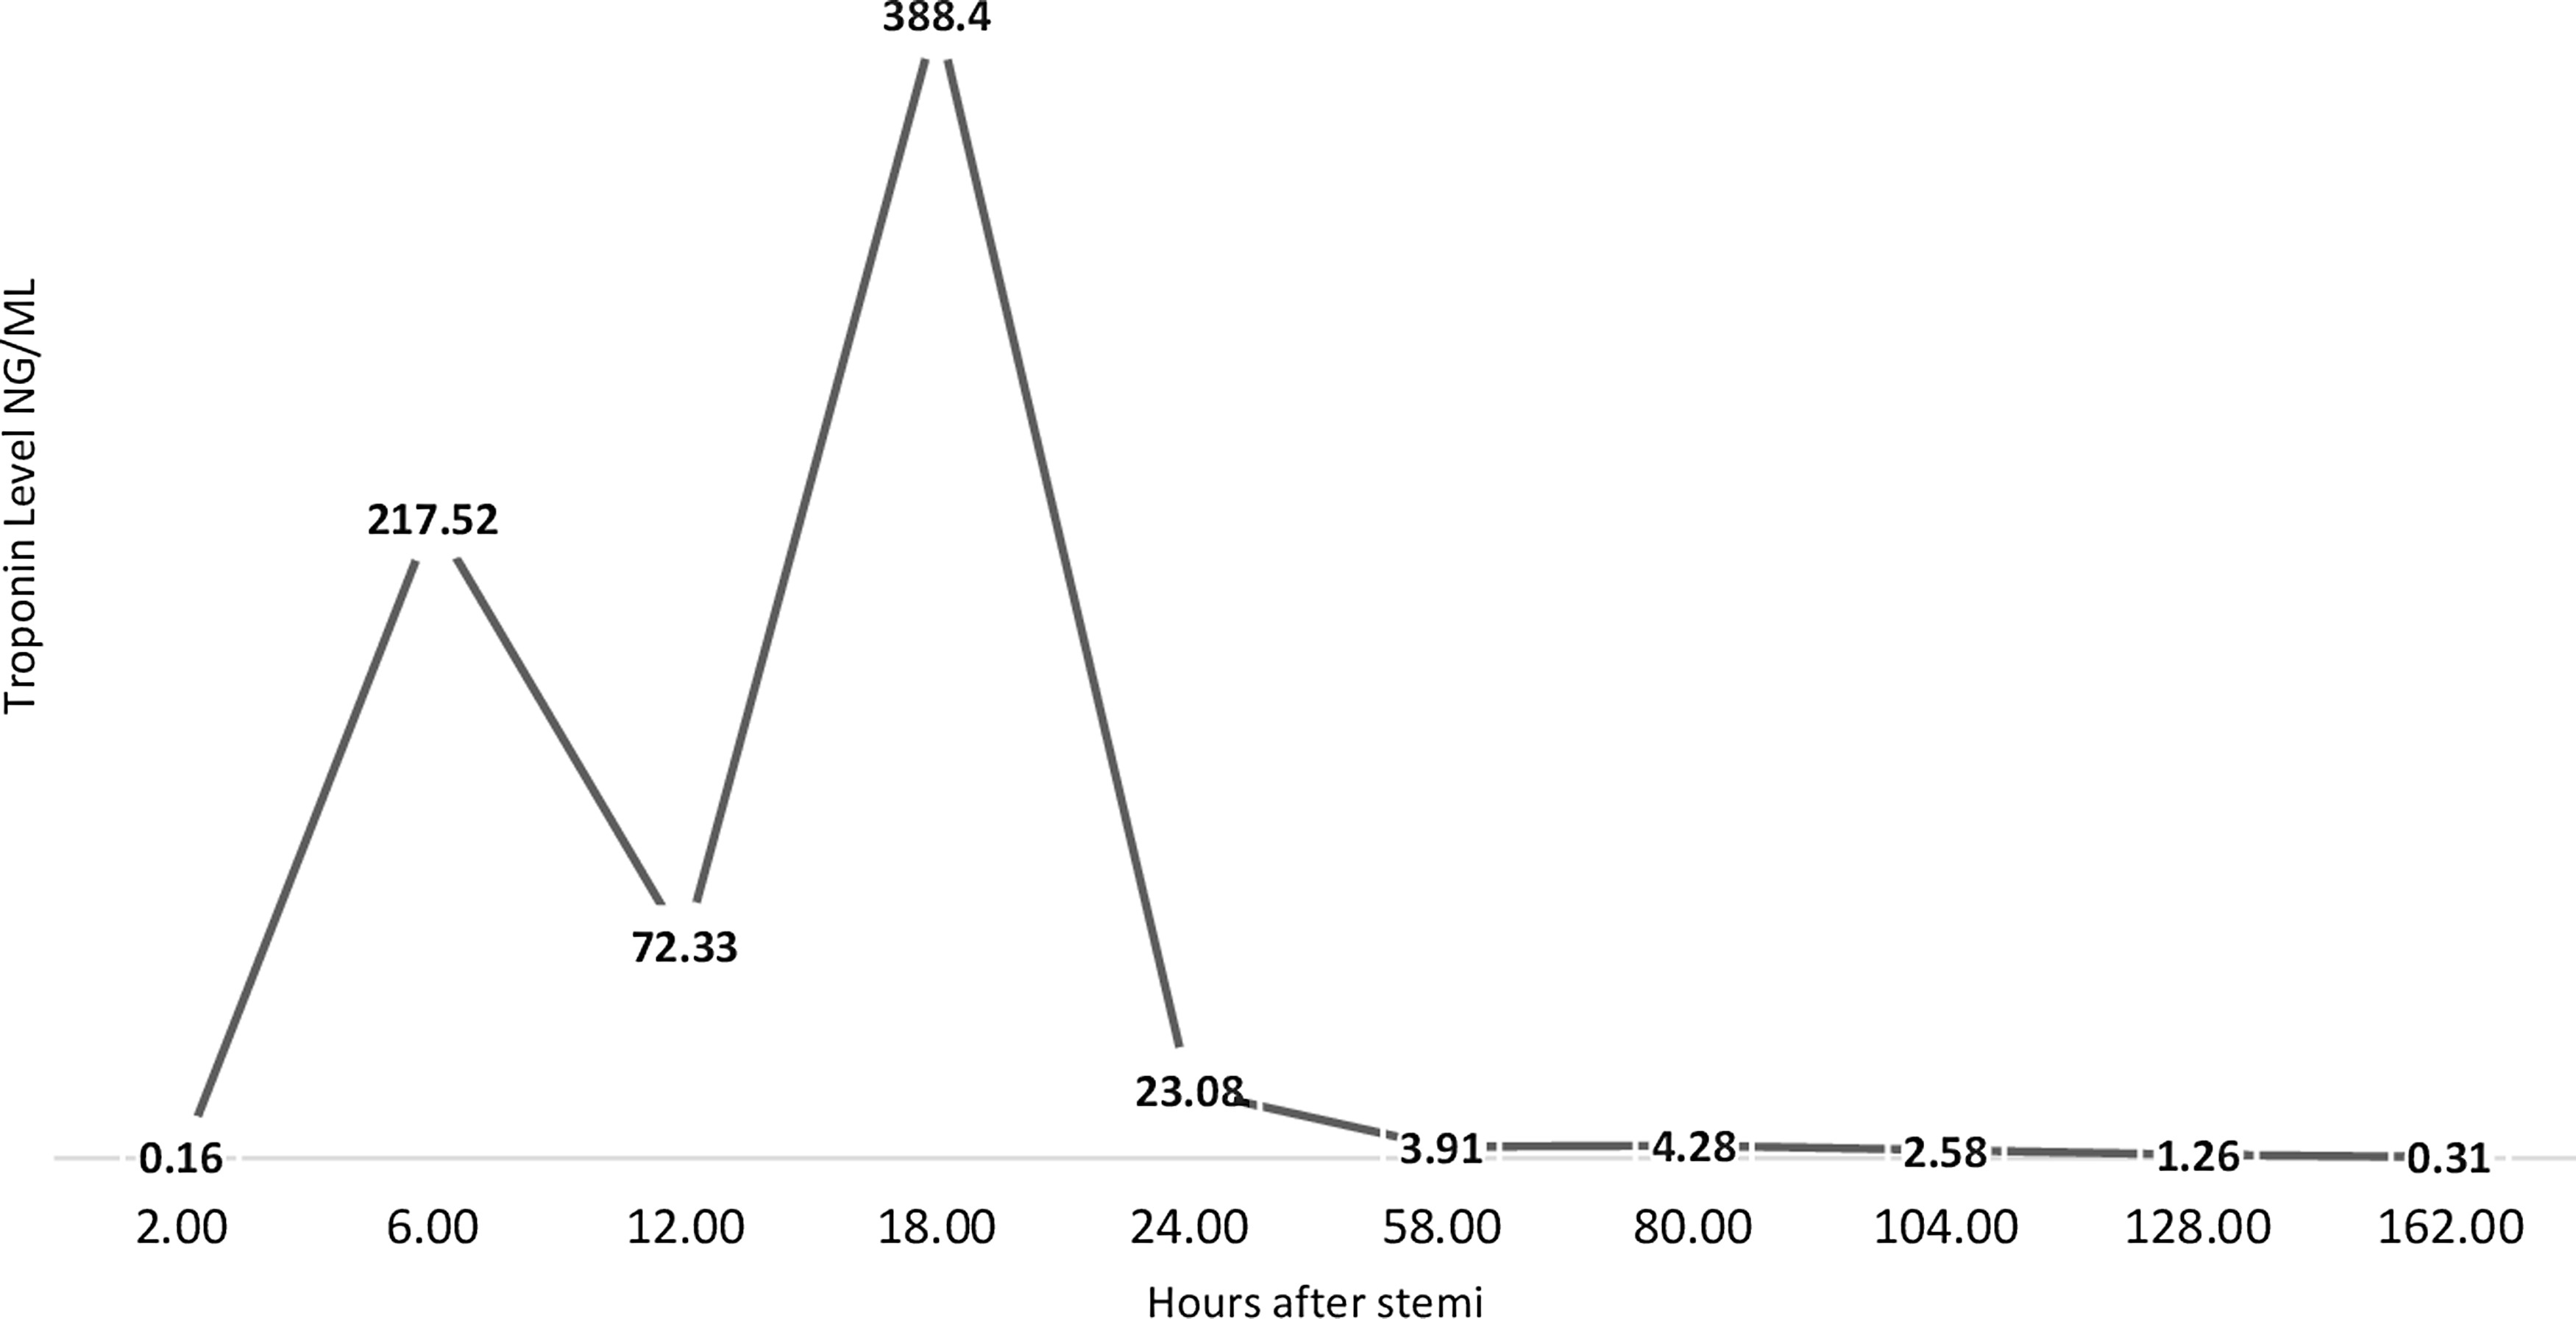
Two hours after discontinuing the TPA infusion, the patient’s regional wall motion abnormalities were resolved. His troponin I level peaked at 388.4 ng/mL (normal range 0–0.03 ng/mL) within the first 18 hours and then decreased (Fig. 5) until the day of discharge, 10 days following his acute decompensation. Prior to discharge, haematology was consulted, and the patient was converted from heparin to long-term anticoagulation with warfarin achieving an INR level between 2 and 3.
Troponin I level trends during the patient’s hospitalisation. The ordinate depicts the troponin I level (ng/mL) and the abscissa depicts the time (hours) following the ST-segment elevation myocardial infarction (STEMI).

It has been 2 years since the event, and the patient is doing well after the transition from warfarin to enoxaparin.
Discussion
This case of NART in a patient with univentricular heart disease who suffered a STEMI with echocardiographic evidence of regional wall motion abnormalities is not unique; however, because of the overall rarity of this phenomenon and the broad spectrum of clinical presentations and management strategies in this small subset of patients, we believe this case presentation is important to guide clinicians when facing a need to make prompt decisions in a high-risk situation.
With improved physiological, haematological, and biochemical monitoring of critically ill patients and increased awareness of thrombotic complications related to central venous lines, peripherally inserted central catheters, and ventricular assist devices, administration of systemic thrombolytics has gained more traction in dedicated cardiac ICUs. However, the decision to initiate this therapy requires multidisciplinary engagement with an in-depth discussion of the risks and benefits as they relate to each individual patient.
The patient we report represents a high-risk clinical scenario because of the single ventricle physiology, a complex surgical and catheterisation history that included multiple sternotomies, and difficult vascular access. Surgical or catheterisation-based intervention in this patient would have been challenging given the risk of embolisation. The level of complexity was heightened following the dislodgement of the NART and suspected distal coronary occlusion, given the lack of optimal catheter-based recanalisation options related to size. In view of these considerations and the time-sensitive need for myocardial reperfusion, we proceeded with systemic thrombolysis. Our approach was informed by other centres’ clinical protocols as well as our own institutional experience and guidelines. Reference McCrindle, Rowley and Newburger3–Reference Burns, El-Said, Tremoulet, Friedman, Gordon and Newburger5
STEMI is rare in paediatrics and usually associated with Kawasaki disease, nephrotic syndrome, and hypercholesterolaemia. Reference Suryawanshi, Das and Patnaik6,Reference Burns, El-Said, Tremoulet, Friedman, Gordon and Newburger5,Reference Charfeddine, Yousfi, Maalej, Triki, Abid and Kammoun7 NART in HLHS should be closely monitored in those with risk factors of haemodynamic changes, recent cardiotomy, aortic atresia or aortic stenosis with trivial antegrade flow, antegrade flow through native aorta competing with retrograde flow leading to stasis, length of native aortic root, and hypercoagulability. Reference Rajab and Mitchell1 Some children remain at risk of sudden cardiac death even after long-term anticoagulation treatment. Reference Owens, Gomez-Fifer and Ensing2 Family education regarding anticoagulation prior to discharge is vital for this vulnerable and complex group of patients. Given the risk of repeat NART, close follow-up is required.
Supplementary material
The supplementary material for this article can be found at https://doi.org/10.1017/S1047951124025150.
Financial support
None.
Competing interests
None.
Patient consent
Consent has been signed for submission of the case report to the journal.