Implications
Insulin is a key hormone in mediating effects of nutrition on follicular growth. In this regard, this study showed that one potential pathway for its action is through enhancement of growth hormone receptor (GHR) mRNA expression in granulosa cells. Moreover, this study has shown that short-term fasting did not affect either the follicular diameter or the expression of GHR/IGF-I mRNA in the pre-ovulatory follicle. In summary, the injection of insulin has a positive effect on locally expressed genes, whereas fasting did not, and probably a longer period of undernutrition is necessary to affect follicular growth in the ewe.
Introduction
Reproductive performance can be negatively affected in periods of food deprivation. In this regard, ovarian follicular growth can be compromised, since it is controlled by several systemic and local intraovarian factors (Spicer et al., Reference Spicer, Crowe, Prendiville, Goulding and Enright1992). Physiologically, various metabolic messengers, including insulin and glucose, function to convey nutritional status to other systems within the body (Whitley et al., Reference Whitley, McFadin-Buff and Keisler2000). Thus, limited food resources can reduce reproductive function to an extent dependent upon the degree of food restriction (Mackey et al., Reference Mackey, Wylie, Sreenan, Roche and Diskin2000) and the reproductive status at the time of the restriction (Smith, Reference Smith1988).
The GHR, which modulates IGF-I synthesis under growth hormone (GH) control (Jones and Clemmons, Reference Jones and Clemmons1995), is found in greatest abundance in the liver (Bornfeldt et al., Reference Bornfeldt, Arnqvist, Enberg, Mathews and Norstedt1989). However, GHR is also found in other tissues, including the ovary, where it is expressed in the corpus luteum (Juengel et al., Reference Juengel, Nett, Anthony and Niswender1997) and follicle (theca and granulosa cells) (Eckery et al., Reference Eckery, Moeller, Nett and Sawyer1997) of ewes.
During periods of food deprivation, the resulting negative energy balance disrupts the functionality of the GH–IGF-I axis (Radcliff et al., Reference Radcliff, McCormack, Keisler, Crooker and Lucy2006). In this situation, IGF-I expression is no longer capable of increase in response to the secretion of GH by the pituitary (Vicini et al., Reference Vicini, Buonomo, Veenhuizen, Miller, Clemmons and Collier1991). This happens because insulin concentration is reduced, and so is GHR expression in the liver (Butler et al., Reference Butler, Marr, Pelton, Radcliff, Lucy and Butler2003). However, the infusion of insulin during negative energy balance is able to restore the coupling of the GH–IGF-I axis and increase circulating IGF-I concentration (Butler et al., Reference Butler, Marr, Pelton, Radcliff, Lucy and Butler2003).
IGF-I acts synergistically with the gonadotrophins to increase estradiol production by follicles (Adashi, Reference Adashi1998). However, there is conflicting evidence that ovarian IGF-I production is regulated by GH, as it is in the liver (Lucy, Reference Lucy2000), and therefore the intrafollicular IGF-I origin remains unclear. In addition to that, a systemic decrease of IGF-I is not followed by intrafollicular decrease of its levels in large follicles (Spicer et al., Reference Spicer, Crowe, Prendiville, Goulding and Enright1992), as observed in medium follicles (Schoppee et al., Reference Schoppee, Armstrong, Harvey, Whitacre, Felix and Campbell1996). These data indicate that systemic and ovarian IGF-I production in large follicles is not subjected to the same regulatory factors and that it is important to uncover which factors can alter ovarian expression of IGF-I. In the sheep ovary, IGF-II is more expressed than IGF-I (Hastie et al., Reference Hastie, Onagbesan and Haresign2004). Despite that, IGF-II is less responsive to nutritional challenges (Lucy, Reference Lucy2000) and is not under GH control (Lucy et al., Reference Lucy, Bilby, Kirby, Yuan and Boyd1999).
Considering these points, this study was designed to investigate the effect of fasting and insulin administration on the metabolic profile and expression of GHR and IGF-I mRNA in the theca and granulosa cells of the ewe pre-ovulatory follicle.
Material and methods
Animal welfare
The Committee for Ethics in Animal Experimentation from the Federal University of Pelotas has approved all procedures performed in this experiment.
Animals and treatments
Multiparous crossbred ewes (Ovis aries, Corriedale × Texel, n = 15), non-lactating and 2.5 years old, weighing 54.06 ± 5.44 and having a body condition score (BCS) of 3.10 ± 0.22 (1 = lean and 5 = obese; Russel, Reference Russel1991), were used during the breeding season in southern Brazil (31°48′S, 52°24′W). The ewes were housed in indoor stalls (2.00 × 3.50 m) and grouped by BCS and weight into three groups of five ewes. The diet was based on tifton hay (1.5 kg of dry matter (DM)) and concentrate (0.5 kg of DM; 47.5 g of ether extract, 193.4 g of crude protein, 1194.5 g of neutral detergent fiber and 931.5 g of acid detergent fiber) according to NRC (1985), and ad libitum access to water.
The ewes were subjected to a pre-synchronization protocol with intravaginal sponges containing medroxiprogesterone acetate (60 mg; DEG, São Paulo, Brazil). The sponges were placed for 14 days. Estrus detection was performed after sponge removal by visual observation thrice daily at 0800 h, 1200 h and 1900 h; ewes detected in estrus were considered on day 0 of the next estrous cycle. Approximately 11 days after detected estrus, all ewes received an injection of 125 μg of sodium cloprostenol (i.m., Ciosin®, Schering-Coopers, Cotia, Brazil), and 36 h later, 100 μg of gonadorelin (i.m., Fertigen®, Tortuga, Sto. Amaro, Brazil) in order to induce the ovulation within 24 h. Twenty-four hours after gonadorelin injection (expected time of ovulation and new follicular wave emergence), an intravaginal progesterone releasing device (CIDR, Eazi-Breed CIDR®, InterAg, Hamilton, New Zealand) was inserted and remained in the ewes for 6 days, when 125 μg of sodium cloprostenol (i.m., Ciosin®, Schering-Coopers, Cotia, Brazil) was injected. Such protocol allows that all ewes have a pre-ovulatory follicle with an average 6 mm of diameter at CIDR withdraw (Viñoles et al., Reference Viñoles, Forsberg, Banchero and Rubianes2001). The moment of CIDR removal was considered day 0 of the experiment. On day −2, the ewes were assigned to one of the experimental groups: (i) control group (n = 5), which received a maintenance diet during the entire experimental period; (ii) fasting group (n = 5), from which food was completely removed from day −2 to day 2 and which only had access to water; and (iii) insulin group (n = 5), which received the same diet as the control group plus injections of human recombinant insulin (s.c., 0.25 IU/kg, Novolin® N, Novo Nordisk, Bagsvaerd, Denmark) twice daily from day −2 to day 2.
Blood sampling
Blood samples were taken daily from day −2 to day 2 by jugular venipuncture before the first morning meal (after 12 h of fasting or last insulin injection). Samples were collected in two 10-ml vacutainer tubes (BD Diagnostics, São Paulo, Brazil), either containing EDTA or EDTA and potassium fluoride. Tubes were centrifuged (1000×g for 20 min) and plasma separated and stored in microtubes at −80°C until evaluation.
Metabolite and hormone assays
Concentrations of glucose and non-esterified fatty acids (NEFA) were evaluated from day −2 to day 2 by final point enzymatic colorimetric reactions quantified by a spectrophotometer (FEMTO 700 Plus, Femto Ind. e Com. de Instrumentos Ltda., São Paulo, Brazil) in a single batch. The reactions to measure glucose (Glicose PAP Liquiform, Labtest®, Lagoa Santa, Brazil; Cenci et al., Reference Cenci, Louvandini, McManus, Dell'Porto, Costa, Araujo, Minho and Abdalla2007) and NEFA (Wako NEFA-HR, Wako Chemicals USA®, Richmond, United States; Al-Mamun et al., Reference Al-Mamun, Goto, Chiba and Sano2009) were performed as recommended by the manufacturers, and had a minimum detection limit of 0.02 mmol/l and 0.01 mmol/l, respectively. The intra-assay coefficients of variation were 2.66% for glucose and 1.50% for NEFA.
Plasma insulin concentrations, from day −2 to day 2, were evaluated by radioimmunoassay (KIP1254, BioSource Europe®, Nivelles, Belgium; Kosior-Korzecka et al., Reference Kosior-Korzecka, Bobowiec and Lipecka2006) with a minimum detection limit of 11.5 μIU/ml. According to the manufacturer, cross-reactivity with ovine insulin is 100%. The intra-assay coefficients of variation were 5.22% and 2.44%, respectively, for low and high insulin concentrations. The inter-assay coefficients of variation were 0.89% and 1.86%, respectively, for low and high insulin concentrations.
Plasma IGF-I concentrations, on days −2, 0 and 2, were also evaluated by radioimmunoassay (DSL-5600, Diagnostics Systems Laboratory®, Webster, USA; Puchala et al., Reference Puchala, Prieto, Banskalieva, Goetsch, Lachica and Sahlu2001), after an acid–ethanol extraction step (Underwood and Murphy, Reference Underwood and Murphy1987) in which IGF-I was separated from its binding proteins, and had a minimum detection limit of 2.25 ng/ml. The intra-assay coefficients of variation were 5.14% and 9.15%, respectively, for low and high IGF-I concentrations. The inter-assay coefficients of variation were 1.06% and 0.66%, respectively, for low and high IGF-I concentrations.
Progesterone concentrations were measured using electrochemiluminescence immunoassay (Elecsys 2010, Roche Diagnostics, Basel, Switzerland) with Progesterone II kits (Roche Diagnostics, Manheim, USA; Bargouli et al., Reference Bargouli, Tsantarliotou, Brozos, Kokolis and Boscos2007) in a single batch. The detection limit of the assay was 0.03 ng/ml and the intra-assay coefficient of variation was 5.4%.
Follicle dissection
On day 2, approximately 30 h after CIDR removal, all ewes were killed at a local slaughterhouse and ovaries were collected in individual sterile flasks containing saline and transported to the laboratory on ice. The procedures for follicular dissection were adapted from Cao et al. (Reference Cao, Buratini, Lussier, Carriere and Price2006). Only the largest follicle (pre-ovulatory) in the pair of ovaries was dissected (1 follicle/ewe) and its diameter considered for further analysis. The follicular fluid was aspirated and the antral cavity was flushed repeatedly with cold saline, which was collected into 1.5-ml microtubes. Granulosa cells were recovered from the fluid by centrifugation at 1200×g for 1 min. Later, the follicle was sliced in two halves, allowing access to the theca interna layer, which was removed with fine forceps and washed in saline by passing repeatedly through a 3-ml syringe. The samples were collected into 1.5-ml microtubes containing Trizol (Invitrogen®, Carlsbad, USA) and frozen at −80°C until RNA extraction.
Real-time RT-PCR analysis
Total RNA was extracted using Trizol (Invitrogen®) according to the manufacturer's instructions. Integrity of the extracted RNA was determined by staining the samples of total RNA with ethidium bromide, followed by electrophoresis on a 1.5% agarose gel. Only RNA with intact 18S and 28S bands was used.
Total RNA was treated with DNAse I (DNAse Amp Grade, Invitrogen®, Carlsbad, USA) to remove genomic DNA contamination and primed with oligo(dT)20 to synthesize single strand cDNA (SuperScript III First-Strand Synthesis Supermix, Invitrogen®, Carlsbad, USA). The PCR amplifications and fluorescence detection, using the cDNA obtained in the previous step, were performed in duplicate in the ABI Prism 7500 Sequence Detection System (Applied Biosystems®, Foster City, USA), using the SYBR Green detection chemistry (Platinum SYBR Green qPCR SuperMix-UDG kit, Invitrogen®, Carlsbad, USA), as recommended by the manufacturer. The PCR parameters were 5 min at 50°C and 10 min at 95°C followed by 40 cycles of 95°C for 30 s and 60°C and 72°C for 1 min each. The primer sequences were as follows: GHR (for CCA GTT TCC ATG GTT CTT AAT TAT, Rev TTC CTT TAA TCT TTG GAA CTG G; Pfaffl et al., Reference Pfaffl, Georgieva, Georgiev, Ontsouka, Hageleit and Blum2002), IGF-I (for TCG CAT CTC TTC TAT CTG GCC CTG T, Rev GCA GTA CAT CTC CAG CCT CCT CAG A; Pfaffl et al., Reference Pfaffl, Georgieva, Georgiev, Ontsouka, Hageleit and Blum2002) and β-actin (for CTA GGC ACC AGG GCG TCA TG, Rev CTT AGG GTT CAG GGG GGC CT).
The PCR reaction efficiencies and cycle thresholds from the fluorescence readings of individual wells during the reaction were calculated using PCR Miner (http://www.miner.ewindup.info/). For each sample, a mean cycle threshold of two PCR reactions was calculated. In addition, the expression of each target gene of interest was calculated relative to β-actin using the equation: relative target gene expression = (1/Etarget^CTtarget)/(1/Eβ-actin^CTβ-actin), where E was the reaction efficiency and CT was the cycle threshold (Cikos and Koppel, Reference Cikos and Koppel2009). The mean coefficient of variation among sample CT's was 1.19%. The specificity of each primer was verified by the detection of only one fluorescence peak at the dissociation curve for each replicate at the end of the PCR.
Statistical analysis
The results are presented as means ± s.e.m. All the statistical analyses were performed with SAS 9.0 (SAS Institute Inc. Cary, NC, USA). Analyses involving repeated measures over time (NEFA, glucose, insulin and IGF-I) were compared among groups, by analysis of variance for repeated measures using the MIXED procedure to evaluate the main effects of the group, day and their interactions. Only one follicle per ewe was considered for diameter measurement and expression analysis, in a total of five follicles per group. Follicular diameter and gene expression were log transformed and analyzed by one-way analysis of variance. The correlation among parametric variables was assessed using Pearson's correlation coefficient (r). A value of P < 0.05 was considered statistically significant.
Results
Estrous synchronization and follicle diameter
All ewes ovulated with the injection of gonadorelin before CIDR insertion, since they presented a corpora lutea at day 2. The progesterone concentration at CIDR insertion was 0.87 ± 0.06 ng/ml, which indicates that the ewes did not have a functional corpus luteum at the moment of gonadorelin injection and CIDR insertion.
The diameter of the pre-ovulatory follicle was not different among the groups (P = 0.25). Although not different, the Insulin group had a tendency to increase the pre-ovulatory follicle diameter in comparison to the control group (8.6 ± 0.87 and 7.1 ± 0.55 mm, respectively; P = 0.12), whereas the fasting group had a pre-ovulatory follicle of 7.4 ± 0.36 mm.
Metabolite and hormone concentrations
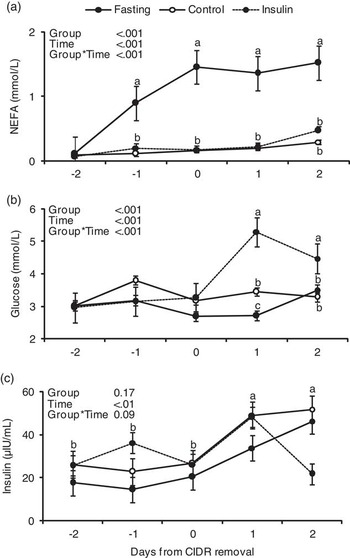
Daily hormonal concentrations of NEFA, glucose and insulin and a group-by-day effect for these parameters are shown in Figure 1.
Plasma non-esterified fatty acids (NEFA; mmol/l) (a) glucose (mmol/l) (b) and insulin (μIU/ml) (c) ±s.e.m. for ewes during the experiment in the fasting, control and insulin groups from day −2 through day 2. Different superscripts indicate differences at P < 0.05 between groups (a) and (b) and at P < 0.05 between days (c).

There were effects of group, time and group-by-time interaction on the concentration of NEFA (P < 0.001). Fasting increased plasma NEFA concentrations from day −1 to day 2 (P < 0.001) in comparison to day −2.
There were effects of group, time and group-by-time interaction on the concentration of glucose (P < 0.001). Glucose concentration was increased on days 1 and 2 in the insulin group (P < 0.05). Overall glucose concentration tended to be higher in the control group than in the fasting group (P = 0.07), and was higher in the insulin group (P < 0.05).
There was an effect of time (P = 0.001), but no effect of group (P = 0.16), on plasma concentrations of insulin. There was a tendency for group-by-time interaction on plasma concentrations of insulin (P = 0.09). Overall, disregarding groups, insulin concentrations were higher on days 1 and 2 (after CIDR removal) in comparison to days −2, −1 and 0 (during CIDR treatment; P < 0.05).
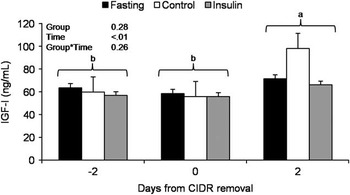
Plasma IGF-I concentration did not differ between groups on days −2, 0 and 2 (P > 0.05). However, overall IGF-I concentration was higher on day 2 than on days −2 and 0 (during CIDR treatment; P < 0.05; Figure 2).
Plasma IGF-I (ng/ml) ± s.e.m. for ewes during the experiment in the fasting, control and insulin groups on days −2, 0 and 2. Different superscripts show significantly different values between days (P < 0.05).

Follicular GHR and IGF-I mRNA expression
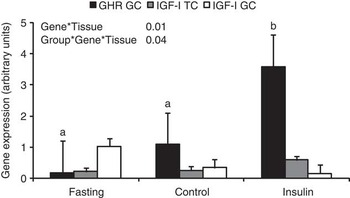
Expression of GHR and IGF-I mRNA in the theca and granulosa cells is presented in Figure 3. Average GHR mRNA expression was 172 times higher (P < 0.05) in the granulosa than theca interna cells, and thus its expression was considered virtually absent in theca cells. Moreover, GHR mRNA expression on granulosa cells was higher in the insulin group than in the fasting and control groups (P < 0.05). However, IGF-I mRNA expression did not change between the ovarian compartment and treatment over the period (P > 0.05). There was no correlation between GHR and IGF-I mRNA in granulosa cells (P = 0.58, r = 0.16).
Expression of GHR and IGF-I mRNA ± s.e.m. in the granulosa (GC) and theca cells (TC) of the pre-ovulatory follicle on day 2 of the experiment in the fasting, control and insulin groups. Different superscripts show significantly different values between groups in the same tissue (P < 0.05). The GHR mRNA expression in theca cells was very low and therefore omitted in the figure.

Interaction between variables
There was a positive interaction between glucose concentration on day 1 and pre-ovulatory follicular diameter (P < 0.05, r = 0.63), and glucose concentration on day 1 and granulosa cell GHR mRNA expression (P < 0.05, r = 0.65).
Discussion
The hormonal treatment used in this study was effective in developing the pre-ovulatory follicles, since every ewe had a follicle larger than 5 mm on the day of the ovary recovery. The results of this study showed that exogenous insulin administration increased GHR mRNA expression in granulosa cells of the pre-ovulatory follicle without concomitant changes in IGF-I mRNA expression. In addition, fasting induced no changes in GHR/IGF-I mRNA expression in the pre-ovulatory follicle. This result led us to think that insulin injection can positively affect the ovulatory competence and health of large follicles, through increased GH responsiveness not mediated by changes in local IGF-I secretion.
The dose and type of insulin used in this study was the same as that used in a previous study in cattle (Simpson et al., Reference Simpson, Chase, Spicer, Vernon, Hammond and Rae1994). Although the authors reported a significant effect on serum insulin and glucose concentration (Simpson et al., Reference Simpson, Chase, Spicer, Vernon, Hammond and Rae1994), the same was not observed in this study. This could be related to the moment and frequency of blood collections during the 24-h period. The increased glucose concentration observed in the insulin group after CIDR removal is in agreement with previous observations by Downing and Scaramuzzi (Reference Downing and Scaramuzzi1997) also in ewes, and is part of a rebound effect due to low glucose concentrations, probably in the period between blood collections. Even though no data for ewes were available, exogenous insulin increased follicular growth in cattle (Simpson et al., Reference Simpson, Chase, Spicer, Vernon, Hammond and Rae1994) and buffaloes (Ramoun et al., Reference Ramoun, Osman, Darwish, Karen and Gamal2007). Despite that, only a numerical increase in the diameter of the pre-ovulatory follicle in the insulin group was observed, probably due to the lack of statistical power. On the one hand, previous data in cattle indicated that fasting can decrease follicular diameter (Jorritsma et al., Reference Jorritsma, de Groot, Vos, Kruip, Wensing and Noordhuizen2003), and although no data for follicular diameter in fasted ewes were available, Kosior-Korzecka et al. (Reference Kosior-Korzecka, Bobowiec and Lipecka2006) observed a significant reduction in the ovulation rate. On the other hand, Alexander et al. (Reference Alexander, Kiyma, McFarland, Van Kirk, Hallford, Hawkins, Kane and Moss2007) observed that fasted ewes had a delayed LH surge and reduced estradiol secretion after PGF injection, without affecting the ovulation rate.
Regarding gene expression, the present results indicate that there is GHR mRNA expression in the granulosa cells at higher levels than theca cells of the pre-ovulatory follicle, in agreement with observations from Eckery et al. (Reference Eckery, Moeller, Nett and Sawyer1997). In addition, expression of IGF-I mRNA was detected in the theca interna and granulosa cells of the pre-ovulatory follicle as reported elsewhere (Leeuwenberg et al., Reference Leeuwenberg, Hurst and McNatty1995; Khalid et al., Reference Khalid, Haresign and Luck2000), although, according to Spicer et al. (Reference Spicer, Echternkamp, Wong, Hamilton and Vernon1995), only 5% of the ovine pre-ovulatory follicles expressed IGF-I mRNA and no follicular expression of IGF-I mRNA was detectable by in situ hybridization (Perks et al., Reference Perks, ning-Kendall, Gilmour and Wathes1995). The high variability in the detection of IGF-I mRNA among different studies could be due to the technique used to detect it. The same controversy existed for the detection of IGF-I in the bovine follicle and, more recently, a study using real-time RT-PCR has also detected considerable amounts of IGF-I mRNA in granulosa cells from ovulatory follicles (Rhoads et al., Reference Rhoads, Meyer, Kolath, Lamberson and Lucy2008).
Exogenous insulin administration increased GHR mRNA expression in the granulosa cells of the pre-ovulatory follicle of ewes. This result could be related to the increased glucose concentrations of the insulin group, since glucose upregulates hepatic GHR mRNA expression in pig hepatocytes in a dose-dependent way (Brameld et al., Reference Brameld, Gilmour and Buttery1999). This observation is further supported by the positive correlation between glucose and GHR mRNA expression in granulosa cells and confirms that insulin effects are largely dependent on glucose concentrations. In contrast and differently from our expectation, IGF-I mRNA expression did not change in the theca interna and granulosa cells as a result of fasting or insulin administration. However, the lack of correlation between GHR and IGF-I mRNA in the granulosa cells of large follicles has also been suggested in cattle (Rhoads et al., Reference Rhoads, Meyer, Kolath, Lamberson and Lucy2008), since there is no clear evidence that GH controls IGF-I secretion in the follicle (Lucy, Reference Lucy2000). Despite that, evidence indicates that IGFBP-2 to −6 (IGF-binding protein) are expressed in the ovine follicle (Hastie and Haresign, Reference Hastie and Haresign2010) and that insulin levels can modulate free IGF-I availability through the modulation of IGFBP levels (Butler et al., Reference Butler, Marr, Pelton, Radcliff, Lucy and Butler2003). In this way, although IGF-I mRNA expression was not different among groups, its intrafollicular availability could have been altered due to the effects of insulin on IGFBP.
Increased concentrations of IGF-I and insulin were observed after CIDR removal in all groups. Apparently, the mechanism that regulates this could be linked to the increased estradiol secretion during the follicular phase (which starts after CIDR removal) that stimulates hepatic IGF-I secretion (Richards et al., Reference Richards, Wettemann, Spicer and Morgan1991) and pancreatic insulin secretion (Morimoto et al., Reference Morimoto, Cerbon, Alvarez-Alvarez, Romero-Navarro and Diaz-Sanchez2001). In summary, these results present further evidence in sheep for the already established idea that insulin and IGF-I play a major role in final follicular development and maturation in cows. However, further research is required to elucidate how this mechanism works in long-term food-deprived animals.
In conclusion, insulin administration increased GHR mRNA expression in granulosa cells of pre-ovulatory follicle of ewes without concomitant changes in IGF-I mRNA. However, fasting did not change GHR/IGF-I mRNA expression in the pre-ovulatory follicle.
Acknowledgments
This study was supported by CAPES (grant no. 106/2007) and CNPq.