Introduction
The hamster–Ancylostoma ceylanicum host–parasite combination is gaining increasing popularity as a model system for studying the immunology of hookworm infections and as a convenient system for evaluating the suitability of candidate antigens for inclusion in hookworm vaccines, prior to trials in humans (Bungiro et al., Reference Bungiro, Greene, Kruglov and Capello2001, Reference Bungiro, Sun, Harrison, Shoemaker and Capello2008; Mendez et al., Reference Mendez, Valenzuela, Wu and Hotez2005a, Reference Mendez, Zhan, Goud, Ghosh, Dobardzic, Wu, Liu, Deumic, Dobardzic, Liu, Bethony and Hotezb; Fujiwara et al., Reference Fujiwara, Geiger, Bethony and Mendez2006). Nevertheless, despite the 37 years since a strain of A. ceylanicum from dogs was first adapted for passage through hamsters (Ray & Bhopale, Reference Ray and Bhopale1972; Ray et al., Reference Ray, Bhopale and Shrivastava1972), our knowledge about the immune response of hamsters to this hookworm is still limited (Garside et al., Reference Garside, Behnke and Rose1989, Reference Garside, Behnke and Rose1990; Bungiro et al., Reference Bungiro, Sun, Harrison, Shoemaker and Capello2008). Hamsters cannot tolerate very heavy infections, but given suitable infection doses (usually fewer than 25 adult worms), they harbour chronic infections that can last for over 250 days (Behnke, Reference Behnke, Schad and Warren1990). Unlike the hamster–Necator americanus model system, adult hamsters can be infected with A. ceylanicum and therefore the model lends itself to challenge experiments enabling evaluation of acquired immunity in immunized and vaccinated animals (Bungiro et al., Reference Bungiro, Greene, Kruglov and Capello2001; Mendez et al., Reference Mendez, Zhan, Goud, Ghosh, Dobardzic, Wu, Liu, Deumic, Dobardzic, Liu, Bethony and Hotez2005b).
Hamsters suffer a marked attrition of villi, even in lightly infected animals, with villus heights declining in excess of 50% (Alkazmi et al., Reference Alkazmi, Dehlawi and Behnke2006) and even by as much as 90% (Alkazmi & Behnke, Reference Alkazmi and Behnke2010) depending on the number of resident adult worms. Coincidentally, the mucosa experiences marked crypt cell hyperplasia, the crypts deepening dramatically as the infection progresses. Both of these intestinal changes are normally seen during other nematode infections and are driven primarily by the Th2 arm of the mucosal response to helminth infection (Garside et al., Reference Garside, Grencis and Mowatt1992; Else & Finkelman, Reference Else and Finkelman1998; Lawrence et al., Reference Lawrence, Paterson, Wei, Liew, Garside and Kennedy2000; Gause et al., Reference Gause, Urban and Stadecker2003), but are usually much shorter in duration than in this hookworm model. Similar findings have been reported in hookworm-infected dogs and have been observed in biopsy specimens from infected human subjects (reviewed in Behnke, Reference Behnke, Gilles and Ball1991). However, the additional complication, not seen in other nematode infections, is that hookworms actually browse on the gut mucosa (Kalkofen, Reference Kalkofen1970; Loukas et al., 2005). Loss of height of villi is attributable therefore to both worm feeding and the accompanying immune response, but the relative importance of these two potential causes of villus atrophy in hookworm infections is not easy to dissect. The accompanying cellular changes are equally dramatic, with goblet cell, mast cell and eosinophil counts all rising intensively within 1–2 weeks of infection. Curiously, Paneth cell numbers decline (Alkazmi et al., Reference Alkazmi, Dehlawi and Behnke2008). Hamsters acquire strong protective immunity to challenge after the removal of the immunizing infection (Behnke et al., Reference Behnke, Guest and Rose1997), and the response to challenge is equally dramatic, with marked loss of villus height, increase in crypt depth, mucosal goblet cell and eosinophil hyperplasia, and interestingly a rebound in Paneth cell counts which persists for some time (Alkazmi & Behnke, Reference Alkazmi and Behnke2010).
Here, building on the experiment of Alkazmi & Behnke (Reference Alkazmi and Behnke2010), we report the response of a group of animals that were given a superimposed challenge infection, rather than one following earlier clearance of the immunizing dose of established adult worms. There is already some evidence that hookworms, including adult A. ceylanicum, are immunomodulatory in the hamster system (Behnke et al., Reference Behnke, Rose and Little1994; Mendez et al. Reference Mendez, Valenzuela, Wu and Hotez2005a; Dondji et al., 2008) and, therefore, we might have expected to see some evidence of interference with the expression of acquired immunity in animals given a superimposed challenge compared to those challenged after removal of the immunizing infection, and for this to be reflected in the accompanying mucosal response (Behnke et al., Reference Behnke, Hannah and Pritchard1983). However, superimposed challenge infections with hookworms are known to be resisted by dogs (Carroll & Grove, Reference Carroll and Grove1986), although not by humans (Ball & Bartlett, Reference Ball and Bartlett1969; Ogilvie et al., Reference Ogilvie, Bartlett, Godfrey, Turton, Worms and Yeates1978; Wright & Bickle, Reference Wright and Bickle2005), and since the hamster model is gaining increasing importance in hookworm research, it was of interest to determine their response to challenge infections administered in the presence of residual worms persisting from initial exposure to infection.
Materials and methods
Parasite
The strain of A. ceylanicum used was that maintained at the University of Nottingham since 1984, originally acquired from Dr Rajasekariah of Hindustan CIBA-Geigy Ltd, Bombay India. It is believed to be of dog origin. The methods employed for maintenance of the parasite, for worm recovery and faecal egg counts have all been described previously in full (Garside & Behnke, Reference Garside and Behnke1989; Behnke et al., Reference Behnke, Guest and Rose1997). In this experiment we used a low dose of larvae, for both the immunizing and challenge infections, to avoid the complications of excessive pathology and because the experiment was dependent on the hamsters surviving for at least 3 months after initial exposure to infection. The establishment of the primary immunizing infections was confirmed by faecal egg counts from Groups 2 and 5 on day 56 post-infection (pi) and all infected animals proved to be passing hookworm eggs at this time.
Worms were removed from infected animals by treatment with ivermectin (‘Ivomec super’ MSD AGVET, Division of Merk Sharp and Dohme Limited, The Netherlands). A stock concentration of 200 μg/ml drug was made by a 1 in 50 dilution using distilled water, and this was used to treat at 200 μg/kg body weight. Faecal egg counts were carried out on Group 4 initially on day 28pi to check that they had become infected with the immunizing infection, and all were passing eggs at this time. On day 56, 3 weeks after ivermectin treatment, no eggs were detected, indicating that the anthelminitic had been 100% effective in removing all established adult worms.
Hamsters
The Golden hamsters (DSN strain) used in this study were originally obtained from Harlan Olac in 1983 and since then maintained in the animal house of the School of Biology as a closed colony. Animals were kept under conventional animal-house conditions. Pelleted food and tap water were supplied ad libitum. Cages were cleaned twice weekly to prevent re-infection.
Since the colony was maintained under conventional animal-house conditions, the animals were exposed to various micro-organisms present in the environment. In order to prepare hamsters for infection and reduce other competing intestinal micro-organisms, all animals were pre-treated for 1 week with Emtryl (May & Baker, South Dagenham, Essex, UK; dimetridazole at a concentration of 1 g/l in drinking water), then for another week with Terramycin (Pfizer, Sandwich, Kent, UK; oxytetracycline hydrochloride, 3 g/l in drinking water), and were returned to normal drinking water for 1 week prior to infection. Animals were used at approximately 8–12 weeks of age.
Measurement of mucosal architecture and the cellular mucosal responses to infection
The methods used to measure the height of villi, the depth of the crypts of Lieberkühn and mitotic activity were described comprehensively by Alkazmi et al. (Reference Alkazmi, Dehlawi and Behnke2006). Methods for assessing the mast cell, goblet cell, eosinophil and Paneth cell responses were reported in full by Alkazmi et al. (Reference Alkazmi, Dehlawi and Behnke2008). In all the histological observations reported here we counted cells/mm2 of mucosal tissue on appropriately stained sections, using the Weible 2 graticule as described by Kermanizadeh et al. (Reference Kermanizadeh, Crompton and Hagan1997). Hence counts are expressed as cells/mm2 of mucosal tissue rather than as cells/villus crypt unit as in some other studies.
Experimental design
Seventy hamsters were allocated randomly to five experimental treatment groups, as shown in table 1. Initially three groups (2, 4 and 5) were infected orally with 50 infective larvae of A. ceylanicum on day 0. Five weeks after this primary or immunizing infection, Groups 3 and 4 were treated with ivermectin to remove all the worms. Group 3 animals, as the challenge control group, were also treated in case there was a residual effect against the subsequent infection, although none was expected given the 4-week interval to infection (Wahid et al., Reference Wahid, Behnke and Conway1989). Groups 3, 4 and 5 received 50 L3 on day 63 of the experiment, 28 days after the anthelmintic treatment. Five hamsters from all groups were killed on days 73 and 94 of the experiment (corresponding to days 10 and 31 after the second/challenge infection), but in addition five hamsters each from Groups 4 and 5 were also culled on days 80 and 87. These two groups, 4 and 5, were critical, with Group 4 experiencing the abbreviated primary infection, followed by 4 weeks without infection and then challenge, while Group 5 experienced the primary immunizing infection, followed by a superimposed challenge on day 63 pi. Earlier experiments have indicated that when hamsters are treated with anthelmintic during the course of a primary infection, most parameters of intestinal change, with the exception of Paneth cells, return to normal baseline values within 2 weeks (Alkazmi et al., Reference Alkazmi, Dehlawi and Behnke2006, Reference Alkazmi, Dehlawi and Behnke2008). The period between 35 and 63 days pi was therefore more than adequate to enable full recovery, and to save on animals and to simplify logistics, this group was not included in the current experiment.
Experimental design.

a These are the days from the start of the experiment. For Group 3 which received only the second infection, days 73 and 94 correspond to days 10 and 31 after primary infection. For Groups 4 and 5 which received both primary and secondary infections, days 73, 80, 87 and 94 correspond to days 10, 17, 24 and 31 after challenge.
Animals were weighed weekly for 2 weeks before the initial infections and then twice weekly thereafter, to enable animals suffering distress to be identified and culled. Although there was some weight loss among infected animals, this did not exceed 10% of body weight and none were culled (data not shown).
Statistical analysis
Differences between groups in worm burdens were examined using a two-way non-parametric analysis of variance (ANOVA) as described in Barnard et al. (Reference Barnard, Gilbert and McGregor2007), based on Meddis (Reference Meddis1984), employing bespoke software. First we conducted a general test of differences between worm burdens among the groups carrying worms. Then we tested for acquired immunity in Group 4 (expected from Alkazmi & Behnke, Reference Alkazmi and Behnke2010), comparing this group with the challenge control group (Group 3) on days 10 and 31 post-challenge (pc), with two-way ANOVA incorporating time and treatment as factors and making a specific prediction that worm burdens would be higher in Group 3. This was then repeated for Group 5. We then tested post hoc changes in worm burdens in specific groups over time, using the Mann–Whitney U test in SPSS (version 16.0.0 for Windows, SPSS Inc., Chicago, Illinois, USA) where 2 days were concerned and Spearman's Rank Correlation test when testing for changes over 4 days.
All other quantified parameters of the mucosal response to infection were examined by general linear models (GLM) in SPSS, fitting treatment (the five treatments) and time (days 10 and 31 pc excluding the values derived from Groups 4 and 5 hamsters culled on days 80 and 87). Models were scrutinized carefully for approximately normal distribution of residuals.
In addition, in Group 4 and 5 hamsters, for which data were derived on four separate days (73, 80, 87 and 94 of the experiment), we looked for changes over time. If the data appeared approximately linearly distributed, we employed linear parametric regression analysis (Pearson's) in SPSS, with days of the experiment as the independent factor. For non-linear trends, we fitted the best-fit curves in SPSS, and tested them for goodness of fit by F tests.
Results
Worm burdens
The mean worm burden of each experimental group at autopsy is shown in table 2. The naïve control group (Group 1) was without worms at autopsy. A general test in a two-way ANOVA, confined to Groups 2, 3, 4 and 5 and days 10 and 31 pc, indicated that there were significant differences between worm burdens among the groups (H = 15.7, df = 3, P = 0.0013) but no changes over time and no interaction between time and treatment.
Recovery of Ancylostoma ceylanicum on days after challenge infection.

Group 1 was entirely without worms at autopsy. Statistical analysis: two-way non-parametric ANOVA with: (1) All four treatment groups, confined to days 73 and 94, gave H 3 = 15.7, P < 0.005 for effect of treatment. Neither the effect of time, nor the interaction time × treatment were significant. (2) Confined to Groups 4 and 5, but including all 4 days (time), gave H 1 = 17.89, P < 0.0005. Neither the effect of time (days after challenge) nor the interaction of time × treatment were significant.
Group 2 with the uninterrupted primary infection had few worms on days 73 and 94 pi, but there was no significant difference in worm burdens (post hoc test, Mann–Whitney U test, z = − 1.59, P = not significant (NS)) between the 2 days (73 and 94), indicating that despite the numerical difference in values, most likely these animals were experiencing stable chronic low-level infection at this time.
Group 4, which had both the primary immunizing and challenge infections, but was cleared with anthelmintic on day 35 pi 4 weeks before challenge, had low worm burdens, significantly lower than Group 3, the challenge control group (for specific prediction that Group 4 had fewer worms than Group 3, confined to days 10 and 3 pc, z = 2.93, P = 0.0017). Therefore, these animals had expressed acquired resistance to infection arising from their experience of the immunizing infection. In contrast, there was no significant difference between Group 5 (superimposed challenge infection) and Group 3 (H = 1.39, P = NS). Clearly, Group 5 hamsters had the highest mean worm burdens relative to most of the other groups, and it is likely that in these animals most of the challenge infection established successfully, superimposing on the persisting worms from the primary immunizing infection, at least initially on day 10 pc. Nevertheless, there was no evidence of loss of worms from these animals between days 10 and 31 pc (for the correlation of worm burden on days after challenge R s = − 0.133, n = 20, P = NS).
Effects on villus height
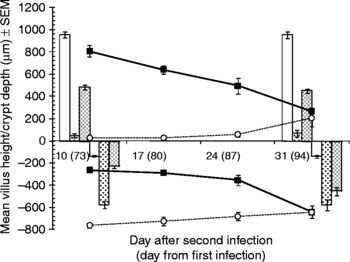
Villus height measurements are illustrated in fig. 1, and the statistical analysis is given in the legend. In naïve control hamsters (Group 1) there was no change in the height of villi between the two sampling points (fig. 1; days 73 and 94 from the start of the experiment), with values in the normal mid-range of uninfected animals (Alkazmi et al., Reference Alkazmi, Dehlawi and Behnke2006). Hamsters experiencing an uninterrupted primary infection (Group 2) had villi with drastically reduced height on both days, with values similar to those reported by Alkazmi and co-workers (Alkazmi et al., Reference Alkazmi, Dehlawi and Behnke2006; Alkazmi & Behnke, Reference Alkazmi and Behnke2010). On day 73 the reduction relative to the naïve controls was 94.9% and on day 94 it was 92.6%. The challenge control group (Group 3, given only the second/challenge infection) had villi about half the size of those in the naïve control group at both time points (reduction relative to naïve controls was 49.3% and 52.7%, respectively). Animals that were give the abbreviated primary infection and then challenged (Group 4) initially, 10 days pc, had villi only just below the height of those in the naïve control group, but then villus height was eroded from 1 week to the next (regression of villus height in Group 4 on days after challenge, Rp = 0.89, n = 20, β = − 25.3 ± 3.0, t = − 8.43, P < 0.001). In contrast, on day 10 pc animals given the superimposed challenge infection started with highly reduced villi, much like those of Group 2, but there was some indication of a recovery over the course of the challenge infection (regression of villus height in Group 5 on days after challenge, Rp = 0.59, n = 19, β = 7.94 ± 2.65, t = 2.99, P = 0.008), so that by day 31 pc (94 after the original primary) their villi were almost three times longer than those of Group 2 (203.3 ± 72.1 μm compared with 70.3 ± 30.8 μm, respectively), but still much reduced relative to naïve controls (955.3 ± 29.82 μm).
The height of villi (above the abscissa) and the depth of crypts of Lieberkühn (below the abscissa) recorded in the five treatment groups on day 10 and day 31 after the secondary infection (day 73 and day 94 of the experiment). Additional data are provided on day 17 and day 25 pc for Groups 4 and 5, which were exposed to the primary infection and then either had their worms removed, followed by challenge infection (Group 4 filled in squares and bold line graph) or had the challenge infection superimposed on the primary infection (Group 5, open circles and dotted line graph). Animals that remained naïve throughout are designated by open columns (Group 1), those given an uninterrupted primary infection by columns filled with stipples (Group 2), and the challenge control group by hatched columns (Group 3). Statistical analysis was confined to data for day 10 and day 31 pc, incorporating all five groups. For villus height this revealed a highly significant effect of treatment (F 4,38 = 207.7, P < 0.001) and a significant interaction between treatment and time (F 4,38 = 30.3, P < 0.001). There was also a significant effect of time (F 1,38 = 11.0, P < 0.001). Model R 2 = 95.3%. For crypt depth, the main effect of treatment gave F 4,38 = 120.7 (P < 0.001), main effect of time F 1,38 = 29.2 (P < 0.001) and the interaction between treatment and time F 4,38 = 26.0 (P < 0.001). Model R 2 = 92.9%.

Effects on the depth of the crypts of Lieberkühn
Figure 1 also shows the results of measurements of the depths of crypts in the mucosa. In naïve hamsters (Group 1) crypts were much as expected in the middle of the normal range (Alkazmi et al., Reference Alkazmi, Dehlawi and Behnke2006) on both days, and in animals with the uninterrupted primary infection they were over four times deeper (Group 2; 421.9% and 410.6% of control naïve values on days 73 and 94 after infection, respectively). In hamsters that had experienced an early stage primary infection (Group 3, challenge control group) crypt depth was 169.8% on day 10 and then increased to 323.6% of control naïve values by day 31 post primary infection (pi). Similarly, hamsters that had experienced the abbreviated primary infection and were then challenge (Group 4), showed crypt depth increasing from week to week after challenge as the experiment progressed (regression of crypt depth on days after challenge, confined to Group 4; R p = 0.84, n = 20, β = − 17.2 ± 2.62, t = − 6.58, P < 0.001). However, hamsters given the superimposed infection (Group 5) initially had very deep crypts, in fact greater than those of animals with the uninterrupted primary infection (Group 2), but then showed a slow but consistent reduction in depth (regression of crypt depth on days after challenge, confined to Group 5, R p = 0.54, n = 19, β = 5.85 ± 2.30, t = 2.55, P = 0.021), although by day 31 pc (day 94 of the experiment), crypt depth in these animals was still 455.9% of that in the naïve controls (Group 1).
Effects on the number of mitotic figures per crypt
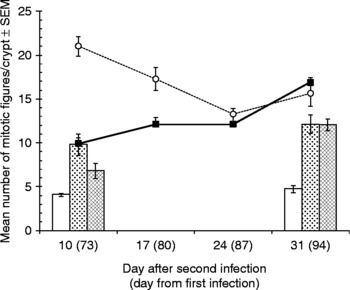
Values for mitotic figures in naïve hamsters (Group 1), with means of 4.1 and 4.8 on days 73 and 94 of the experiment, respectively, were much as expected from previous studies (Alkazmi et al., Reference Alkazmi, Dehlawi and Behnke2006; Alkazmi & Behnke, Reference Alkazmi and Behnke2010) (fig. 2). Group 2 hamsters, which had the uninterrupted primary infection showed markedly elevated values, more than twice those in Group 1, on both days, again much as expected. The challenge control group (Group 3) had intermediate numbers of mitotic figures on day 10 pi (day 73 of the experiment), but this increased substantially to a mean almost identical to that in Group 2 by day 31 pi (day 94 of the experiment). Hamsters in Group 4, had identical numbers of mitotic figures on day 10 pc to Group 2 animals, which had the uninterrupted primary infection, but the numbers then rose consistently with each day post-challenge (regression of number of mitotic figures on days after challenge, confined to Group 4; R p = 0.76, n = 20, β = 0.300 ± 0.058, t = 5.20, P < 0.001). In contrast, Group 5 hamsters (superimposed challenge infection) had grossly elevated levels on day 10 pc, and these declined with each day post-challenge (regression of number of mitotic figures on days after challenge, confined to Group 5; R p = − 0.63, n = 19, β = − 0.29 ± 0.087, t = − 3.35, P = 0.004).
The mean number of mitotic figures recorded in the five treatment groups on day 10 and day 31 after the secondary infection (day 73 and day 94 of the experiment). Additional data are provided on day 17 and day 25 pc for Groups 4 and 5 (abbreviated primary+challenge and superimposed challenge, respectively). Key to symbols used is as in fig. 1. Statistical analysis was confined to data for day 10 and day 31 pc, incorporating all five groups. This revealed a highly significant effect of treatment (F 4,38 = 65.9, P < 0.001), a weaker significant effect of time (F 1,38 = 11.7, P = 0.002) and a significant interaction between treatment and time (F 4,38 = 14.4, P < 0.001). Model R 2 = 87.4%.

Effects on the concentration of mast cells in the intestinal mucosa
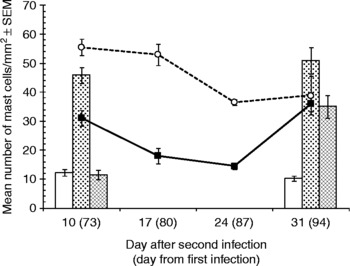
The number of mast cells in uninfected hamsters of the strain used here usually averages approximately 9-10/mm2 of intestinal mucosa (Alkazmi et al., Reference Alkazmi, Dehlawi and Behnke2006). The mean values in control uninfected hamsters (Group 1) were well within the upper part of the normal range (fig. 3; mean mast cell counts = 12.2 and 10.2 on days 73 and 94 of the experiment, respectively). The challenge control group (Group 3) had similar values just 10 days after primary infection (day 73 of the experiment) but then higher values 3 weeks later, as expected (Alkazmi et al., Reference Alkazmi, Dehlawi and Behnke2008). Hamsters that had experienced the uninterrupted primary infection (Group 2) had markedly elevated levels of mast cells, approximately four times more cells/mm2 of mucosal tissue on day 73 and five times as many on day 94 after primary infection. Group 4, the abbreviated primary infection–challenged hamsters, had elevated counts on day 10 pc, but lower than that of the animals with the uninterrupted primary infection, suggesting that this was in fact a response to the challenge, and then experienced a fall almost to control levels before showing a rise towards the end of the experiment 31 days pc. These data were best described by a quadratic equation (y = 85.1 − 7.1x+0.18x 2; goodness of fit F 1,17 = 24.2, P < 0.001, R 2 = 0.71). In contrast, the group receiving the superimposed challenge infection (Group 5) had high mast cell counts on day 10 pc, only a little higher than that of the hamsters with the uninterrupted primary infection (Group 2) (fig. 3), and their counts stayed steady for a week before falling a little by days 24 and 31 pc. This fall over time was significant (regression of mast cells/mm2 of mucosal tissue on days after challenge, confined to Group 5; R p = − 0.64, n = 18, β = − 0.925 ± 0.278, t = − 3.327, P = 0.004).
The mean number of mast cells recorded in the five treatment groups on day 10 and day 31 after the secondary infection (day 73 and day 94 of the experiment). Additional data are provided on day 17 and day 25 pc for Groups 4 and 5. Key to symbols used is as in fig. 1. Statistical analysis was confined to data for days 10 and 31 pc, incorporating all five groups. This revealed a highly significant effect of treatment (F 4,40 = 43.0, P < 0.001) and a significant interaction between treatment and time (F 4,40 = 9.0, P < 0.001), but no main effect of time (F 1,40 = 1.87, P = NS). Model R 2 = 80.4%.

Effects on the concentration of goblet cells in the intestinal mucosa
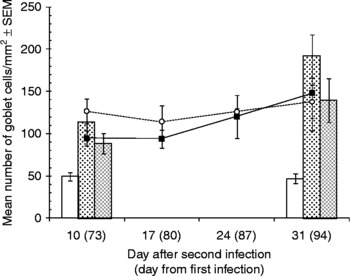
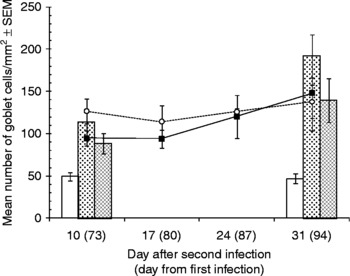
The strain of hamsters used in this work usually averages about 50–70 goblet cells/mm2 (Alkazmi et al., Reference Alkazmi, Dehlawi and Behnke2008). The values recorded for average counts in the naïve hamsters (Group 1; 49.4 on day 73 and 46.6 on day 94 of the experiment) fall just a little below the average, but within the normal range (Alkazmi et al., Reference Alkazmi, Dehlawi and Behnke2008) (fig. 4). In hamsters with an uninterrupted primary infection (Group 2), goblet cell numbers were 2.31 times higher on day 73 pi and 4.12 times higher on day 94 pi, the latter being the highest values recorded in the study. Group 3 hamsters, the challenge control group, had elevated counts on day 10 pc (day 73 of the experiment) and even higher counts on day 31 pc. There was little difference between Groups 4 and 5, both of which had received the immunizing infection and the challenge. Thus, irrespective of whether the worms persisting from the immunizing infection had been removed (Group 4) or not (Group 5), goblet cell counts were high on day 10 pc, and much like those of the challenge control group (Group 3). There was then a slight rise in values over the following 3 weeks, ending up with means much like those of the challenge control group on day 31 pc, but the change with time was not significant in either group (Group 4 R p = 0.37, n = 20, P = NS; Group 5, R p = 0.18, n = 17, P = NS).
The mean number of goblet cells recorded in the five treatment groups on day 10 and day 31 after the secondary infection (day 73 and day 94 of the experiment). Additional data are provided on day 17 and day 25 pc. for Groups 4 and 5. Key to symbols used is as in fig. 1. Statistical analysis was confined to data for days 10 and 31 pc, incorporating all five groups. This revealed significant effects of treatment (F 4,39 = 7.3, P < 0.001), time (F 1,39 = 8.3, P = 0.006) but no interaction between treatment and time (F 4,39 = 1.3, P = NS). Model R 2 = 41.3%.
Effects on the density of eosinophils in the intestinal mucosa
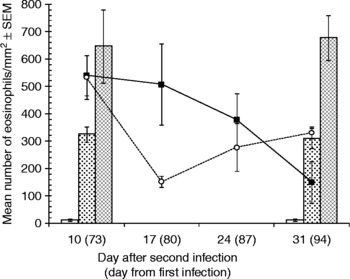
In naïve animals (Group 1) eosinophil counts were very low, averaging below 14 cells/mm2, so well within the normal range (Alkazmi et al., Reference Alkazmi, Dehlawi and Behnke2008), in contrast to all the infected animals, which had much higher counts (fig. 5). The response to infection in previously naïve animals was very rapid, as shown by the values from the challenge control group (Group 3), which by 10 days after infection had experienced a 52.6-fold increase in the concentration of these cells in the mucosa, and this was sustained for the next 3 weeks (fig. 5). Hamsters with the uninterrupted primary infection (Group 2) had values about half those of Group 3. Initially on day 10, both of the previously infected–challenged groups (Groups 4 and 5) had counts much like those of Group 3 and in both groups eosinophil counts then fell with time. In the hamsters that had experienced the abbreviated infection, this was a consistent, slow fall from week to week and a significant almost linear, change with time after challenge (Group 4, R p = − 0.57, n = 20, β = − 18.5 ± 6.36, t = − 2.92, P = 0.009). In Group 5, animals that had been given a superimposed challenge, the drop in eosinophil counts after day 10 pc was initially rapid but then the counts appeared to rise somewhat on days 24 and 31 pc. There was overlap in values between these days and this more likely represents a plateau rather than a secondary increase. In attempting to select a best-fit curve to describe the pattern of changes in Group 4, we could not distinguish between a quadratic equation indicating a rise in counts after day 31 and a cubic equation that peaked secondarily before day 31 and then dropped again after day 31.
The mean number of eosinophils recorded in the five treatment groups on day 10 and day 31 after the secondary infection (day 73 and day 94 of the experiment). Additional data are provided on day 17 and day 25 pc for Groups 4 and 5, which were exposed to both primary and secondary infections. Key to symbols used is as in fig. 1. Statistical analysis was confined to data for days 10 and 31 pc, incorporating all five groups. This revealed significant effects of treatment (F 4,40 = 24.3, P < 0.001), time (F 1,40 = 7.3 P = 0.01) and interaction between treatment and time (F 4,40 = 3.6, P = 0.014). Model R 2 = 69.2%.

Effects on the density of Paneth cells in the intestinal mucosa
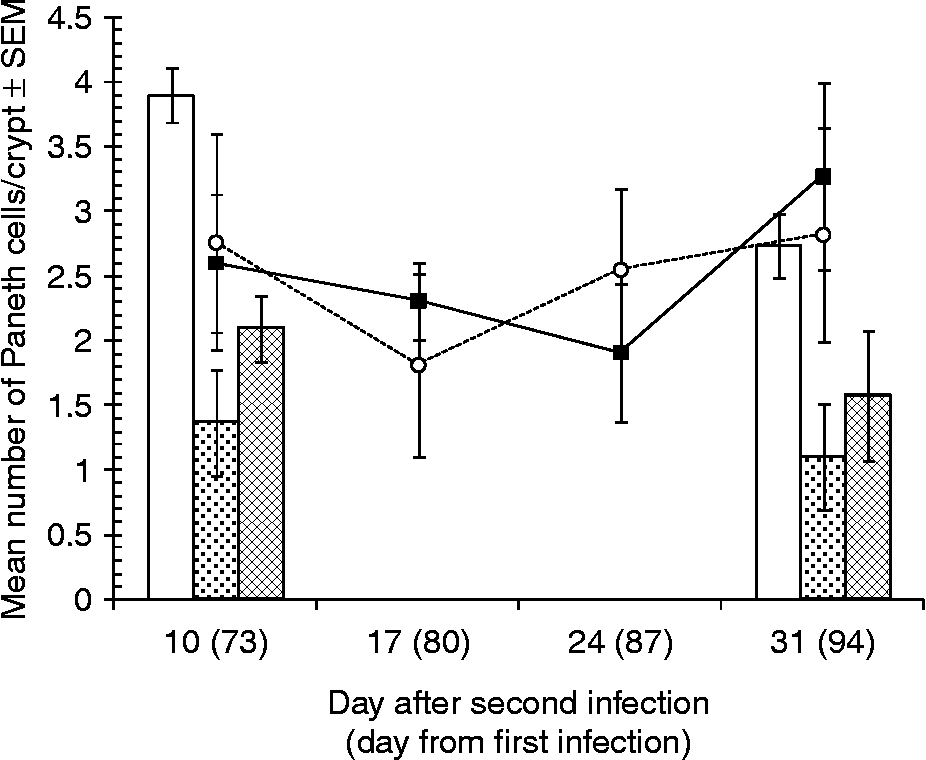
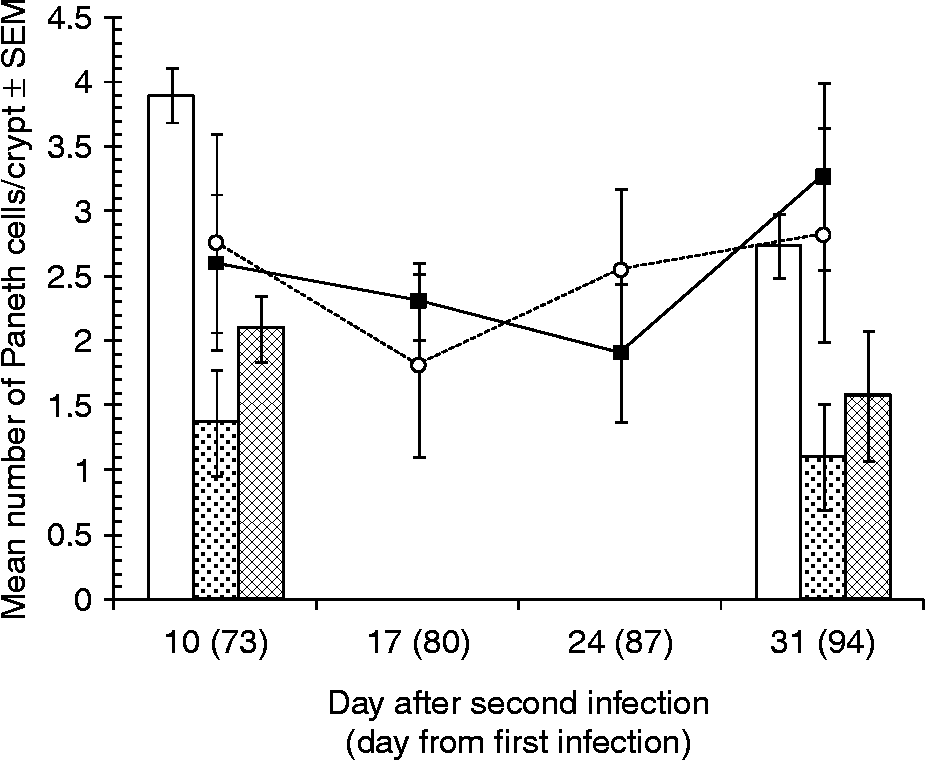
In naïve hamsters, Paneth cell numbers average 3–4 cells per crypt which is high and towards the top end of the values normally expected in naïve hamsters of our strain (Alkazmi et al., Reference Alkazmi, Dehlawi and Behnke2008). As in earlier studies, and in contrast to other cell types, Paneth cell counts fell after infection. The hamsters experiencing the uninterrupted infection (Group 2) had values about half those in the naïve group on both days 73 and 94 of the primary infection (fig. 6). In the challenge control group (Group 3) counts fell within 10 days of infection and also stayed low over the next 3 weeks. There was no difference between the pattern of change in counts observed in both groups subjected to the immunizing and challenge infections (Groups 4 and 5), irrespective of whether the primary immunizing infection had been cleared on day 35 or not, with counts overlapping on all days. In both groups (Groups 4 and 5) on day 10 pc Paneth cell counts were much like those in the challenge control group (Group 3), the mean values being about one-third lower than that of the naïve group (Group 1) but then dipped slightly and drifted slowly upwards back to control levels, even exceeding the values in naïve animals on day 31 pc. However, none of these time-related changes were significant, most likely because of the high level of variation within each experimental group.
The mean number of Paneth cells recorded in the five treatment groups on day 10 and day 31 after the secondary infection (day 73 and day 94 of the experiment). Additional data are provided on day 17 and day 25 pc for Groups 4 and 5, which were exposed to both primary and secondary infections. Key to symbols used is as in fig. 1. Statistical analysis was confined to data for days 10 and 31 pc, incorporating all five groups. This revealed a significant effect of treatment (F 4,39 = 5.3, P = 0.02), and no other significant effects. Model R 2 = 25.3%.
Since there was no significant effect of time after challenge, nor an interaction between time and treatment, we fitted a one-way GLM with treatment as the factor (main effect of treatment F 4,44 = 5.5, P = 0.001, model R 2 = 27.2%). Post hoc analysis by LSD indicated that Group 4 (abbreviated primary infection+challenge) had significantly higher values than Groups 2 and 3 (P = 0.002 and 0.04, respectively) but that Group 5 (superimposed challenge infection) only differed significantly from Group 2 (P = 0.005).
Discussion
The focus of this study was the mucosal response in hamsters originally receiving a low-dose immunizing infection, followed by a superimposed challenge infection. This particular combination has not been studied before in hamsters, although there is some relevant data from a smaller-scale experiment in dogs (Carroll & Grove, Reference Carroll and Grove1986). When hamsters are challenged after the removal of the immunizing infection, they become solidly resistant to challenge (Behnke et al., Reference Behnke, Guest and Rose1997; Alkazmi & Behnke, Reference Alkazmi and Behnke2010), and that was clearly observed in the current Group 4 animals but the hamsters given the superimposed challenge (Group 5) did not resist the challenge infection effectively. Although no similar experiment has been published in hamsters, Brailsford & Behnke (Reference Brailsford and Behnke1992) found that under trickle infection protocols with A. ceylanicum, only larvae from the first 1–2 doses survived to adulthood despite repeated subsequent challenge. Carroll & Grove (Reference Carroll and Grove1986) found that dogs originally immunized by a 4-week infection with A. ceylanicum, resisted rather than facilitated the establishment of a subsequent superimposed challenge infection. Therefore, neither of these two studies is in accordance with our findings. Nevertheless, our result is interesting in that it is consistent with the idea that this parasite is able to immunomodulate in particular circumstances, the presence of adult worms enabling better survival of subsequent incoming larvae, rather than enhancing resistance (Behnke et al., Reference Behnke, Hannah and Pritchard1983).
As in earlier studies (Behnke et al., Reference Behnke, Rose and Little1994; Alkazmi et al., Reference Alkazmi, Dehlawi and Behnke2006, Reference Alkazmi, Dehlawi and Behnke2008; Alkazmi & Behnke, Reference Alkazmi and Behnke2010), the tremendous resilience of some adult worms was evident in their survival, albeit in small numbers, right through to day 94 of the primary infection, despite the highly abnormal, inflamed intestinal environment. Equally of note, none of the animals in this study, but especially those in Groups 2 and 5, appeared to suffer overt disease, and all fed normally and survived the 3-month duration of this experiment. Interestingly, the typical helminth-generated Th2-driven intestinal inflammatory responses lasted for as long as the worms were present in the gut, and not just for a few days as in rodent models where worms are expelled within 3–4 weeks of infection and after which intestinal changes return rapidly to normal. We have drawn attention previously to the similarities with chronic intestinal conditions with underlying immunological causes, such as coeliac and Crohn's disease (Alkazmi et al., Reference Alkazmi, Dehlawi and Behnke2006).
The intestinal response is dependent on the presence of the worms, because when the worms are removed by anthelmintics most of the indicators of inflammation return to baseline values within 2–3 weeks (Alkazmi et al., Reference Alkazmi, Dehlawi and Behnke2006, Reference Alkazmi, Dehlawi and Behnke2008; Alkazmi & Behnke, Reference Alkazmi and Behnke2010). The only exception are Paneth cell counts which, in contrast to other cell types, fall in number after hookworm infections in hamsters and rebound to levels that are higher than in naïve animals after effective anthelmintic treatment (Alkazmi et al., Reference Alkazmi, Dehlawi and Behnke2008; Alkazmi & Behnke, Reference Alkazmi and Behnke2010). Such elevated levels can then last for over 8 weeks (Alkazmi & Behnke, Reference Alkazmi and Behnke2010). Not surprisingly, therefore, Paneth cell numbers in the current work were low in the chronically infected animals (Group 2) and fell appreciably within 10 days of primary infection (Group 3). Paneth cells contain many active molecules with important roles in protection against bacterial attack of the intestinal mucosa (Elphick & Mahida, Reference Elphick and Mahida2005), and the drop in their counts after infection with A. ceylanicum contrasts with the general findings from other helminth–rodent model systems where, soon after infection, these cells increase in the mucosa (Kamal et al., Reference Kamal, Wakelin, Ouellette, Smith, Podolsky and Mahida2001, Reference Kamal, Dehlawi, Rosa Brunet and Wakelin2002; Schopf et al., Reference Schopf, Hoffman, Cheever, Urban and Wynn2002). However, Alkazmi et al. (Reference Alkazmi, Dehlawi and Behnke2008) suggested that the fall in hookworm-infected hamsters may be a consequence of immunomodulation by the adult worms (see also Geiger et al., Reference Geiger, Massara, Bethony, Soboslay and Correa-Oliveira2004; Quinnell et al., Reference Quinnell, Pritchard, Raiko, Brown and Shaw2004) favouring their long-term survival, a strategy that would make sense if the contents of these cells were toxic to the worms. Here, Paneth cell numbers in Groups 4 and 5 were indistinguishable, initially marginally lower, but later on very similar to those in naïve animals, although significantly higher than in hamsters with the persisting low-grade infection (Group 2). Therefore, irrespective of whether the challenge infection had been resisted (Group 4) or not (Group 5), challenged hamsters sustained relatively high mucosal Paneth cell concentrations, with a suggestion of a rise towards the end of the experiment (Alkazmi & Behnke, Reference Alkazmi and Behnke2010). It is pertinent that the incoming challenge larvae in Group 4 would have been faced with high Paneth cell densities in the crypts, because of the rebound effect following anthelmintic treatment, and these may well have contributed towards the failure of most larvae to establish. In Group 5, the challenge infection larvae would have been faced with low Paneth cell numbers, possibly insufficient to prevent their establishment. If this is the critical difference between these groups underlying their contrasting worm burdens, it must reflect rapid mucosal events immediately after challenge and, indeed, it is known that acquired host-protective immunity in hamsters operates primarily at incoming larvae at the late L3 and early L4 stages (Behnke et al., Reference Behnke, Guest and Rose1997). The current experiment missed these early events and hence further exploration of Paneth cell dynamics in the days immediately after challenge is required to clarify the temporal and quantitative relationship between these cells and resistance to larval hookworm invasion.
Villus height in Group 4 on day 10 pc was just a little lower than in naïve control hamsters, indicating that the former had been successfully cleared of worms and had recovered. In contrast, in animals with superimposed infections (Group 5) they were drastically reduced because of the continual presence of adult worms. However, with time after challenge values in both groups drifted towards each other, with evidence of some recovery in villus height in Group 5, but a marked fall in villus height with each successive day pc in Group 4. Since the latter had few adult worms at autopsy, this loss of villus height must have been driven primarily by the host response rather than by the feeding of worms. The accompanying changes in the crypts and in villus mitotic activity, although in opposite directions in Group 4 (no adult worms) and Group 5 (adult worms present) are consistent with this interpretation.
Despite the difference in survival of challenge infection worms in Groups 4 and 5, other parameters of the mucosal responses were remarkably similar in most respects. There was no difference in goblet cell counts and these did not change significantly over time post-challenge, although values in Group 4 suggested that they had started from a lower baseline, as expected (Alkazmi & Behnke, Reference Alkazmi and Behnke2010). In both groups, given the erosion of mucosal tissue, after challenge goblet cell counts probably represented a maximum possible infiltration of the mucosa. Again, eosinophil responses in both groups were huge in relation to baseline values in naïve animals, and mostly very similar, clearly indicating a dramatic rise by day 10 pc (since eosinophil numbers in anthelmitic-treated animals drop almost to base levels within 4 weeks of treatment; Alkazmi & Behnke, Reference Alkazmi and Behnke2010) and then a gradual and consistent fall in Group 4, but a more complex downward trend in Group 5. Thus, both groups, irrespective of whether they harboured a persistent infection or not, whether they resisted challenge or not, experienced an initial surge of eosinophil infiltration into the mucosa followed by a fall, suggesting that surges in eosinophil infiltration are primarily stimulated by fresh larvae but sustained by the presence of adult worms, albeit at a lower level.
The events that occur in the mucosa during both primary and secondary infections with the hookworm A. ceylanicum in the hamster model-system are still incompletely understood, and their relevance to hookworm infections in dogs and humans is still far from clear (Behnke, Reference Behnke1987). Nevertheless, this system is already being used to assess candidate antigens for a vaccine against hookworms and, hopefully, our results will help to inform those studies (Bungiro et al., Reference Bungiro, Greene, Kruglov and Capello2001; Mendez et al., Reference Mendez, Valenzuela, Wu and Hotez2005a; Ghosh et al., Reference Ghosh, Wu, Antione, Bottazzi, Valenzuela, Hotez and Mendez2006). In particular, we have raised a number of interesting questions about the potential role of Paneth cells in enabling hamsters to resist challenge infections, and these will be addressed in subsequent studies.
Acknowledgements
We thank the Ministry of High Education of the Kingdom of Saudi Arabia for the provision of a postgraduate studentship for LMMA. We are also grateful to Dr Catherine Lawrence and Professor P. Garside for training provided for LMMA in the initial stages of this project.