1. Introduction
Rapid population ageing has become a major concern of policymakers on the sustainability of pension schemes. It is also expected to have detrimental effects on the aggregate consumption and economic growth of a country. Specifically, final consumption accounts for the largest component of GDP with a global average of around 60% (OECD, 2021). Much research in recent years has focused on changes in consumption patterns of the elderly to evaluate whether their savings are sufficient to finance consumption throughout retirement, as well as its implications for other well-being dimensions. Assuming forward-looking expectations, the Modigliani and Brumberg (Reference Modigliani, Brumberg and Kurihara1954) life-cycle hypothesis (LCH) predicts that individuals' and households' consumption should be smoothed over the lifetime. They will use savings during the working years to maintain their consumption after retirement. Thus, it should not exhibit the systematic decline in household spending around retirement since it is an expected event, except that unanticipated negative shocks such as health problems and job loss have occurred at that time.
However, empirical evidence seems to contradict the standard life-cycle model that the average consumption declines significantly at the time of household head's retirement. This finding is referred to as the “retirement-consumption puzzle” [Hamermesh (Reference Hamermesh1984), Banks et al. (Reference Banks, Blundell and Tanner1998), Bernheim et al. (Reference Bernheim, Skinner and Weinberg2001), Haider and Stephens (Reference Haider and Stephens2007)]. Therefore, it points to the likelihood that a high proportion of elderly households are confronted with the problem of financial insecurity as they retire from work. Additionally, a number of studies have found heterogeneity in the consumption changes across socioeconomic groups [Battistin et al. (Reference Battistin, Brugiavini, Rettore and Weber2009), Hurd and Rohwedder (Reference Hurd and Rohwedder2013), Hori and Murata (Reference Hori and Murata2019)]. It is commonly observed that the magnitudes of the consumption decline are larger for households with low-income and low assets. Furthermore, unexpected shocks like job loss and illness can potentially give rise to a substantial drop in consumption for those approaching retirement [Smith (Reference Smith2006), Barrett and Brzozowski (Reference Barrett and Brzozowski2012), Hurd and Rohwedder (Reference Hurd and Rohwedder2013)].Footnote 1
In a widely cited paper, Aguiar and Hurst (Reference Aguiar and Hurst2005) argue that the decline in consumption expenditure around retirement is often accompanied by the sharp increases in time spent on home production activities (shopping, preparing meals, cleaning the house, etc.) since the opportunity cost of time falls when individuals retire from paid employment. After taking into account the market value of home-produced goods, the actual consumption may remain stable or fall slightly at retirement. Furthermore, the declines in household expenditure around retirement are mainly concentrated on food and work-related expenses such as clothing, personal services, and transportation [Aguiar and Hurst (Reference Aguiar and Hurst2005, Reference Aguiar and Hurst2013), Hurst (Reference Hurst2008)]. Hence, the observed decline in consumption spending may not simply indicate inadequate retirement savings. Studies for different countries have also established that retirement leads to the increased time spent on various home production activities [Stancanelli and Van Soeast (Reference Stancanelli and Van Soeast2012), Luengo-Prado and Sevilla (Reference Luengo-Prado and Sevilla2013), Li et al. (Reference Li, Shi and Wu2016), Been et al. (Reference Been, Rohwedder and Hurd2021)].Footnote 2
A growing body of literature has investigated changes in spending patterns among elderly households in East Asian countries, which have experienced the increased proportion of elderly in their total population. Examples of such empirical studies include Wakabayashi (Reference Wakabayashi2008), Stephens and Unayama (Reference Stephens and Unayama2012), and Hori and Murata (Reference Hori and Murata2019) for Japan; Cho (Reference Cho2012) for South Korea; Agrawal et al. (Reference Agarwal, Pan and Qian2015) for Singapore; and Li et al. (Reference Li, Shi and Wu2016) and Dong and Yang (Reference Dong and Yang2017) for China. Overall, the main findings of these studies are inclined to the Aguiar and Hurst (Reference Aguiar and Hurst2005, Reference Aguiar and Hurst2013) analysis, demonstrating that a significant fall in consumption at retirement is likely as a result of the increased time spent on home production activities. However, the magnitudes of decline in consumption expenditures vary across households and across expenditure categories. Additionally, changes in household compositions and unforeseen negative shocks arriving around retirement help explain the substantial drops in consumption spending.
Extensive research has been concentrated on the U.S. and European countries with mature pension systems, as well as high-income East Asian countries. However, little evidence is available for low- and middle-income Asian countries experiencing an accelerated demographic transition. Thailand is a particularly interesting country to look at consumption and home production around retirement for two important reasons. First, Thailand has been undergoing a high level of ageing, together with moderate income and savings.Footnote 3 Specifically, Thailand is an upper-middle-income country with a GDP per capita of 7,189 USD in 2020, and the percentage of people aged 60 or more in recent years are almost 20% in its national population [World Bank (2021)]. Second, although the coverage of workers under Thailand's pension systems has been on a rise, post-retirement pension income is relatively low in comparison with that of other developing Asian countries. More specifically, Thailand's gross replacement rate of pension benefits to lifetime average earnings is 38%, which is the lowest compared to those for other Southeast Asian countries ranging from 53% to 75% [OECD (2018)]. In addition, the Thai government has spent somewhat less on public pensions (1.8% of GDP in 2019) than Asian neighboring countries with similar population ageing patterns [ILO (2021)].
Thailand's pension system is comparable to other East Asian and Pacific countries [World bank (2016)]. It has four major pension schemes administered by the government consisting of (1) civil service pensions, (2) contributory social security pensions for formal private-sector employees, (3) National Saving Fund (NSF)−a voluntary retirement saving fund for informal and self-employed workers, and (4) noncontributory or social pensions, known as the Old Age Allowance (OAA) scheme for all Thai people aged 60 and over not receiving the civil service pensions. About half of the Thai labor force are currently covered by the first three schemes, whereas the other half received only a pension from the OAA program that the monthly allowance ranges from 600 baht and 1,000 baht (equivalent to 18–30 USD). It is worthwhile to note that the minimum benefit of 600 baht is disproportionately low compared to the national average monthly wages (14,300 baht in 2019). This suggests that the welfare of Thai elderly is likely affected by a sharp decline in labor income after retirement, particularly for those without adequate savings or family support.
In Thailand, the mandatory retirement age is 60 for public sector employees, while it has not been established for those in the private sectors. Nevertheless, there was a major reform to the Labor Protection Act of Thailand in 2017 potentially affecting retirement decisions in that a deemed retirement age of any employee in a country is set at 60 years of age. In effect, employees are not required to retire at this age, but it provides the option to retire with eligibility for the statutory severance, which could be up to 10 months' salary as a lump sum depending on the uninterrupted working period. Consequently, it is expected to observe the significant increase in retirement for private formal workers at age 60 as well. This paper employs a regression discontinuity approach by exploiting the default retirement age of 60 as a threshold to estimate the casual effects of retirement on household consumption and home production in Thailand. To the best of the author's knowledge, this paper is the first attempt to rigorously investigate changes in consumption expenditure and time spent on nonmarket work among retired households in Thailand. The empirical evidence in this paper contributes to the literature on the retirement-consumption puzzle and the extent to which the decline in household spending is offset by home production for a particular developing country in the context of an immature pension system.
Using data drawn from four cross-sectional household Socio-Economic Surveys (SES) between 2013 and 2019, and the 2015 Time Use Survey (TUS), the results reveal that total household expenditure declines by 11% when the male head retires. It appears that the dramatic decline in consumption is more pronounced on work-related and non-durable entertainment categories, while the decrease in expenditure on food consumed at home is restricted to low-income or asset families. Further explorations show that the amount of time spent on home production increases by 8.4 h per week after one's retirement. On balance, the results lend support to the substitution between home-produced goods and market goods for retired households. However, there is still an indication of the retirement-consumption puzzle in Thailand, but the percentage decline in consumption appears to be smaller (6%) after accounting for the retirement impact on home production.
The rest of this paper proceeds as follows. Section 2 presents a methodological framework used to evaluate the impact of retirement on household spending patterns and home production. Section 3 describes the data, samples, and key variables used in the analyses. Section 4 presents estimation results and robustness checks of the results. The final section concludes the paper with important policy implications.
2. Methodology
2.1 Conceptual framework
Empirical evidence of the retirement-consumption puzzle raises doubt to the standard LCH of consumption stating that households save their income while working in order to smooth consumption in response to an anticipated income decline at retirement. The extended version of the LCH including the effects of liquidity constraints and uncertainty helps explain the substantial consumption drop around retirement. However, the analysis still focuses on the consumption of market goods since the LCH assumes that consumption and leisure are separable in utility, which implies a constant marginal utility of wealth. If preferences are non-separable and consumption and leisure are substitutes, the marginal utility of wealth will fall as leisure time increases with retirement. This potentially results in the significant decline in consumption expenditures [Banks et al. (Reference Banks, Blundell and Tanner1998), Hurd and Rohwedder (Reference Hurd and Rohwedder2013)].
To empirically investigate the effect of retirement on changes in household consumption patterns in Thailand, this paper follows the life-cycle model augmented with home production. The formal model of consumption and time allocation was initially developed by Becker (Reference Becker1965). A representative household acts as both a consumer and a producer and is assumed to combine market expenditures and time to produce consumption commodities to maximize utility subject to relevant constraints. The key implication of the model is that the decrease in the opportunity cost of time upon retirement may induce retired households to engage more in-home production previously purchased. Therefore, the inclusion of consumption, production and time allocation enables one to better examine consumer behavior of the elderly in which they will become the largest population group in the near future.
2.2 Empirical analysis
In an attempt to identify the causal impact of retirement on household consumption and income around retirement, the following specifications, which is extensively used in the literature [e.g., Cho (Reference Cho2012), Hori and Murata (Reference Hori and Murata2019), Been et al. (Reference Been, Rohwedder and Hurd2021)], are estimated:


where C it denotes the different measures of consumption expenditures of household i in year t, and Y it stands for household i's income in year t. The key explanatory variable R it is a dummy variable for the retirement of the male household head, equal to one if retired and zero otherwise.Footnote 4 The vector Zit controls for a head of household and household characteristics, including household size, the household head's years of education, gender and age, and dummy variables for regions and urban and rural areas, and the error terms εc and εy are assumed to be normally distributed with zero mean and finite variance.
The coefficients β c and β y measure the impacts of retirement on household consumption and income, respectively. One would expect a negative sign of β y coefficient resulting from a sharp decline in household income as the head retires from paid work. Furthermore, the LCH predicts that β c should not be significantly different from zero. In contrast, if the β c coefficient is substantial and negative, it provides supportive evidence of the retirement-consumption puzzle. As described in Hurst (Reference Hurst2008), the sign and magnitude of β c may vary across the consumption outcomes, and the large decline in consumption expenditures upon retirement are generally concentrated on work-related and food categories. To explore these possibilities, five expenditure categories are separately examined: (1) total expenditure; (2) food-at-home; (3) work-related expenses (on transportation and communication, clothing, and food consumed away from home); (4) non-durable entertainment; and (5) other remaining expenses. An additional set of regression analyses is also conducted for the subsample to investigate differences in expenditure changes across socioeconomic groups.
To assess whether and the extent to which retirement leads to changes in time devoted to home production among retirees, the resulting regression model is

where T it is the individual's amount of time spent on a specific home production activity such as food preparation, house cleaning, and shopping, and εt is the error term. One would expect to obtain a positive sign of β t, which reflects the increased hours spent on home production after retirement due to a decrease in the opportunity cost of time. However, it should be noted that the impact of retirement on time use patterns may differ across activity types and genders.
One important estimation issue is that the ordinary least squares (OLS) estimates of Equations (1) to (3) may suffer from endogeneity bias because the retirement status is not exogenous, which is often correlated with the error terms. To obtain consistent estimates of the impact of retirement on consumption and time use patterns, an instrumental variable (IV) approach is applied using the Thai legislation that the mandatory retirement age for public sectors and the minimum retirement age for private sectors with eligibility for the severance pay are set at the age of 60. Following recent literature, this paper uses a dummy variable indicating whether the household head's age is 60 or over as an instrumental variable (IV) for the retirement status of the male household head [Battistin et al. (Reference Battistin, Brugiavini, Rettore and Weber2009), Moreau and Stancanelli (Reference Moreau and Stancanelli2015), Li et al. (Reference Li, Shi and Wu2016), Been et al. (Reference Been, Rohwedder and Hurd2021)]. In this specification, it does not require that all individuals are retired at age 60; indeed, they may retire before or after age 60. However, it is expected that the probability of being retired increases significantly at the threshold age of 60 with a value between 0 and 1.
To address the potential endogeneity problem, the two-stage least squares (2SLS) method is employed to estimate the casual impact of retirement on household consumption and home production. The first-stage equation using a probit model is given by

and the second-stage equation is

where s it is the male head's age of household i at year t, f(s it − 60) is a polynomial function of order p in age, f(s it − 60) = (s it − 60) + (s it − 60)2 + … (s it − 60)p to make the functional form more flexible, D it is the dummy variable indicating the household head's age is 60 or over in year t, and $\hat{R}_{it}$ is the predicted probability of the household's head retirement.Footnote 5 Subsequently, the above estimation procedure is repeated to examine the effect of retirement on home production in that the dependent variable of Equation (5) is replaced by the amount of time allocated to home production (T it).
Turning to the parameters of interest, the expected percentage change in spending for a particular category at retirement can be computed from $e^{\beta _c}-1$ , and the additional time spent on home production is β t. More precisely, the IV estimates of β c and β t represent the local average treatment effects (LATE) of retirement on changes in consumption expenditure and time spent on home production for the compliers, defined as individuals who are already retired if their age reaches 60 and those are not retired if their age is less than 60. This estimation strategy is equivalent to fuzzy regression discontinuity design (FRD) in which the FRD estimator can be specified as:

where $\mathop {\lim }\limits_{\varepsilon \to 0} E[ {R_i\vert s_i = 60 + \varepsilon } ] -\mathop {\lim }\limits_{\varepsilon \to 0} E[ {R_i\vert s_i = 60-\varepsilon } ] \ne 0$ and O i is the outcomes of interest including consumption expenditure, household income, and time spent on home production.Footnote 6
However, it is worth mentioning the key assumption for the validity of the regression discontinuity model that the mean value of consumption conditional on the household head's age is continuous at the age threshold of 60. In other words. no other confounding factors can trigger a discontinuity in household consumption, except for one's retirement status. To test for the validity of this assumption, regression analysis is implemented where the dependent variable is each predetermined characteristic, including household size and the household head's years of schooling, and the explanatory variables consist of the retirement status and controlled household characteristics [see Battistin et al. (Reference Battistin, Brugiavini, Rettore and Weber2009), Li et al. (Reference Li, Shi and Wu2016)]. The insignificance of the retirement coefficient indicates that the regression discontinuity design (RDD) continuity assumption is satisfied. Further, the McCrary (Reference McCrary2008) manipulation test for the running variable is performed to ensure the robustness of the testing results, as done in Stancanelli (Reference Stancanelli2017). The idea is that the density of the household head's age should be continuous around age 60 if there is no manipulation, providing evidence in favor of the RDD continuity assumption. Another concern is that the running variable used in this paper – household head's age in years – is discrete, so the appropriate polynomial function of s it is added to the retirement equation in order to obtain consistent estimates of the LATE. See Dong (Reference Dong2015) and Dong and Yang (Reference Dong and Yang2017) for further details. Finally, heteroscedasticity-robust standard errors of all estimates will be used for hypothesis testing throughout the paper.
3. Data and summary statistics
3.1 Data
Two data sets are used in this paper: Socio-Economic Survey (SES) and TUS. The two surveys are nationally representative and cover all provinces in Thailand, both conducted by National Statistical Office (NSO). The analysis of changes in household consumption and income around retirement relies upon the SES data gathered in 2013, 2015, 2017, and 2019. The SES is a large cross-sectional survey, which provides detailed information on income, expenditures, household composition, and geographical and socioeconomic characteristics. In addition, the SES provides information on household assets and debt, debt payment, migration, and private transfers. The survey data were also collected at the individual level, including the level of education, occupation, employment status, wage income, age, and gender. A stratified two-stage sampling procedure was implemented for the SES: the primary sampling unit was blocked for municipal areas and villages for non-municipal areas, then private households were selected within these blocks and villages. There were roughly 40,000 sampled households in each survey.
For the sake of investigating household expenditure patterns around retirement, this paper focuses on a subset of male-headed households aged 50–70 in each survey year. The final sample includes 51,518 households for four cross-sections of the SES (n = 11,926 in 2013; 12,659 in 2015; 13,063 in 2017; and 13,870 in 2019). It should be noted that the SES collects age in years, not the year of birth; thus, it is potentially affected by recall error since the age is likely to round to the nearest integer at the time of the survey.Footnote 7 Based on individuals' current working status question, retirement status is defined as the male head reported himself at the interview date as being retired or economically inactive for a number of reasons like illness, disability, not willing to work, or elderly.
Household expenditures consist of spending on food, non-food items, durables, and services, with comprehensive details for each category. A face-to-face interview was conducted with the household head or member of the household at the respondent's premises using retrospective questions to gather information on household consumption and expenditure with three different recall periods: the previous week (e.g., food items and beverages), the previous month (e.g., residential rent, clothing, and transportation), and during the past 12 months (e.g., educational expenses, vehicle repair and maintenance costs, which are purchased less often during the year). The average response rate was 74.8% at the national level. In this paper, five household expenditure categories are analyzed: total expenditure, food consumed at-home, work-related costs, non-durable entertainment, and others.Footnote 8 Expenditures on food-at-home include food purchased and received-in kind (but excluding alcoholic beverages and tobacco products). Expenditures on work-related items include food consumed away from home, clothing and personal services, and transportation and communication (not including vehicle purchases). Non-durable entertainment expenditures comprise of vacations, outdoor activities, games, sport equipment, and other recreation and religious activities. Other remaining refer to expenditures on items not already accounted for in the above. All reported income and expenditure data are calculated on the monthly basis and adjusted to constant 2019 prices using the consumer price index (CPI) from Thailand's Ministry of Commerce.
Echoing recent studies, not only do retirees have more leisure time to engage in home production like cooking or cleaning, but they can also purchase most goods and services less costly by spending more their leisure time on searching and shopping to find good bargains. Therefore, the observed decline in household expenditures after retirement might not necessarily imply lower living standards. This paper also uses the 2015 TUS of Thailand to ascertain whether the casual relationship between individuals' retirement status and time spent on home production activities. Stratified three-stage sampling was used for the TUS in that Bangkok and other provinces are strata. Each stratum except for Bangkok is divided into two administrative areas: municipal (urban) and non-municipal (rural). The primary sampling unit was an enumeration area (EA); the secondary sampling unit was private households within the EA; and the tertiary sampling unit was an individual aged 6 years and over from each sampled household, which was selected through simple random sampling. The initial sample consisted of 83,880 individuals from different households.
The analysis here restricts to the sampled individuals aged 50–70 (also age in years), thus yielding a sample of 23,432 individuals (28%): 10,402 males and 13,030 females. Respondents' retirement status is defined as similar to that in the SES since the respondents from the two surveys were asked the same question on their employment status. From July 2014 to June 2015, personal interview and self-completed questionnaire were conducted to collect information on how the respondents spent their time doing different activities in every 10 min of a 24-h day. The overall response rate was exceptionally high for the TUS survey (93.8%). However, a further point worth noting is that the TUS provides rather limited information on household demographical and socioeconomic characteristics, as compared to the SES data.
The classification of activities for the TUS of Thailand is primarily based on the United Nations Statistics Division (UNSD). There are eight major divisions of activities: (1) paid work, (2) unpaid domestic services, (3) unpaid caregiving services to household members, (4) community services, (5) learning, socializing, (6) community participation and religious activities, (7) leisure and sports, and (8) personal care and maintenance. The amount of time spent on the above-mentioned activities is measured by minutes per day. Following recent literature examining the retirement effect on home production [e.g., Stancanelli and Van Soeast (Reference Stancanelli and Van Soeast2012), Atalay et al. (Reference Atalay, Barrett and Staneva2020), Been et al. (Reference Been, Rohwedder and Hurd2021)], activities are grouped into the following categories:
(1) Food management (preparing and serving meals, cleaning up afterwards, and other related activities)
(2) Cleaning of dwelling and surroundings
(3) Maintenance and small repairs and care of textiles (washing, drying, ironing)
(4) Shopping
3.2 Summary statistics of the sample
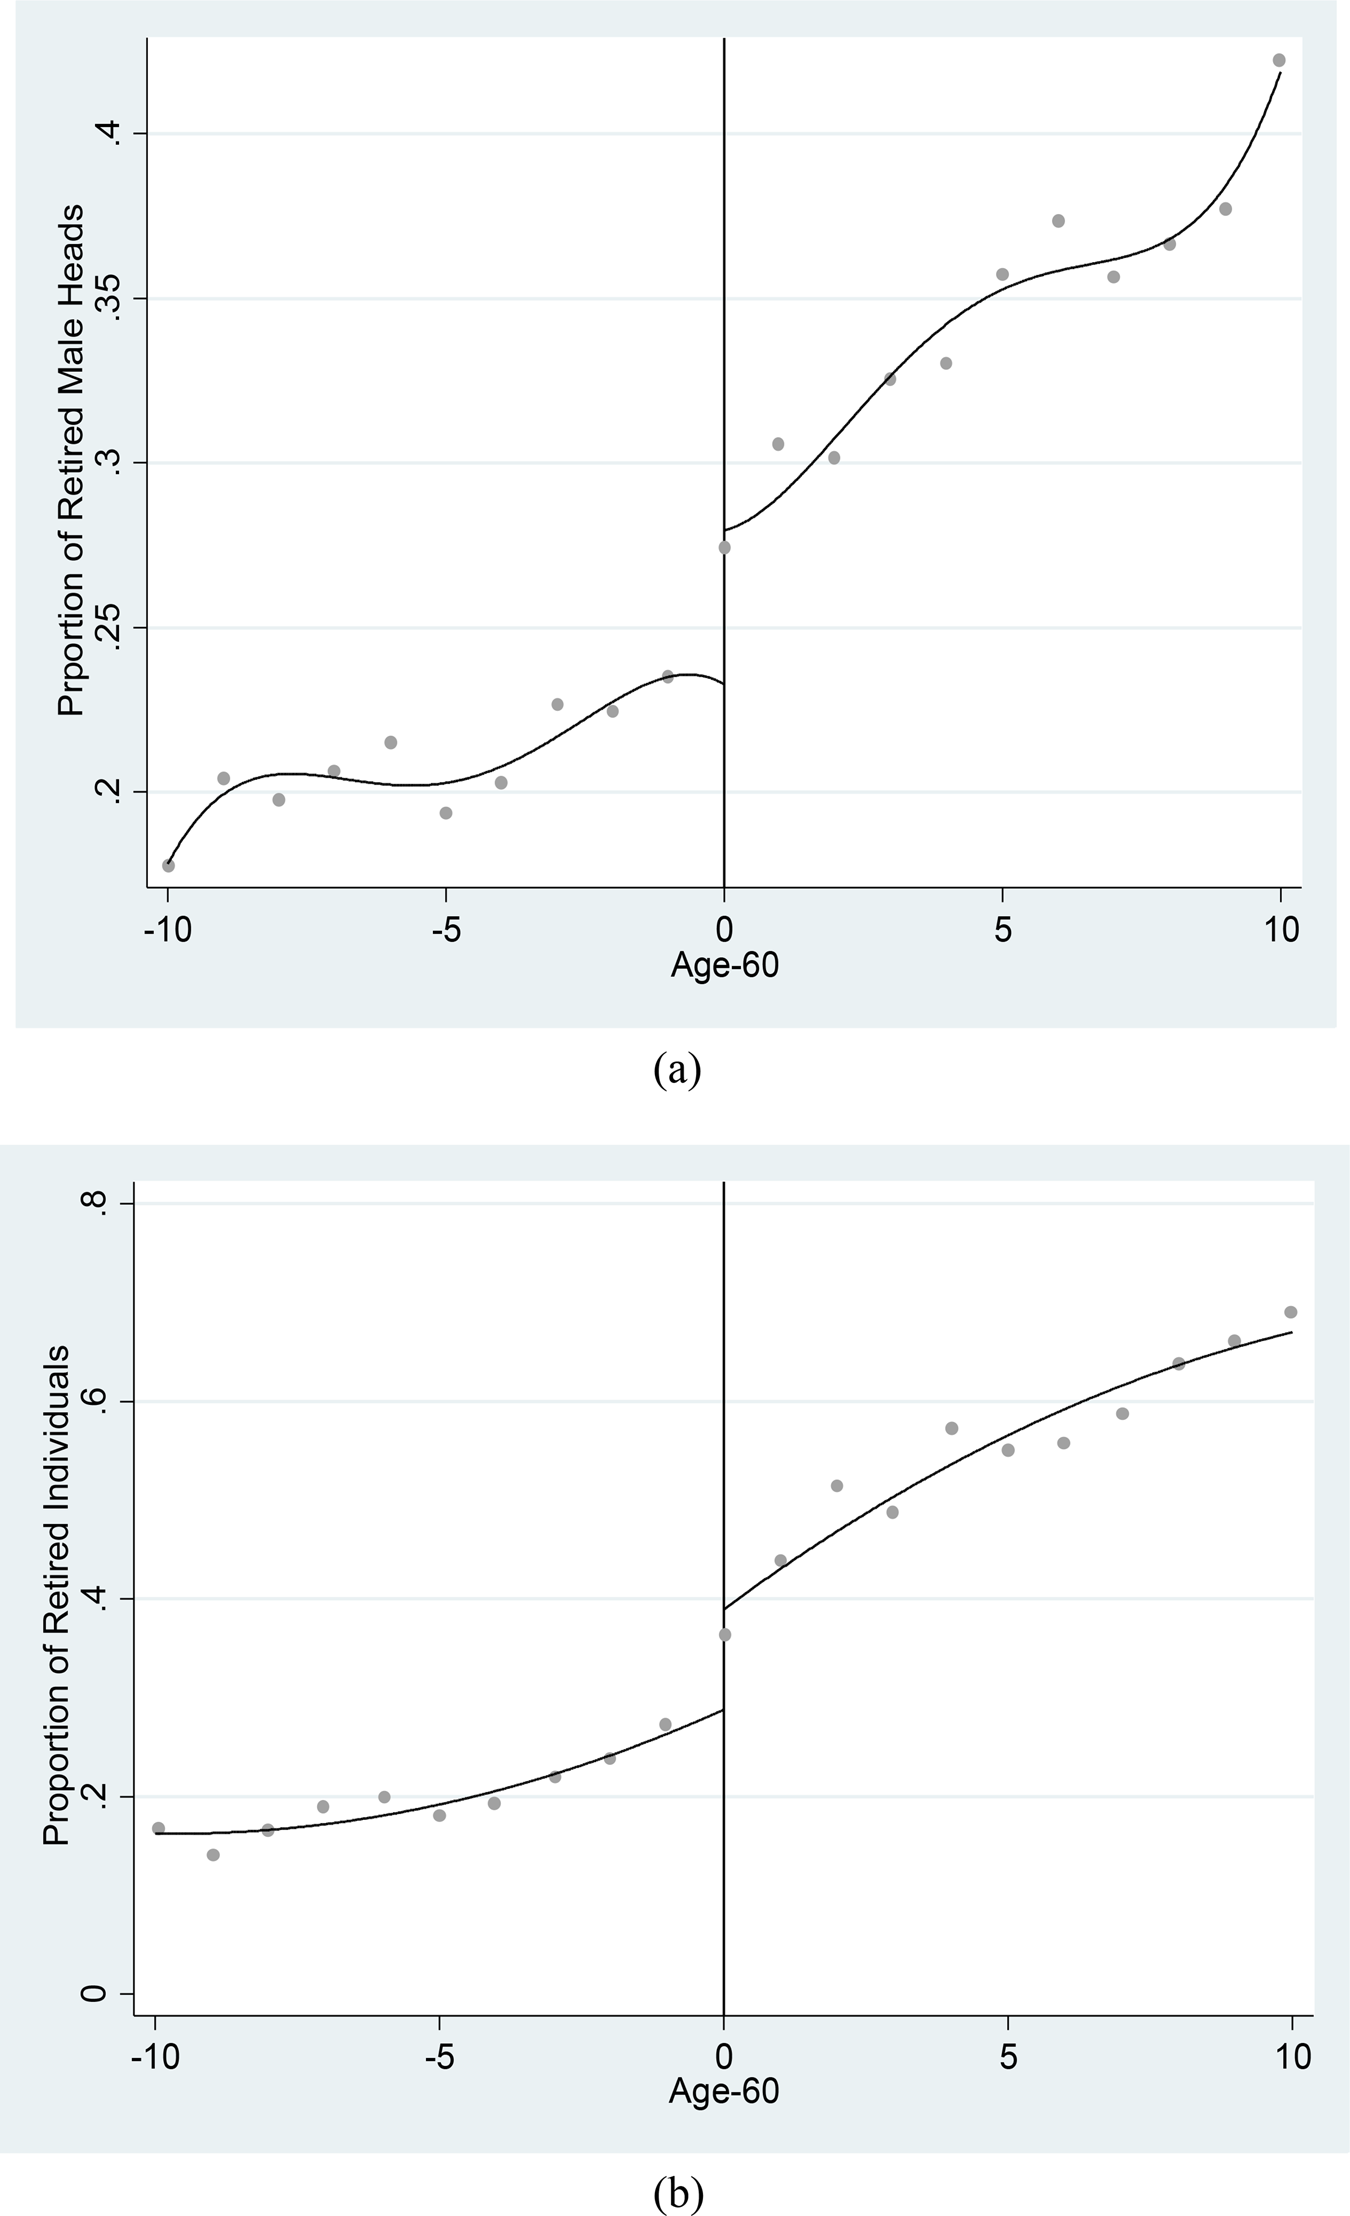
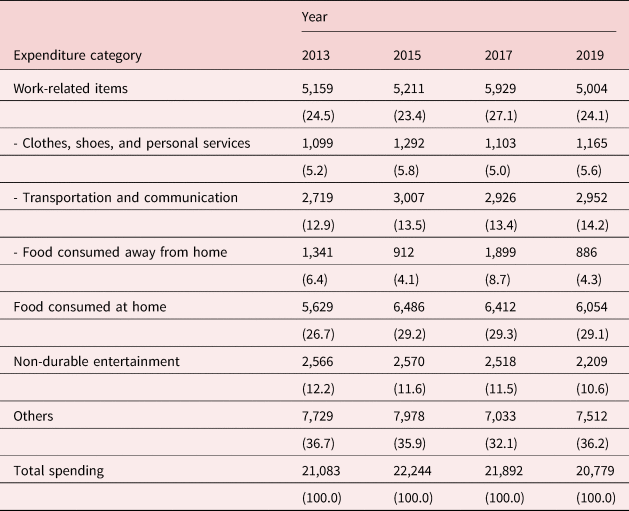
Figure 1 illustrates the relationship between the proportions of retired male heads and individuals and their age computed from the SES and TUS data, revealing a significant positive increase in the proportion of retirement at age 60. Moreover, Table 1 presents the structure of household expenditure for the sampled households with their male-heads aged 50–70, calculated from the four SES surveys over the period 2013–2019. The percentage shares of the total consumption of each category are in parentheses. The average total monthly household expenditure has slightly decreased by 1.4% from 21,083 baht in 2013 to 20,779 baht in 2019. Expenditures on work-related items account for almost one-fourth of total spending during such period, of which more than half are transportation and communication expenses. The average share of household expenditure spent on food consumed at home remains unchanged at almost 30% of total spending. Additionally, the share of food consumed away from home consumption exhibits a higher fluctuation compared to other expenditure categories, with an average of 6%. The average household spends around 11–12% of total household spending on entertainment. As can be seen, the average expenditure on three broad categories (work-related, food consumed at home, and entertainment) is 13,937 baht per month, which account for almost two-thirds of total household spending.
Proportion of retired households and individuals by age (a) Retired households, SES 2013–2019 (b) Retired individuals, 2015 TUS.

Monthly household expenditure structure

Notes: Own computations using data from the SES surveys of Thailand for households with male heads aged 50-70. The consumption expenditures are expressed in constant 2019 Thai baht. The percentage shares of each consumption category are in parentheses.
Based on the SES surveys in 2013, 2015, 2017, and 2019, the average monthly household income and expenditure are 29,219 baht and 21,492 baht, suggesting that the saving rate of the sampled households is quite high, about 26% of household income. The average head's age is about 59 years, of which 44% aged 60 and over, while only 26% reported that they are being retired. A further investigation shows that the proportion of retired heads is quite high (roughly 60%) for households living in municipal (urban) areas. In addition, almost 90% of the sample are married and living with their spouse, 56% lived in municipal areas, 68% completed primary education, and the means years of schooling is 7 years. In terms of demographic characteristics, it finds that the average household size is 3.2, and the number of children (age 15 and under) is 0.5 per family.
Using the 2015 TUS data, the average age of respondents (aged 50–70) is 59 years, which is comparable to that from the SES data. Moreover, 44% of the sample are males, nearly one-third report themselves as being retired, and more than 90% are the heads of the household or their spouses. On average, the respondents spend more than an hour and a half per day on food-related activity. It is likely that retirees replace food consumed away from home with food at-home production. In addition, they spend slightly more than an hour daily on house cleaning (62 min) and maintenance and small repairs (73 min), while the lowest average time spent per day belongs to shopping (41 min). Additional details on summary statistics, obtained from the SES and TUS surveys, are provided in Tables A1 and A2 in the Appendix.
4. Results
4.1 The RDD continuity test results
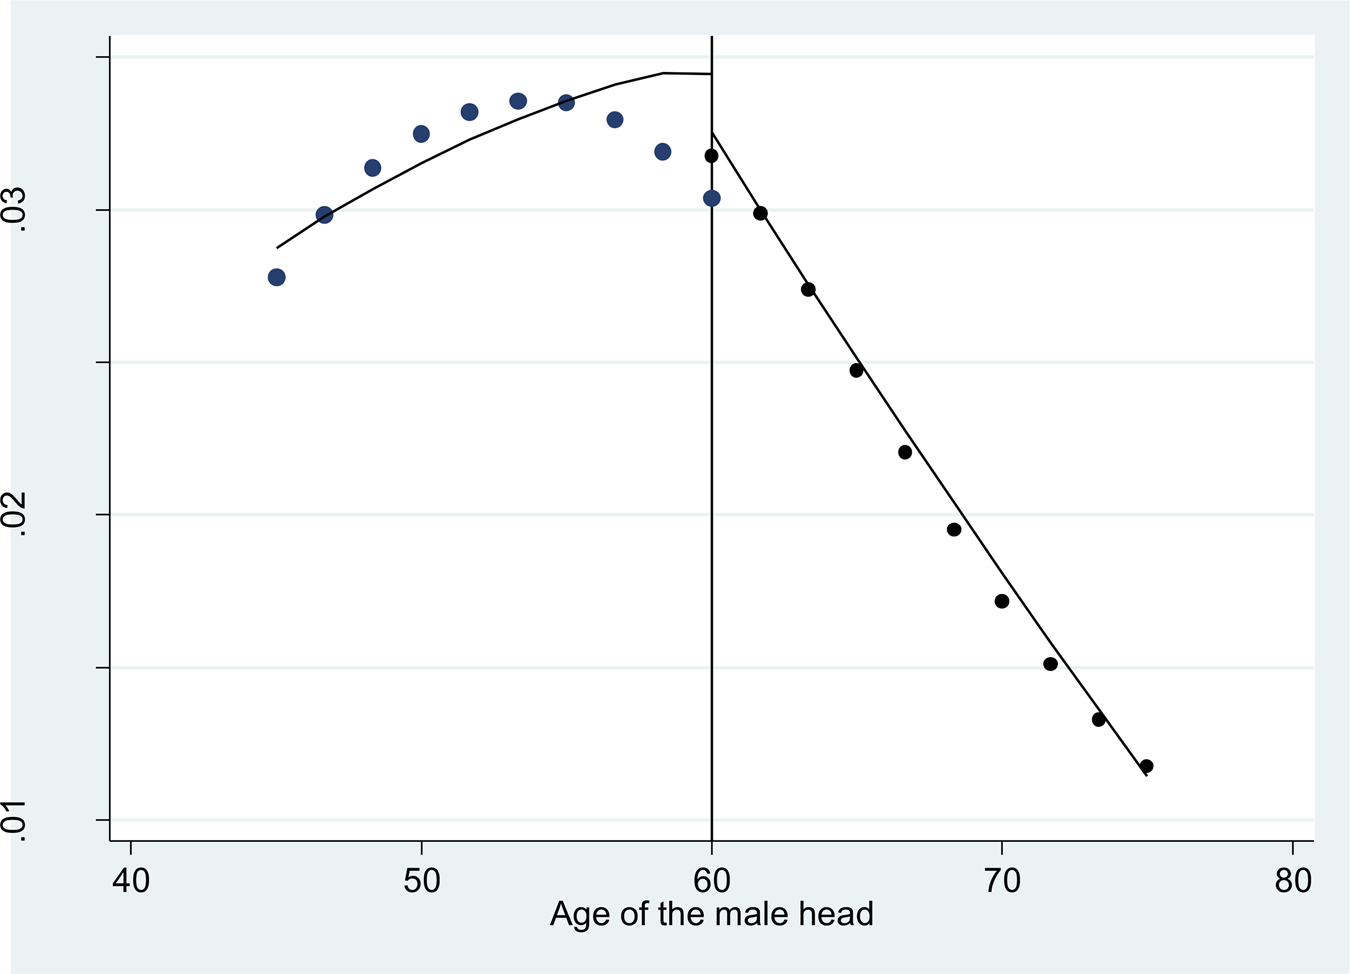
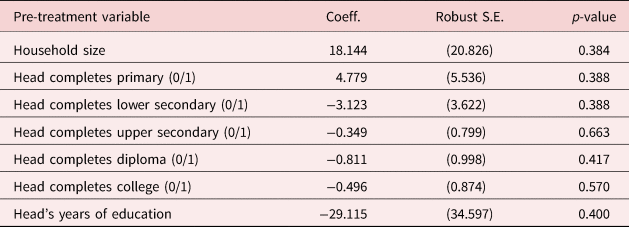
As discussed previously, the validity of the RDD crucially relies on the continuity assumption that pre-treatment characteristics, such as household size and the head's education, should not be affected by the retirement status. Table 2 provides the estimated coefficients of retirement, which being age 60 and over is used as an instrumental variable (IV). Regression results suggest that the retirement coefficients for all seven equations are not statistically different from zero with p-values ranging from 0.38 to 0.66. Thus, it is concluded that the RDD continuity assumption holds with the SES data. In addition, following the McCrary (Reference McCrary2008) manipulation test, Figure 2 shows the smoothed density function of household head's age using the same data set. The graphical analysis provides evidence of no manipulation for the running variable since the empirical plot appears to be continuous near the age threshold of 60, which substantiates the validity of RDD.
Empirical density of household head's age, SES 2013–2019.

Test results for the RDD continuity assumption

Notes: The reported coefficients in the table are from the regression of each pre-treatment variable on the head's retirement status which is instrumented by a dummy variable indicating the head's age is 60 and over. Other control covariates include a set of dummy variables for administrative areas, regions, provinces, household socioeconomic classes and survey years. Robust standard errors are in parentheses.
4.2 Impacts of retirement on changes in household income and consumption
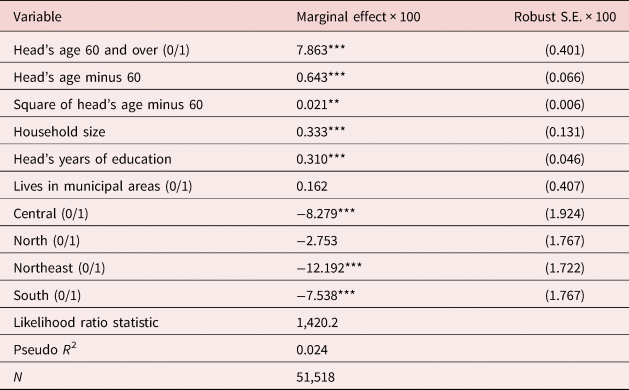
Fuzzy regression discontinuity models are estimated to investigate the effect of retirement on household income and expenditure, using being age 60 and over as an instrument for the retirement status of the male-head of the household.Footnote 9 Table 3 reports marginal effects of the probit model for the probability of being retired with robust standard errors. The results reveal that the probability of retirement increases by 7.9 percentage points at the age of 60. Moreover, the marginal effects of the head's age and its square variables are positive with values of 0.64 and 0.02, both statistically significant at the 0.05 level. Household size and head's years of education have significant positive effects on the probability of retirement with comparable marginal effects, about 0.30 percentage points. Additionally, household heads living in other regions tend to retire later than those living in Bangkok and the vicinity (the base group). On average, the first set of analyses confirms that there is a clear positive jump in the probability to retire as a head's age passes the retirement age cutoff of 60 years old.
Probit results for the retirement of the male head of household

Notes: ** significant at the 0.05 level and *** significant at the 0.01 level. Other explanatory variables not shown include a set of dummy variables for the head's marital status, administrative areas, regions, provinces, and survey years. Robust standard errors are in parentheses.
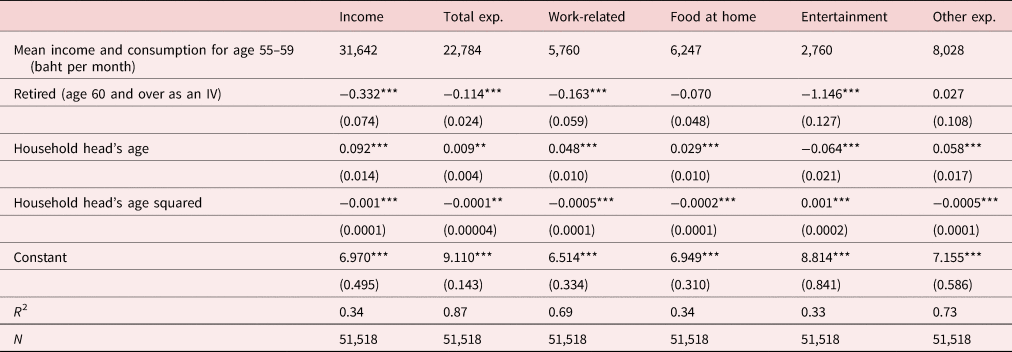
Table 4 presents the fuzzy RDD estimates of the impacts of retirement on household income and consumption. The dependent variables are logged values of monthly household income and expenditure. The means of household income and all expenditure categories for male-headed households aged 55–59 are also reported at the top of Table 4, which enable one to easily interpret changes in income and spending patterns at retirement as appeared in the study of Moreau and Stancanelli (Reference Moreau and Stancanelli2015). As expected, household income is significantly declined at retirement by 28% (e −0.332 − 1) or 8,860 baht per month. Meanwhile, retirement reduces household total expenditure by 11% or 2,506 baht per month, but with a considerably smaller magnitude than that of household income. It can be therefore inferred that the average Thai elderly households are able to smooth their consumption to some extent when confronted with the sharp decline in wage income at the time of retirement. As pointed out by Aguiar and Hurst (Reference Aguiar and Hurst2005, Reference Aguiar and Hurst2013), the decline in household expenditures around retirement is mainly due to the cessation of work-related expenses. Further analysis indicates that retirement decrease total spending (excluding work-related costs) by 9% (not reported in Table 4). In other words, work-related expenses account for nearly 20% of the decrease in total spending at retirement. On the whole, this paper finds evidence of a moderate decline in consumption (9% to 11%) during the transition to retirement, suggesting evidence of the retirement-consumption puzzle in Thailand.
Fuzzy RDD estimates on changes in income and expenditures

Notes: ** significant at the 0.05 level and *** significant at the 0.01 level. The dependent variables are monthly household income and expenditure in logarithm adjusted to 2019 prices. Other covariates not shown are education and marital status of the head of household, household size, number of children (aged 15 and below), and a set of dummy variables to indicate household socioeconomic status, income classes, administrative areas, regions, provinces, and survey years. Robust-standard errors are in parentheses.
To explore differences in consumption patterns the estimates for four broad categories of expenditure (consisting of work-related, food-at-home, entertainment, and others) are also reported in Columns (3) to (6) of Table 4. The results show that expenditures on work-related items reduce by 15%, statistically significant at the 0.01 level, as the male household head retires. However, the impacts of retirement on consumer expenditures vary considerably within this category. More specifically, retirement reduces expenditure on food consumed away from home by almost 80%, which is the highest percentage decline, followed by expenditures on clothing and transportation.Footnote 10 Despite a negative sign, retirement has no significant effect on food-at-home expenditure. This may imply that retired households are likely to smooth food consumption through shifting their spending patterns from food-away-from home consumption to food at home after their retirement. As will be seen in the following analysis, there is evidence that Thai retirees tend to spend more time on food-related activities after retirement.
Furthermore, the magnitude of a decline in expenditures on non-durable entertainment is most pronounced among households around retirement age. Retirement leads to a sharp decline in household spending on this category by almost 70%, which is statistically significant at the 0.01 level. It suggests that leisure expenditures and leisure time appear to be substitutes as the opportunity cost of time decreases for retired households. In contrast, retirement has no significant effect on other remaining expenditures. To verify the robustness of the results, two additional sets of estimates using smaller age ranges (ages 55–65 and 57–63) are provided in Tables A3 and A4 in the Appendix. Overall, the magnitudes of FRD estimates of the retirement effect for narrow age ranges are somewhat larger but consistent with those shown in Table 4.
4.3 Heterogeneous effects in consumption changes
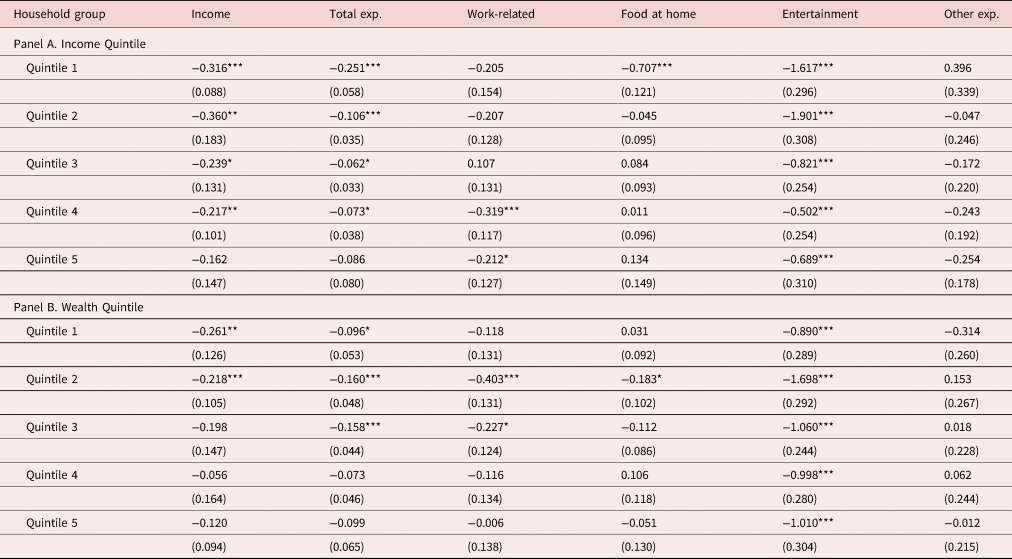
Table 5 provides the estimated impacts of the household head's retirement on income and total expenditure and its composition by income and wealth quintile. Households are divided into five income groups equally based on current household income per capita. Since this paper uses cross-sectional survey data, pre-retirement income is not observed if the heads of households are already being retired. As shown in Panel A of Table 5, retirement leads to substantial drops in household income for all income quintiles except the highest one, despite having a negative sign. In addition, the magnitude of a consumption decline at retirement is decreasing with income. Specifically, the first quintile households reduce significantly their total spending by 22% at the time of retirement, compared with about 7% for the fourth income quintiles. The results obtained here are consistent with previous studies conducted in different countries. [Bernheim et al. (Reference Bernheim, Skinner and Weinberg2001), Battistin et al. (Reference Battistin, Brugiavini, Rettore and Weber2009), Cho (Reference Cho2012), Li et al. (Reference Li, Shi and Wu2016)].
Fuzzy RDD estimates of impacts of retirement on changes in income and expenditures by income and wealth quintile

Notes: * significant at 0.10 level, ** significant at the 0.05 level, and *** significant at the 0.01 level. The dependent variables are monthly household income and expenditure in logarithm adjusted to 2019 prices. Other covariates not shown are education and marital status of the head of household, household size, number of children (aged 15 and below), and a set of dummy variables to indicate household socioeconomic status, administrative areas, regions, provinces, and survey years. Robust standard errors are in parentheses.
However, closer scrutiny reveals that the significant declines in work-related expenditures at retirement are found only for the two highest income quintiles. More specifically, the percentage declines are approximately 19% and 27% for the fourth and fifth quintiles respectively, both are statistically significant at least the 0.1 level. This result is in line with the findings of Battistin et al. (Reference Battistin, Brugiavini, Rettore and Weber2009) for Italy and Li et al. (Reference Li, Shi and Wu2016) for China. One possible explanation for this is due to a difference in spending patterns for blue-collar and white-collar workers. Blue-collar workers are on average paid lower than white-collar workers, and are likely to spend less on work-related items, particularly for adult clothes and meals eating out. Thus, it appears that their work-related expenses remain unchanged or marginally decrease at the transition from work to retirement. On the contrary, retirement causes a large decline in work-related expenses for high-income households, presumably, their heads were in white-collar occupations prior to retirement.
It is interesting that retirement leads to a sharp decline in expenditure on food consumed at home about half for the lowest income quintile. However, no significant changes in this category are detected for other higher-income quintiles. This suggests that elderly households in the lowest income quintile are one of the most vulnerable groups affected by inadequate food consumption. It seems that they may have insufficient savings to smooth food consumption effectively in response to the sharp wage income drop after retirement. In other words, reducing spending on food seems to be a coping strategy to make ends meet for low-income households. For example, they may change their food consumption patterns from buying prepared or ready meals consumed at home to inexpensive home-cooked meals to maintain calorie intake. Moreover, the poor may substitute cheap foods with low nutritious quality for high-value foods.
Furthermore, the magnitude declines in expenditure on non-durable entertainment are highly negatively associated with household income. The percentage decreases are much larger for low-income households ranging between 40% and 85%, statistically significant at the 0.01 level for all income groups. These results indicate that the entertainment category appears to be the most luxurious goods of the different household expenditure categories analyzed. Another possible explanation is that Thai retired households substitute leisure time for home-produced goods, thereby lowering demand for leisure goods, and this effect is more noticeable for low-income households. However, retirement has no significant effect on other remaining expenditure for all income groups.
Differences in spending patterns among retired households are also evident across wealth quintiles, as measured by wealth per capita. In this paper, household wealth is defined as the sum of the value of real estate assets, vehicles owned by the household, and net financial assets. Changes in income and consumption expenditures by household wealth quintile are reported in Panel B of Table 5. The two lowest wealth quintiles experience larger declines in the income of 20% to 23% at the time of retirement, while estimates for other higher wealth quintiles are not statistically significant. The results show that total expenditure declines by 9% to 15% for the first three wealth quintiles, which are statistically significant at least the 0.10 level. These results suggest that households with low assets are more likely to be affected by liquidity constraints, thus leading to larger declines in their consumption at retirement. More specifically, it is observed that expenditure on food consumed at home decreases by 17% for the second wealth quintile, and the substantial drop in work-related items are confined to the second and third wealth quintiles in a range of 24% to 33%. More interestingly, retirement has no effect on the declines in consumption expenditure for the households in the top two wealth quintiles except for the entertainment category with a decrease of 63%.
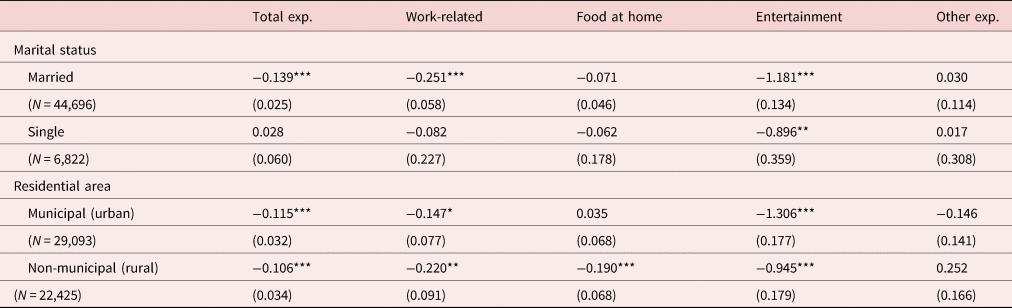
The analysis is extended to investigate a structural difference in household spending patterns around retirement by marital status of the household heads and residential areas (urban and rural). The fuzzy RDD estimates of retirement on household expenditures for the subsample analyses are given in Table 6. Note that nearly 90% of the male household heads aged 50–70 were married and living with their spouse. The magnitudes for the retirement of married heads on total spending and its components are slightly larger than those for the whole sample presented in Table 4. However, there are no systematic changes in spending patterns at retirement for single household heads (including widowed, separated, divorced, and never married) except for expenditure on entertainment with a 59% decline, which is somewhat lower than that of married couple households (69%). However, it should be noted that the lack of statistical significance for single heads may be in part due to a low variation in the subsample. Estimates of the retirement effect for the percentage declines in total spending are almost the same for urban and rural areas (about 10%). Additionally, the results indicate that the declines in work-related expenses for rural areas are 6% higher than for urban areas. A potential explanation for this discrepancy might be that workers in urban areas are likely to benefit from subsidized public transit, especially in Bangkok and the vicinity, but less so for those in rural areas.
Fuzzy RDD estimates of impacts of retirement on consumption by marital status and residential area

Notes: * significant at 0.10 level, ** significant at the 0.05 level, and *** significant at the 0.01 level. The dependent variables are monthly household income and expenditure in logarithm adjusted to 2019 prices. Other covariates not shown are household head's years of education, household size, number of children (aged 15 and below), and a set of dummy variables to indicate household socioeconomic status, income classes, regions, provinces, and survey years. Robust standard errors are in parentheses.
Interestingly, the substantial drop of 17% in food expenditure at retirement is only found in rural areas, as shown in Column 3 in Table 6. Rural-urban differences in preferences on food consumption can also account for this finding since rural households tend to substitute disproportionately food at home for food away from home after retirement. However, it does not necessarily imply that retired households in rural areas have lower living standards. Perhaps they turn to subsistence farming to produce food for the family's consumption, but it is not viable in urban areas. Finally, it seems that retirement has no effect on changes in other expenditure categories among marital status and residential areas.
4.4 Impacts of retirement on home production activities
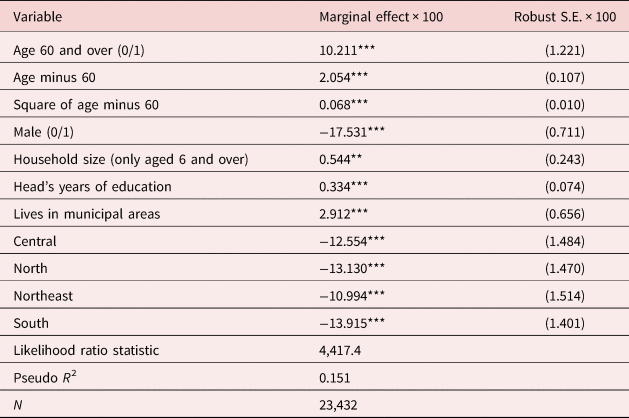
This section presents empirical results on the impact of retirement on time use in home production based on individual-level data from the Thai 2015 TUS. Following the extant literature on time use patterns at retirement, four broad activities are analyzed: (1) cooking and preparing meals; (2) house cleaning; (3) maintenance and small repairs; and (4) shopping. The dependent variable is the minutes spent daily on each home production activity. Table 7 presents probit results for the factors that determine the retirement decision. The results show that the probability to retire increases significantly by 10.2 percentage points at age 60, suggesting this age instrument has strong predictive power for retirement. In addition, almost all significant variables have the expected signs: respondents in larger households or with high education are more likely to retire early with marginal effects of 0.54 and 0.33.
Probit results for individual retirement

Notes: ** significant at the 0.05 level and *** significant at the 0.01 level. Other explanatory variables not shown include a set of dummy variables for marital status, relation to the household head, administrative areas, regions, provinces, and survey months and years. Robust standard errors are in parentheses.
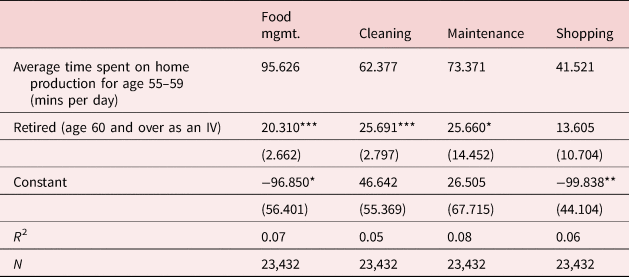
Table 8 presents the fuzzy RDD estimates of the impact of retirement on time spent on home production for individuals aged 50–70. The average time spent (in minutes per day) on each activity is also reported in the same table for individuals approaching retirement in order to easily make comparisons. Regression results for the entire sample show that retirement is highly accompanied by an increase of time allocated to home production except for shopping. Estimation results support the leisure-substitution hypothesis of Aguiar and Hurst (Reference Aguiar and Hurst2005) that retirees are likely to increase their hours in-home production after retirement, thereby resulting in a discernible drop in household spending.
Fuzzy RDD estimates of impacts of retirement on home production

Notes: * significant at 0.10 level, ** significant at the 0.05 level, and *** significant at the 0.01 level. The dependent variable is daily time spent (in minutes) on home production. Age and age squared are excluded from the outcome regression due to insignificant coefficients. Other explanatory variables not shown include years of education, a set of dummy variables for marital status, relation to the household head, administrative areas, regions, provinces, and survey months and years. Robust standard errors are in parentheses
Additionally, retirement increases the minutes spent on food management (cooking, preparing, and cleaning after done) by 20.3 min per day or a 21% increase relative to the respondents aged 55–59. Retirement considerably raises time spent on house cleaning and maintenance and small repairs, about 25.7 min per day. Despite of an expected sign, it finds that there is a relatively small (13.6) insignificant increase in time spent on shopping after retirement. Overall, the results show a considerable increase in home production at the time of retirement for the Thai case. More explicitly, retirement is associated with an additional 71.7 min per day (20.3 + 25.7 + 25.7, only significant coefficients included) or equivalent to 8.4 h per week in home production activities. To check for the robustness of the results, the estimated coefficient of retirement on home production based on the two subsamples: age 55–65 and age 57–63 are also reported in Tables A5 and A6 in the Appendix. Overall, further analysis collaborates the main results above.
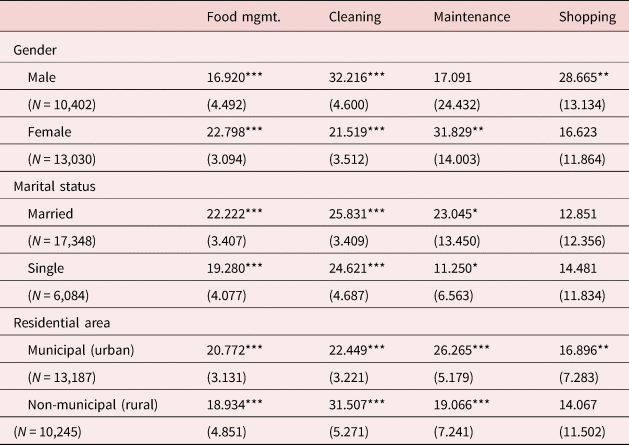
Heterogeneity effects of retirement on home production are provided in Table 9.Footnote 11 The results indicate gender differences in the time allocated to home production after their retirement. As expected, elderly females spend more time than males on cooking and preparing meals upon retirement, about 22.8 min compared to males' 16.9 min. However, it is surprising that retirement results in an increase of house cleaning of 32.2 min for elderly males more than females do (21.5 min). Moreover, it could be inferred that a dramatic increase in leisure on retirement may affect the time use patterns of retirees that they engage more in non-familiar activities. For example, females habitually spend their time shopping much more than males do for all age groups, thus it has no significant increase in time spent for females at the time of retirement. In contrast, it is observed that retired males spend more time shopping mainly due to the decrease in the opportunity cost of time. This explanation is also applied to maintenance and small repairs, reporting that retired females allocate more time to this activity than males do.
Fuzzy RDD estimates of impacts of retirement on home production by gender and socioeconomic status

Notes: * significant at 0.10 level, ** significant at the 0.05 level, and *** significant at the 0.01 level. The dependent variable is daily time spent (in minutes) on home production. Age and age squared are excluded from the outcome regression due to insignificant coefficients. Other explanatory variables not shown include years of education, a set of dummy variables for relation to the household head, regions, provinces, and survey months and years. Robust standard errors are in parentheses.
In addition to gender effects on time use patterns at retirement, retirees living with their spouse tend to engage more in most activities. In terms of urban-rural differences, retirees living in urban areas spent an additional 21 min per day on food management, which is comparable to those living in rural areas (19 min). Moreover, there is a significant increase in the time allocated to shopping for urban retirees, about 17 min, but this is not the case in rural areas. Results for the subsample analyses are consistent with the main results presented in Table 8.
The final analysis in this paper is to investigate the extent to which the decline in household spending at retirement is offset by the increased hours in-home production using the results in the previous section. To begin, I use one-half of the average monthly wages from the 2019 National Labor Force Survey (NLFS) as an estimate of the opportunity cost of doing home production after retirement. The average monthly wage was 11,336 baht for the elderly (aged 60 and over) who remained active in the labor market, thus the imputing value is 5,668 baht per month or about 31 baht per hour. Once accounting for the additional time spent on home production from the regression estimates in Table 8 (8.4 h per week) and the imputed hourly cost mentioned above, the monetary value of home production is 1,094 baht per month (31 baht/h *8.4 h/week *4.2 weeks). Overall, it finds that household spending drops to 6.2%, suggesting that the observed fall in consumption expenditure around retirement results mainly from substituting home-produced goods for market goods. However, the retirement-consumption puzzle still exists in Thailand, but to a less extent.
5. Conclusion
This paper presents a comprehensive analysis of changes in household spending and time use patterns at retirement, and also examine the retirement-consumption puzzle in Thailand. A regression discontinuity approach is employed to quantify the retirement effect on consumption and home production, exploiting the fact that the mandatory retirement and pension eligibility age is 60 for workers in the formal sectors. Main results have revealed that total spending declines substantially by 11% at retirement using SES for the period 2013–2019. Closer scrutiny indicates that the sharp declines in expenditure are mainly driven by work-related and entertainment categories. Moreover, this paper finds no evidence of a significant decline in expenditure on food at home upon retirement for the whole sample, but the sharp drop in food-at-home consumption is restricted to low-income and low-asset households. The subsample analysis highlights the heterogeneous effects across socioeconomic status and urban/rural areas.
Using the 2015 Thai TUS, the regression results for home production have demonstrated that retirement results in substantial increases in time spent on various home production activities with an estimate of 8.4 h per week. These results are consistent with the leisure-substitution hypothesis that market expenditures are basically replaced by home-produced goods when individuals retire. Once taken into account for the households' home production, total expenditure falls about 6% at the time of retirement, which reflects the retirement-consumption puzzle in Thailand to some extent. In other words, this finding seems inconsistent with the life-cycle model of a consumption augmented with home production.
The research results contribute to policy implications for developing countries with relatively immature pension systems. The crucial result of the moderate consumption drop at retirement suggests that most retired households in Thailand are unable to fully smooth consumption through the transition from working to retirement. Therefore, the government should place more emphasis on increasing access to pension coverage and formal insurance for middle-aged and elderly workers, especially for those in the informal sectors. This may help them to be more resilient to a decline in their income at retirement and unforeseen adverse shocks associated with retirement such as health problems, rising health care costs, and inflation risk. Reasonable tax-subsidized long-term savings schemes integrated with the mandatory savings are also recommended. Future research is needed to explore the role of expectations on retirement timing and the effect of involuntary early retirement primarily arising from health shocks and job termination for an older worker. Such analysis would provide a better understanding of the economic behavior of the elderly.
Acknowledgements
The author would like to thank Direk Pattamasiriwat for his guidance and insightful comments on an earlier version of this paper. The author gratefully acknowledges helpful suggestions and constructive comments from the editor and the two anonymous reviewers. The author also thanks the National Statistical Office of Thailand (NSO) for allowing me to access the data used in this paper. The research was funded by Contract MRG6280239 from Thailand Science Research and Innovation (TSRI), formerly Thailand Research Fund (TRF). The opinions expressed in this paper are the author's own and do not necessarily reflect the view of TSRI or Burapha University. All remaining errors are the author's responsibility.
Supplementary material
The supplementary material for this article can be found at https://doi.org/10.1017/dem.2021.32.