Introduction
Since the production of the first mammal by somatic cell nuclear transfer (NT), there has been little improvement in the efficiency of this technique and only a few percentage of reconstructed embryos developed to term (Meissner & Jaenisch, Reference Meissner and Jaenisch2006; Wilmut et al., Reference Wilmut, Schnieke, McWhir, Kind and Campbell1997). The transfer of somatic cells to enucleated oocytes requires differentiated cell nuclei to dedifferentiated in the oocyte cytoplasm, convert to a totipotent state and then induce somatic gene expressing, a process termed nuclear reprogramming (Gurdon et al., Reference Gurdon, Laskey, De Robertis and Partington1979; Solter, Reference Solter2000). DNA methylation and histone modifications play essential roles during preimplantation development (Santos et al., Reference Santos, Hendrich, Reik and Dean2002; Sarmento et al., Reference Sarmento, Digilio, Wang, Perlin, Herr, Allis and Coonrod2004). Studies have confirmed that epigenetic reprogramming is severely deficient in cloned embryos (Bourc'his et al., 2001). Such reports have mainly focused on patterns of DNA methylation that lead to abnormal DNA methylation and gene expression throughout the NT embryo preimplantation period (Dean et al., Reference Dean, Santos, Stojkovic, Zakhartchenko, Walter, Wolf and Reik2001, Reference Dean, Santos and Reik2003).
Histone N-termini (tails) undergo diverse post-translational modifications, including acetylation, methylation and phosphorylation (Biel et al., Reference Biel, Wascholowski and Giannis2005), which play important roles in chromatin structure and transcriptional regulation (Kurdistani et al., Reference Kurdistani, Tavazoie and Grunstein2004). The acetylation recruit activators to regulate gene activity, which is associated with diverse chromatin-related processes (Kurdistani et al., Reference Kurdistani, Tavazoie and Grunstein2004). Presently known sites for acetylation include at least four highly conserved lysines (K) in histone H4 (K5, K8, K12, K16) and in histone H3 (K9, K14, K18, K23) (Bjerling et al., Reference Bjerling, Silverstein, Thon, Caudy, Grewal and Ekwall2002). Histone methylation can signal either gene activation or repression, depending on the sites of methylation (Martin & Zhang, Reference Martin and Zhang2005). Arginine (R) and lysine (K) at N-termini of core histones were modified by methylation. Arginine methylation in histone H3 (R2, R17 and R26) and histone H4R3 mainly link with transcriptional stimulation (Stallcup, Reference Stallcup2001), while lysine methylation in histone H3 (K4, K9, K27, K36 and K79) and histone H4K20 play opposite roles in regulation of gene expression and repression (Lachner et al., Reference Lachner, O'Sullivan and Jenuwein2003). K4 methylation is associated with transcriptional active chromatin and K9 methylation with inactive chromatin in higher eukaryotes (Lachner & Jenuwein, Reference Lachner and Jenuwein2002). In mouse, enhanced acetylation signals of H3K9, H3K18, H4K5 and H4K8 were observed at nuclear periphery and the changes of localization were correlative with gene expression and zygote genomic activation (ZGA) (Adenot et al., Reference Adenot, Mercier, Renard and Thompson1997; Stein et al., Reference Stein, Worrad, Belyaev, Turner and Schultz1997). Methyl-H3K4 and K9 were closely associated with the formation of paternal pronucleus and genomic DNA methylation (Lepikhov & Walter, Reference Lepikhov and Walter2004; Liu et al., Reference Liu, Kim and Aoki2004; Park et al., Reference Park, Jeong, Shin, Lee and Kang2007). Histone modifications in cloned embryos, however, are still poorly understood. Wang et al. (Reference Wang, Kou, Zhang and Gao2007) reported that TSA could improve histone modification patterns of mouse cloned embryos therefore increasing NT embryo development (Kishigami et al., Reference Kishigami, Mizutani, Ohta, Hikichi, Thuan, Wakayama, Bui and Wakayama2006; Rybouchkin et al., Reference Rybouchkin, Kato and Tsunoda2006). These results suggest that normal histone modifications are necessary to establish normal development in cloned embryos (Wang et al., Reference Wang, Kou, Zhang and Gao2007).
Although aberrant hyperacetylation and methylation on histone H3 sites have been reported in bovine cloned embryos, very few histone modification sites were examined (Santos et al., Reference Santos, Zakhartchenko, Stojkovic, Peters, Jenuwein, Wolf, Reik and Dean2003; Suteevun et al., Reference Suteevun, Parnpai, Smith, Chang, Muenthaisong and Tian2006). H3K18 (Suteevun et al., Reference Suteevun, Parnpai, Smith, Chang, Muenthaisong and Tian2006) and H3K9 (Santos et al., Reference Santos, Zakhartchenko, Stojkovic, Peters, Jenuwein, Wolf, Reik and Dean2003) were observed to be acetylated throughout the cloned embryonic stages. Hyperacetylation of H3K18ac at 4-cell and 8-cell stages in Swamp buffalo embryos was observed by Suteevun et al. (Reference Suteevun, Parnpai, Smith, Chang, Muenthaisong and Tian2006). In the present study, we thoroughly investigated the localization and dynamic changes of multiple histone acetylated (H3K9, H3K18, H4K5, H4K8) and methylated (H3K9, H3K4) sites of NT and IVF generated embryos. The fluorescence intensity of each histone modified site of 1-, 2-, 8-cell, morula and blastocyst stages was analysed and the results compared.
Materials and Methods
Unless otherwise mentioned, all reagents used were purchased from Sigma Chemical Co. Each experiment was repeated three or more times. Eighty per cent or more of examined embryos in each experimental group showed the similar results.
Isolation and culture of bovine fibroblast cells
Fibroblast cells were derived from ear tissue from a 6-year-old Hereford bull. Skin tissues were removed from cartilage, minced, washed and then transferred to 60 mm dishes containing Dulbecco's modified Eagles medium (DMEM, Gibco) + 15% FCS + 0.1% penicillin/streptomycin at 37 °C in 5% CO2 in air. After ≥80% confluence, the cells were passaged and frozen with 10% dimethyl sulfoxide in DMEM plus 20% FBS. For somatic cell nuclear transfer (SCNT), frozen–thawed fibroblasts were cultured for three to six passages in DMEM plus 10% FBS.
Oocyte in vitro maturation (IVM)
Ovaries were collected from a local abattoir and transported to the laboratory in saline (30 °C) in 2 h. Cumulus–oocyte complexes (COCs) were aspirated from 2–8 mm follicles with an 18-gauge needle syringe. COCs with a compact and a homogenous ooplasm were selected for in vitro maturation. Forty to 50 COCs were cultured in 4-well plates with 0.5 ml/well TCM-199 medium (Gibco) supplemented with 10% FCS, 0.01 U/ml FSH, 1 µg/ml 17β-estradiol and 0.1% (v/v) penicillin/streptomycin (WAKO) at 38.5 °C in 5% CO2 for 16–18 h.
Nuclear transfer and culture of the cloned embryos
After oocyte maturation, cumulus cells were removed by vortexing in 0.1% hyaluronidase for 4 min. Oocytes with the first polar bodies were selected as recipient cytoplasts. Single fibroblast cells were transferred to the perivitelline space of enucleated recipient cytoplasts. The couplets were fused in mannitol fusion buffer (Wells et al., 1999) by two electric DC pulses of 1.8 kV/cm for 20 µs delivered by a Voltain cell fusion system (Cryologic).
At IVM 25–26 h, fused clones were exposed to 5 µM ionomycin for 5 min, followed by a 5-h incubation in synthetic oviduct fluid medium (SOF) containing 10 µg/ml cycloheximide (CHX). Then the activated embryos were cultured in SOFaa medium supplemented with 8 mg/ml bovine serum albumin (fatty acid free, fraction V), 1% (v/v) non-essential amino acids (100×, Gibco BRL), 2% (v/v) essential amino acids (50×, Gibco BRL), 1 mM l-glutamine, 0.4 mM sodium pyruvate and 50 µg/ml gentamycin in 40 µl droplets overlaid with mineral oil at 38.5 °C, 5% CO2 in a humidified atmosphere for 48 h. Embryos that cleaved were transferred into 40 µl drops of SOFaa containing 4% FBS until they developed to the blastocysts stage.
In vitro fertilization
Hereford semen was purchased from a local livestock germ plasm centre for the production of IVF embryos. Frozen semen was thawed at 37 °C and washed twice by centrifugation at 300 g for 5 min in Brackett and Oliphant (BO) medium (Brackett and Oliphant Reference Brackett and Oliphant1975) supplemented with 10 mM caffeine without BSA (Solution A). A total of 20 × 106 to 30 × 106 sperm/ml were resuspended in Solution A and then diluted with an equal volume of Solution B, which contains BO medium supplemented with 20 mg/ml of BSA and 20 µg/ml of heparin (Mochida Pharmaceutical Co., Ltd). After 22 h of maturation, oocytes were transferred into 100 µl droplets of sperm suspension under mineral oil and incubated for 6 h under a humidified atmosphere of 5% CO2, 95% air at 38.5 °C. Then the presumptive zygotes were cultured in SOFaa for 48 h. The cleaved embryos were transferred to 40 µl droplets of SOFaa with 4% FBS under humidified atmosphere of 5% CO2 in air at 38.5 °C.
Indirect immunofluorescent staining of preimplantation embryos
IVF embryos at pronuclear, 2- and 8-cell, morula and blastocyst stages were collected at 18, 24, 48, 120 and 168 h after co-incubation of oocytes and spermatozoa, respectively. The correspondent stage of NT embryos was collected at 18, 24, 48, 120 and 168 h, respectively, after treatment of the fused embryos with ionomycin and CHX. All embryos were fixed in 4% paraformaldehyde for 30 min and stored at 4 °C until analysed. Fixed embryos were washed in PBS, permeabilized in 1% Triton X-100 for 1 h and then blocked in PBS containing 2% BSA (PBS + 2% BSA) for 1 h at room temperature. Embryos were incubated overnight at 4 °C in a 1:100 dilution of primary antibodies. The anti-histone modification antibodies were as follows: rabbit antiserum anti-acetyl-lysine 9 in histone H3 (H3K9ac) antibody; anti-acetyl-lysine 18 in histone H3 (H3K18ac) antibody; anti-acetyl-lysine 8 in histone H4 (H4K8ac) antibody; anti-acetyl-lysine 5 in histone H4 (H4K5ac) antibody; anti-trimethyl-lysine 4 in histone H3 (H3K4me3) antibody; and anti-dimethyl-lysine 9 in histone H3 (H3K9me2) antibody. All these antibodies were purchased from Upstate Biotechnology. After extensive washing in PBS + 2% BSA, embryos were incubated in secondary FITC (fluorescein isothiocyanate) conjugated anti-rabbit immunoglobulin G (Santa Cruz) diluted 1:500 for 1 h at room temperature. Nuclear status of embryos was evaluated by staining with 10 µg/ml propidium iodide (PI) for 10 min. Individual embryos were mounted on slides by using PBS containing 50% glycerol.
Scanning confocal microscopy
Fluorescence was detected by a confocal laser-scanning microscope (Bio-red MRC 1024 ES). Instrument settings were kept constant for each replicate. Each developmental panel was repeated three times and at least 15 embryos at each stage were evaluated each time. The fluorescence images of embryos were analysed by using the program Image-J from the National Institutes of Health (http://rsb.info.nih.gov/ij/). The relative intensity was calculated as described previously (Kim et al., Reference Kim, Ogura, Nagata and Aoki2002). Fluorescence intensities of all individual nuclei of embryos at the pronuclear, 2- and 8-cell and 15 nuclei per morula and 15 nuclei in trophectoderm (TE), 15 nuclei in the inner cell mass (ICM) per blastocyst were captured and recorded. The relative level of global histone acetylation and methylation of an embryo was represented by the average of all analysed nuclei.
Statistical analysis
The relative levels of histone acetylation and methylation at each developmental stage were carried out by ANOVA of SPSS and differences were considered significant at p ≤ 0.05. Comparison of histone acetylation and methylation between IVF and NT embryos at each stage was analysed by t-test. Significance was established at p ≤ 0.05.
Results
In vitro development of IVF and cloned bovine embryos
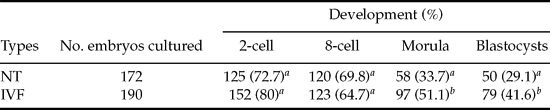
The cleavage rates and 8-cell development were with no difference between IVF and cloned embryos. However, significantly higher morula (51.1% vs. 33.7%) and blastocyst (41.6% vs. 29.1%) development were obtained in IVF than the cloned embryos, respectively (Table 1).
In vitro development of bovine nuclear transfer and IVF embryos.
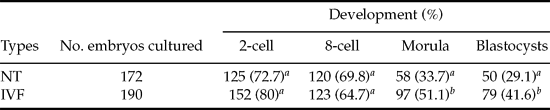
a ,b Values in columns with different superscripts differ significantly (p < 0.05).
Distribution patterns of acetyl-H3 lysine 9 (H3K9ac) in bovine IVF and NT embryos
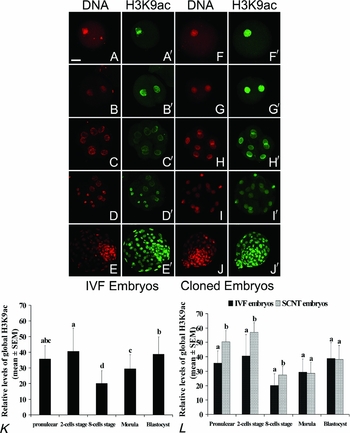
In control IVF embryos, the pattern of H3K9ac staining was uniform in male and female pronuclei (Fig. 1A,A′), although significantly less intensive (p < 0.01) than that in NT pronucleus (Fig. 1F,F′,L). In cloned 2-cell embryos, similar signal intensity was observed when compared with the pronuclear stage (Fig. 1F–G′), which was more intensive than that in IVF embryos (Fig. 1L, p < 0.01). At the 8-cell stage, the fluorescence signals significantly decreased in both cloned and IVF embryos (Fig. 1C,C′,H,H′, K) and more intensive H3K9ac signals were observed in cloned verses IVF embryos (Fig. 1L, p < 0.01). From morula to the blastocyst stages, the H3K9ac fluorescence signals gradually increased and co-located in chromosomes in both cloned and IVF embryos. There were no observable differences in fluorescent intensity (Fig. 1D–E′,I–J′,L). At the blastocyst stage, the H3K9ac signals exhibited homogeneous staining in both the inner cell mass (ICM) and the trophectoderm cells (TE) (Figs. 1E,E′,J,J′ and 7A).
Acetylation patterns of histone H3 lysine 9 (H3K9ac) in IVF (A–E′) and cloned (F–J′) bovine embryos. The staining patterns in 1-cell in IVF (A,A′) and cloned (F,F′) embryos at pronuclear stage; 2-cell in IVF (B,B′) and cloned (G,G′) embryos; 8-cell in IVF (C,C′) and cloned (H,H′) embryos, in IVF (D,D′) and cloned (I,I′) morula; and in IVF (E,E′) and cloned (J,J′) blastocysts are shown – Bar 50 µm. Relative levels of global H3K9ac in nucleus (mean ± SEM) during IVF embryo development. Values with different superscripts differ significantly (p < 0.05) in relative levels of histone acetylation across developmental stages within each stage (K). Relative levels of acetylated histone in H3 lysine 9 in IVF and cloned embryos were examined by Image-J software. a/bValues with different superscripts differ significantly (p < 0.05) between embryo types at the same developmental stage (L). See online for a colour version of this figure.

Distribution patterns of acetyl-H3 lysine 18 (H3K18ac) in IVF and NT bovine embryos
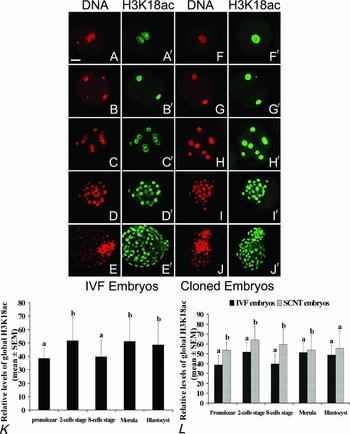
In cloned embryos from 1-cell to the morula stage, the H3K18ac maintained a strong staining pattern (Fig. 2F–I′). In IVF embryos, the H3K18ac signal in 8-cell stage embryos was significantly decreased when compared with 2-cell embryos (Fig. 2C,C′,K, p < 0.01), whereas the signal staining significantly increased in morulae (Fig. 2D,D′,K, p < 0.01). At the blastocyst stage, the H3K18ac signals were less intense in ICM than in TE cells in both cloned and IVF embryos (Figs. 2E,E′,J, J′ and 7B, p < 0.01). These results infer that there are significant differences in the distribution pattern of H3K18ac between cloned and IVF embryos from the zygote to morula stages (Fig. 2L, p < 0.05). However, there was no significant difference in the distribution and intensity of H3K18ac fluorescence signals between IVF and cloned embryos at the blastocyst stage (Fig. 2L, p > 0.05).
Acetylation patterns of histone H3 lysine 18 (H3K18ac) in IVF (A–E′) and cloned (F–J′) bovine embryos. The staining patterns in 1-cell in IVF (A,A′) and cloned (F,F′) embryos at pronuclear stage; 2-cell in IVF (B,B′) and cloned (G,G′) embryos; 8-cell in IVF (C,C′) and cloned (H,H′) embryos, in IVF (D,D′) and cloned (I,I′) morula; and in IVF (E,E′) and cloned (J,J′) blastocysts are shown – Bar 50 µm. Relative levels of global H3K18ac in nucleus (mean ± SEM) during IVF embryo development. Values with different superscripts differ significantly (p < 0.05) in relative levels of histone acetylation across developmental stages within each stage (K). Relative levels of H3K18ac in IVF and cloned embryos were examined by Image-J software. a/bValues with different superscripts differ significantly (p < 0.05) between embryo types at the same developmental stage (L). See online for a colour version of this figure.

Distribution patterns of acetyl-H4 lysine 5 (H4K5ac) in bovine IVF and NT embryos
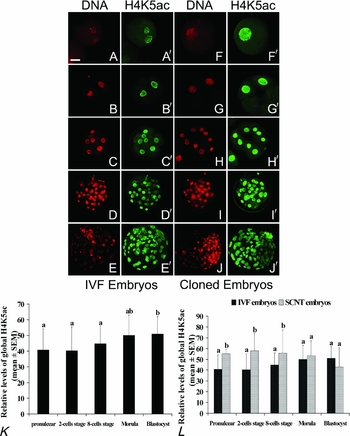
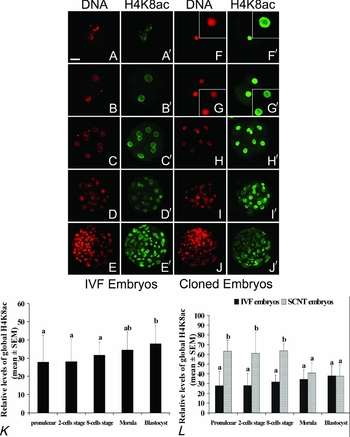
H3K9ac and H3K18ac signals revealed similar staining patterns in H4K5ac of 1-cell stage cloned and IVF embryos (Fig. 3A,A′,F,F′,L). In IVF embryos, the H4K5ac staining was co-located in chromosomes at the pronuclear stage. Enhanced staining of H4K5ac was observed at the interphase nuclear periphery from the 2- to 8-cell stages (Fig. 3B–C′). However, the signal in NT embryos was distributed through the nucleoplasm from the zygote to 8-cell stages (Fig. 3F–H′). In IVF embryos, there was no fluorescence intensity difference from pronuclei to the morula stages of development (Fig. 3K). Significant intensity differences of H4K5ac fluorescence signals were observed between cloned and IVF embryos from the zygote to the 8-cell stages (Fig. 3L, p < 0.05). No obvious changes of H4K5ac signals were observed in NT and IVF morulae (Fig. 3D,D′,I,I′,L, p > 0.05). At the blastocyst stage, the H4K5ac signal was less intensive in ICM than TE cells in both IVF and cloned embryos (Fig. 7C, p < 0.01). No significant difference in fluorescent intensity was observed in IVF and cloned blastocysts (Fig. 3E,E′,J,J′,L, p > 0.05).
Acetylation patterns of histone H4 lysine 5 (H4K5ac) in IVF (A–E′) and cloned (F–J′) bovine embryos. The staining patterns in 1-cell in IVF (A,A′) and cloned (F,F′) embryos at pronuclear stage; 2-cell in IVF (B,B′) and cloned (G,G′) embryos; 8-cell in IVF (C,C′) and cloned (H,H′) embryos, in IVF (D,D′) and cloned (I,I′) morula; and in IVF (E,E′) and cloned (J, J′) blastocysts are shown – Bar 50 µm. Relative levels of global H4K5ac in nucleus (mean ± SEM) during IVF embryo development. Values with different superscripts differ significantly (p < 0.05) in relative levels of histone acetylation across developmental stages within each stage (K). Relative levels of H4K5ac in IVF and cloned embryos were examined by Image-J software. a/bValues with different superscripts differ significantly (p < 0.05) between embryo types at the same developmental stage (L). See online for a colour version of this figure.

Distribution patterns of acetyl-H4 lysine 8 (H4K8ac) in bovine IVF and NT embryos
The H4K8ac signal was distributed throughout the nucleoplasm in IVF pronuclear embryos and then located around the pronuclear periphery in 2- to 8-cell stage embryos (Fig. 4A–C′). In the cloned embryos, however, there was enhanced H4K8ac staining at nuclear periphery from the pronuclear to the 8-cell stage of development (Fig. 4F–H′). In IVF embryos, a comparable fluorescence intensity of H4K8ac was observed from the pronuclei to the morula stages (Fig. 4K). The H4K8ac fluorescence signals in cloned embryos were more intensive than IVF embryos when developing to the 8-cell stage (Fig. 4L, p < 0.05). In both IVF and cloned blastocysts, H4K8ac signals were less intensive in ICM than TE (Figs. 4E,E′,J,J′ and 7D, p < 0.01). There was no significant difference in the intensity of H4K8ac fluorescence signals between IVF and cloned embryos from the morula to the blastocyst stage of development (Fig. 4L).
Acetylation patterns of histone H4 lysine 8 (H4K8ac) in IVF (A–E′) and cloned (F–J′) bovine embryos. The staining patterns in 1-cell in IVF (A,A′) and cloned (F,F′) embryos at pronuclear stage; 2-cell in IVF (B,B′) and cloned (G,G′) embryos; 8-cell in IVF (C,C′) and cloned (H,H′) embryos, in IVF (D,D′) and cloned (I,I′) morula; and in IVF (E,E′) and cloned (J,J′) blastocysts are shown – Bar 50 µm. Relative levels of global H4K8ac in nucleus (mean ± SEM) during IVF embryo development. Values with different superscripts differ significantly (p < 0.05) in relative levels of histone acetylation across developmental stages within each stage (K). Relative levels of H4K8ac in IVF and cloned embryos were examined by Image-J software. a/bValues with different superscripts differ significantly (p < 0.05) between embryo types at the same developmental stage (L). See online for a colour version of this figure.

Distribution patterns of trimethyl-H3 lysine 4 (H3K4me3) in bovine IVF and NT embryos
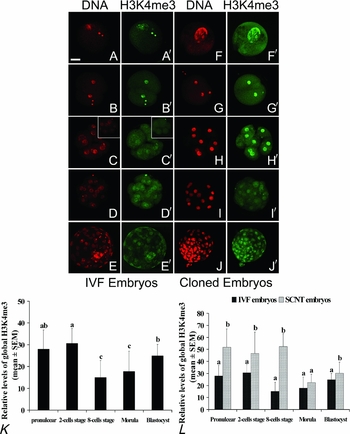
H3K4me3 fluorescence signals were detected from the pronuclear to the 8-cell stages in cloned embryos and were more intensive than observed in IVF embryos (Fig. 5A–C′, F–H′,L, p < 0.05). No signal decrease was observed at the 8-cell stage of development (Fig. 5H,H′), although a significantly decrease occurred by the morula stage (Fig. 5I,I′). At the blastocyst stage, the staining of H3K4me3 in both cloned and IVF embryos was homogeneous, with no difference between ICM and TE (Fig. 5E,E′,J,J′). In IVF embryos, more intensive H3K4me3 signals were observed in the female pronucleus (Fig. 5A,A′). At the 8-cell stage, the H3K4me3 signals decreased significantly (41.5%, 27/65) or disappeared (49.2%, 32/65) and only 9.2% of the embryos (6/65) were detected with H3K4me3 (Fig. 5C,C′,K, p < 0.05). At the morula stage, 84.3% (43/51) of the embryos showed either a weak 15.7% (8/51) or no signal (Fig. 5D,D′). There was no statistical difference in the distribution pattern of H3K4me3 between IVF and cloned embryos from the morula to the blastocyst stages of development (Fig. 5L, p > 0.05).
Patterns of tri-methyl-histone H3 lysine 4 (H3K4me3) in IVF (A–E′) and cloned (F–J′) bovine embryos. The staining patterns in 1-cell in IVF (A,A′) and cloned (F,F′) embryos at pronuclear stage; 2-cell in IVF (B,B′) and cloned (G,G′) embryos; 8-cell in IVF (C,C′) and cloned (H,H′) embryos, in IVF (D,D′) and cloned (I,I′) morula; and in IVF (E,E′) and cloned (J,J′) blastocysts are shown – Bar 50 µm. Relative levels of global H3K4me3 in nucleus (mean ± SEM) during IVF embryo development. Values with different superscripts differ significantly (p < 0.05) in relative levels of histone acetylation across developmental stages within each stage (K). Relative levels of H3K4me3 in IVF and cloned embryos were examined by Image-J software. a/bValues with different superscripts differ significantly (p < 0.05) between embryo types at the same developmental stage (L). See online for a colour version of this figure.

Distribution patterns of dimethyl-H3 lysine 9 (H3K9me2) in bovine IVF and NT embryos
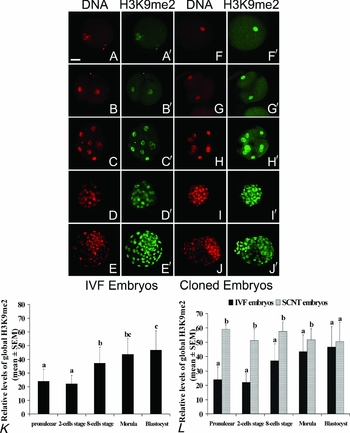
Cloned embryo signals were strongly stained and did not change from the pronuclear stage to the blastocyst stage of development (Fig. 6F–J′). At the blastocyst stage, there was no significant difference in H3K9me2 staining in IVF and cloned embryos, nor between ICM and TE (Figs. 6E,E′,J,J′ and 7F). In IVF embryos, the H3K9me2 signals in pronuclei and 2-cell embryos were weak, but increased significantly with embryo development from the 8-cell to the blastocyst stage (Fig. 6A–E′,K, p < 0.01). There was significant difference in fluorescence intensity of H3K9me2 between cloned and IVF embryos from the pronuclear to the morula, but not the blastocyst stages (Fig. 6L, p < 0.05).
Patterns of di-methyl-histone H3 lysine 9 (H3K9me2) in IVF (A–E′) and cloned (F–J′) bovine embryos. The staining patterns in 1-cell in IVF (A,A′) and cloned (F,F′) embryos at pronuclear stage; 2-cell in IVF (B,B′) and cloned (G,G′) embryos; 8-cell in IVF (C,C′) and cloned (H,H′) embryos, in IVF (D,D′) and cloned (I,I′) morula; and in IVF (E,E′) and cloned (J,J′) blastocysts are shown – Bar 50 µm. Relative levels of global H3K9me2 in nucleus (mean ± SEM) during IVF embryo development. Values with different superscripts differ significantly (p < 0.05) in relative levels of histone acetylation across developmental stages within each stage (K). Relative levels of H3K9me2 in IVF and cloned embryos were examined by Image-J software. a/bValues with different superscripts differ significantly (p < 0.05) between embryo types at the same developmental stage (L). See online for a colour version of this figure.

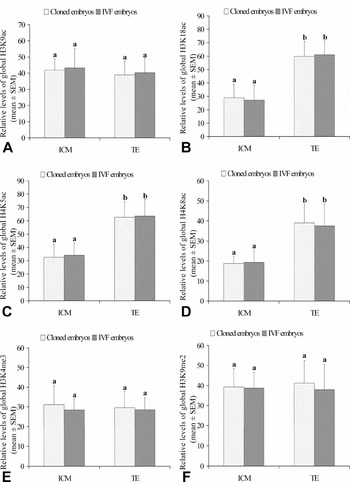
The relative levels of H3K9ac (A), H3K18ac (B), H4K5ac (C), H4K8ac (D), H3K4me3 (E) and H3K9me2 (F) in the ICM and TE cells between IVF and cloned embryos examined by Image-J software, respectively. a/bValues with different superscripts differ significantly.

Further analyses of the fluorescence intensity between the inner cell mass (ICM) and the trophectoderm cells (TE) in both IVF and cloned blastocysts showed that every single signals examined in the present study was homogeneously distribute (Fig. 7).
Discussion
Histone acetylation is an important epigenetic modification. Modifications of lysine residues of core histones have the greatest potential for unfolding chromatin to recruit different transcriptional factors and it is almost invariably associated with activation of gene transcription (Kurdistani et al., Reference Kurdistani, Tavazoie and Grunstein2004; Valls et al., Reference Valls, Sanchez-Molina and Martinez-Balbas2005; Kouzarides, Reference Kouzarides2007). Dynamic changes of deacetylation and re-acetylation during germ cell maturation and embryo development have been reported in mice (Kim et al., Reference Kim, Liu, Tazaki, Nagata and Aoki2003; van der Heijden et al., Reference van der Heijden, Derijck, Ramos, Giele, van der Vlag and de Boer2006). In our study, we examined acetyl-H3K18, K9 and acetyl-H4K5, K8 using immunofluorescence localizations and statistic analysis in cloned and IVF bovine preimplantation embryos. The results showed that high levels of H3K9ac and H3K18ac were observed in 1- and 2-cell IVF embryos. The intensity of the staining, however, decreased significantly at the 8-cell stage and then partially resumed during subsequent developmental stages. Our results of H3K9ac were consistent with the findings of Santos et al. (Reference Santos, Zakhartchenko, Stojkovic, Peters, Jenuwein, Wolf, Reik and Dean2003). H3K9ac and H3K18ac fluorescence signals were more intensive in cloned embryos than IVF embryos from pronuclear to 8-cell stages. Histone acetylation is reported to be regulated by histone acetyltransferases (HATs) and deacetylase (HDAC) (Bertos et al., Reference Bertos, Wang and Yang2001) which are classified into many subfamilies that are mostly conserved from yeast to human (Marmorstein & Roth, Reference Marmorstein and Roth2001). HAT p300 and GCN5 acetylated H3K18 (Schultz et al., Reference Schiltz, Mizzen, Vassilev, Cook, Allis and Nakatani1999) and H3K9, 14, 18 (Grant et al., Reference Grant, Eberharter, John, Cook, Turner and Workman1999), respectively. Real-time quantitative RT-PCR analysis has shown that high levels of GCN5 and p300 transcripts occur in bovine germinal vesicle (GV), metaphase II (MII) oocytes and 2-cell embryos and significantly decreases at the 8-cell stage (McGraw et al., Reference McGraw, Robert, Massicotte and Sirard2003; Vigneault et al., Reference Vigneault, McGraw, Massicotte and Sirard2004). The H3K9ac and H3K18ac staining decrease in the 8-cell IVF embryos in our study therefore might have resulted from the dynamic changes of p300 and GCN5. The increased levels of H3K9ac and H3K18ac in cloned embryos from the zygote to the 8-cell stages may indicate that aberrant histone acetylation occurred before donor genome activation. Valls et al., (Reference Valls, Sanchez-Molina and Martinez-Balbas2005) showed that high levels of histone acetylation were associated with high levels of genomic transcription. It has been suggested that the cloned embryonic genome may experience aberrant transcriptional activity before donor genomic activation. In the advanced stages of embryonic development, particularly at blastocyst stage, IVF and cloned embryos maintained similar levels of histone H3 acetylation and distribution patterns. Our results and the studies of others suggest that cloned embryos undergo wide reprogramming with a histone H3 state similar to that of IVF embryos after donor genome activation.
In mice, H3K9ac, H3K18ac, H4K8ac, H4K5ac and H4K12ac became transiently enriched at the nuclear periphery from the zygote to the 2-cell stages and the distribution patterns correlated with DNA replication and ZGA. But when the zygote genome was activated, the signals were distributed throughout the nucleoplasm in the advanced stage embryos (Worrad et al., Reference Worrad, Turner and Schultz1995; Stein et al., Reference Stein, Worrad, Belyaev, Turner and Schultz1997). In bovine IVF embryos, our data indicate that H3K9ac and H3K18ac staining remained distributed throughout the nucleoplasm and that H4K8ac and H4K5ac was enriched at the nuclear periphery from the 2- to the 8-cell stages of embryonic developement. In mouse and bovine, the major zygotic genome activation occurs from the 2- to 8-cell stage (Brevini et al., Reference Brevini, Cillo, Antonini, Tosetti and Gandolfi2007; Schultz, Reference Schultz1993). The restricted localizations of acetyl-H4K8 and K5 in IVF bovine embryos could very well be associated with ZGA. In the cloned embryos, abnormal localizations of H4K8ac and H4K5ac were found at pronuclei and 2- to 8-cell stage embryos, respectively, when compared with IVF embryos (Figs. 3G–H′ and 4F,F′). High levels of H4K8ac and H4K5ac were observed from the pronuclear to 8-cell stage in cloned embryos. Studies have shown that histone acetylation is important in the process of unfolding chromatin to recruit different transcriptional factors (Valls et al., Reference Valls, Sanchez-Molina and Martinez-Balbas2005; Kouzarides, Reference Kouzarides2007). The acetylation of histone H3 occurs initially at lysine 14 and then at lysine 23, lysine 18 and eventually at lysine 9 (Turner, Reference Turner1991). The histone H4 is acetylated in order at lysine 16, lysine 8 or 12 and lysine 5 (O'Neill & Turner, Reference O'Neill and Turner1995). These data imply that acetylation at H3K9 and H4K5 corresponds to a hyperacetylation state (Mizzen & Allis, Reference Mizzen and Allis1998; Turner, Reference Turner1998) and high levels of histone acetylation are associated with activation of gene transcription (Kurdistani et al., Reference Kurdistani, Tavazoie and Grunstein2004). The abnormal high levels of histone acetylation and localizations in cloned embryo nucleoplasm suggest that more active gene transcription occurred in cloned embryos than IVF embryos. As cloned embryos developed to morula and blastocyst stages, distribution patterns and fluorescent intensity of histone H4 were comparable with IVF embryos.
Histone methylation is another important histone modification in the regulation of chromatin remodelling and gene expression (Martin & Zhang, Reference Martin and Zhang2005). H3K4me3 is an indicator of gene transcript activation, while H3K9me2 is associated with heterochromatin where non-gene expression occurs (Noma et al., Reference Noma, Allis and Grewal2001; Santos-Rosa et al., Reference Santos-Rosa, Schneider, Bannister, Sherriff, Bernstein, Emre, Schreiber, Mellor and Kouzarides2002). In this study, we examined dynamic changes of H3K4me3 and H3K9me2 in cloned and IVF embryos at different developmental stages. Detectable H3K4me3 staining was observed in 1- and 2-cell IVF embryos; the signal significantly decreased or disappeared when the embryo developed to 8-cell stage; and then the fluorescent signals resumed at the morula and blastocyst stages (Fig. 5A–E′,K). These dynamic changes were very similar to those observed for H3K9ac (Fig. 1A–E′,K). In the somatic cell, Yan et al., suggested that a permissive chromatin region for transgene expression was enriched in H3K4me3 and acetyl-H3K9/K14, while a non-permissive region was poor in or depleted of these two histone modifications (Yan & Boyd, Reference Yan and Boyd2006). In mice and human genome, H3K4me2 and H3K4me3 localizations were closely correlative with acetylated histone H3 (Bernstein et al., Reference Bernstein, Kamal, Lindblad-Toh, Bekiranov, Bailey, Huebert, McMahon, Karlsson, Kulbokas, Gingeras, Schreiber and Lander2005). The present study showed that the dynamic change of H3K4me3 was coincidental with acetylated histone H3 during IVF embryo development (Figs. 1 and 5), which was similar to the results in somatic cells (Bernstein et al., Reference Bernstein, Kamal, Lindblad-Toh, Bekiranov, Bailey, Huebert, McMahon, Karlsson, Kulbokas, Gingeras, Schreiber and Lander2005; Yan & Boyd, Reference Yan and Boyd2006). The relationship between H3K4me3 and histone H3 acetylation in the somatic cell may also be similar during embryo development. Upon comparing with IVF embryos, the H3K4me3 intensity and histone H3 acetylation significantly increased in cloned embryos from the pronuclear to 8-cell stages, while there were no differences beyond the 8-cell stage between IVF and cloned embryos (Figs. 1, 2 and 5). The trimethyl-K4 site in histone H3 is located at 5′ end of active genes and its enrichment in the genome indicates that the genome is experiencing high transcriptional activity (Bernstein et al., Reference Bernstein, Kamal, Lindblad-Toh, Bekiranov, Bailey, Huebert, McMahon, Karlsson, Kulbokas, Gingeras, Schreiber and Lander2005). The results of this study suggest that aberrant high transcript activation of the genome may be occurring before the donor genome is activated.
Low levels of H3K9me2 signal were observed in 1- and 2-cell IVF embryos and then increased significantly from the 8-cell to the blastocyst stages of development (Fig. 6A–E′,K). In cloned embryos, however, the H3K9me2 staining showed high levels in all stages examined (Fig. 6F–J′). Our findings are consistent with the report by Santos et al., (Santos et al., Reference Santos, Zakhartchenko, Stojkovic, Peters, Jenuwein, Wolf, Reik and Dean2003). In mouse, methylated histone H3 is closely associated with genome DNA methylation (Arney et al., Reference Arney, Bao, Bannister, Kouzarides and Surani2002). In normal bovine embryos, DNA methylation is characteristically reduced between the 2- and 4-cell stages, with de novo methylation occurring after the 8-cell stage. The distribution and intensity pattern of H3K9 methylation closely parallels DNA methylation (Santos et al., Reference Santos, Zakhartchenko, Stojkovic, Peters, Jenuwein, Wolf, Reik and Dean2003). However, embryos reconstructed with differentiated somatic cells stain more intensely for DNA methylation at all stages than controls (Dean et al., Reference Dean, Santos, Stojkovic, Zakhartchenko, Walter, Wolf and Reik2001). The high levels of H3K9me2 in cloned embryos most likely indicate an abnormal condition where aberrant genome DNA methylation has occurred. When embryos developed to and beyond the 8-cell stage, the same phenomena occurred in other histone modification sites. The H3K9me2 staining in cloned embryos was similar to that in IVF embryos
At the blastocyst stage, a similar distribution and dynamic pattern of histone methylation and acetylation was observed between IVF and cloned. However, the levels of H3K18ac, H4K5ac and H4K8ac were higher in TE than in ICM. Similarly, less intensity of histone acetylation was observed in the ICM of in vivo and IVF blastocysts in mice (Huang et al., Reference Huang, Lei, Shi, Miao, Yang, Ouyang, Sun and Chen2007), which may have resulted from higher levels of DNA methylation in ICM than that in TE (Santos et al., Reference Santos, Hendrich, Reik and Dean2002). As occurs in the mouse, a similar distribution pattern of DNA methylation was reported in sheep (Beaujean et al., Reference Beaujean, Hartshorne, Cavilla, Taylor, Gardner, Wilmut, Meehan and Young2004) and pig (Fulka et al., Reference Fulka, Fulka, Slavik, Okada and Fulka2006). A completely opposite situation was described in human (Fulka et al., Reference Fulka, Mrazek, Tepla and Fulka2004) and more recently in monkey blastocysts (Yang et al., Reference Yang, Yang, Beaujean, Niu, He, Xie, Tang, Wang, Zhou and Ji2007). In bovine, however, equally high levels of DNA methylation were detected in these two lineages (Santos & Dean, Reference Santos and Dean2004). The similarity in staining patterns of histone acetylation in bovine and mouse blastocysts may not be related to DNA methylation. The H3K9ac, H3K4me3 and H3K9me2 modification sites had no difference in staining between ICM and TE in both IVF and cloned embryos. In somatic cells, H3K9ac was closely correlative with H3K4me3 in activated genes (Bernstein et al., Reference Bernstein, Kamal, Lindblad-Toh, Bekiranov, Bailey, Huebert, McMahon, Karlsson, Kulbokas, Gingeras, Schreiber and Lander2005) and H3K9ac took part in H3K9me2 modification by HDAC and other histone methyltransferase (Santos et al., Reference Santos, Peters, Otte, Reik and Dean2005).
In rabbit, aberrant distribution patterns of histone acetylation modification were found in cloned rabbit blastocysts (Shi et al., Reference Shi, Ai, Ouyang, Huang, Lei, Wang, Yin, Han, Sun and Chen2008). Many studies suggest that gene expression and regulation of donor cells in cloned embryos are associated with the source of oocytes (Liu et al., Reference Liu, Mal, Miao, Liu, Bao and Tan2005), timing of in vitro maturation (Holker et al., Reference Holker, Petersen, Hassel, Kues, Lemme, Lucas-Hahn and Niemann2005), in vitro culture conditions (Pereira et al., Reference Pereira, Dode and Rumpf2005) and cloning protocols (Wrenzycki et al., Reference Wrenzycki, Wells, Herrmann, Miller, Oliver, Tervit and Niemann2001). We found no aberrant histone modifications in cloned bovine blastocysts in the present study. This may be due in part to the source of oocytes, treatments during cloning preparation and/or the in vitro culture systems.
In conclusion, abnormal distribution and high levels of histone acetylation and methylation were located with chromosomes before donor genomic activation in cloned embryos. After the donor genome was activated, both IVF and cloned embryos had homologous distribution and intensity patterns of histone modifications from the morula to the blastocyst stages of development. The cloned bovine embryos underwent wide reprogramming with histone modifications similar to that of IVF embryos in our research system. Localization of histone acetylation in the nucleoplasm may very well be associated with bovine ZGA.
Acknowledgements
We sincerely thank Drs Kenneth L. White and Thomas D. Bunch of the Department of Animal, Dairy and Veterinary Sciences, Utah State University, USA for their critical reading and edition for this article. This work was supported by a Specialized Research Fund for the Doctoral Program of Higher Education from Chinese Ministry of Education (No. 20050126005), a grant from the Inner Mongolia Natural Science Foundation of China (No. 200508010403), a grant from NSFC (No. 30860185) to HY and the Hi-Tech Research and Development Program of China (863 Program, No. 2007AA100505 and 2008AA10Z159) to GPL and grant from Inner Mongolia University, Hohhot, China.