1 INTRODUCCIÓN
Los procesos de transición energética contribuyen a comprender aristas relevantes del desarrollo económico y social, dado que permiten incorporar al análisis histórico información sobre la dinámica del cambio en las fuentes de energía, el origen de la misma y su uso.
El estudio de las transiciones energéticas en Uruguay no tiene una gran tradición en la producción historiográfica y, por lo tanto, es importante destacar el carácter pionero —aunque inconcluso—del trabajo Energía y política en el Uruguay del siglo XX, de Labraga et al. (Reference Labraga, Núñez, Rodríguez and Ruiz1991), cuyo único tomo se subtituló «Del carbón al petróleo», centrado en el período 1900-1930.
Existen estudios referidos a períodos específicos de la historia energética del paísFootnote 1 y algún diagnóstico sobre la evolución de la matriz energética en las últimas décadasFootnote 2, pero la dinámica de la transición energética en el largo plazo y su relación con el desarrollo solo han sido objeto de estudio en los últimos años a partir de los esfuerzos realizados en el seno de la Historia EconómicaFootnote 3. En otras investigaciones, el objeto fue la transición de las energías orgánicas a las fósiles, mientras que el presente artículo se focaliza en el comportamiento del consumo de carbón como insumo para la producción de otras formas de energía y en su utilización como energía final por algunas actividades económicas; así como en los factores explicativos de las decisiones sobre las fuentes energéticas que hay que utilizar.
El primer paso para cumplir con este objetivo requería contar con una serie histórica de consumo de carbón mineral. La inexistencia de información estadística anterior a la década de 1930 obligó a utilizar fuentes indirectas. La estimación del consumo aparente de carbón (producción más el neto del comercio exterior) aparecía como una alternativa. En Folchi y Rubio (Reference Folchi and Rubio2008) y Rubio et al. (Reference Rubio, Yáñez, Folchi and Carreras2010) se ha aplicado esta metodología en la reconstrucción de series para América Latina a partir de las estadísticas de comercio de los países proveedores. En el caso de Uruguay, este procedimiento presenta deficiencias porque no discrimina el carbón destinado al abastecimiento de los buques en el registro de las importaciones, especialmente entre fines del siglo XIX y las primeras décadas del siglo XX, fenómeno de magnitud considerable en una economía pequeña. Este trabajo procura sortear estas limitaciones combinando el uso de fuentes nacionales con estadísticas de comercio exterior de los principales proveedores. El resultado es una serie de consumo de carbón mineral desde 1879 hasta el presente.
El análisis del auge y ocaso del carbón mineral como fuente energética en Uruguay aporta información para entender sus orígenes como alternativa a la leña y su desplazamiento por la fuerza arrolladora del petróleo. En tal sentido, complementa esfuerzos anteriores que encararon, en términos generales, la transición desde la energía orgánica a la fósilFootnote 4. Los resultados que se presentan en este artículo permiten discutir la dinámica de la transición del carbón al petróleo en Uruguay, sus determinantes y sus especificidades en el contexto regional y en contraste con los comportamientos europeo y norteamericanoFootnote 5.
Luego de esta introducción, en el apartado 2, se presenta de manera sintética la transición energética como categoría analítica y su aplicación al caso uruguayo. Las decisiones metodológicas tomadas para construir una serie de consumo de carbón mineral para el período 1879-2011 se presentan en el apartado 3. En el apartado 4,se analiza el comportamiento del consumo agregado del carbón y se describe el proceso de transición que llevó del auge al ocaso de este energético. En el apartado 5, se buscan explicaciones a tal comportamiento a partir de su transformación como fuente primaria para la producción de otras formas de energía (gas, electricidad) y de su utilización directa por la industria manufacturera y el ferrocarril. El apartado 6 introduce tres condicionantes que impulsaron a tomar decisiones sobre las fuentes energéticas que se debían utilizar: alteraciones en los precios relativos y el costo de los fletes, innovaciones tecnológicas y factores institucionales. Las conclusiones se ordenan en el apartado 7. Finalmente, en el apartado 8, se presentan las fuentes consultadas. Las referencias se incluyen en el apartado 9. El artículo incluye, además, un apéndice con las series históricas de carbón estimadas.
2 LAS TRANSICIONES ENERGÉTICAS
Los procesos de transición energética han constituido un factor crucial del «crecimiento económico moderno». La característica fundamental radica en la sustitución de portadores tradicionales —base energética orgánica— por portadores modernos —base energética fósil—, que al tiempo de permitir formas de uso más flexibles y eficientes, acompañan e inducen transformaciones en la estructura económica, en las formas de vida de las sociedades humanas y en el medioambiente.
Dos tendencias dominantes en la evolución de largo plazo son: a) un incremento en el uso de la energía y b) un cambio en la estructura del consumoFootnote 6. Aunque estos procesos se observan a escala global, es posible identificar distintos ritmos en la medida en que las necesidades energéticas constituyen una demanda derivada y, por ende, responde al nivel de desarrollo de las comunidades. La literatura resalta que existe una estrecha asociación entre el crecimiento económico y la demanda de energía, al mismo tiempo que enfatiza que no se trata de una relación linealFootnote 7. Por ello, es importante indagar en las especificidades que adopta la transición energética.
En Uruguay, la transición energética tiene la particularidad de haber sido un proceso de sustitución de fuentes orgánicas autóctonas por fuentes de energía fósiles foráneas (ya que no posee yacimientos de carbón, petróleo y gas), lo que dio lugar a crecientes niveles de dependencia energética. La demanda de combustibles fósiles ha estado condicionada por fuerzas originadas en la dinámica productiva, el proceso de urbanización y las transformaciones en los hábitos de consumo.
El proceso de cambio estructural y las características que adoptó la inserción internacional de la economía promovieron cambios en el uso de la energía. La internalización de innovaciones de carácter genérico, tales como el transporte ferroviario, la mecanización de las actividades manufactureras y el sistema técnico asociado a la electricidad, estimularon la demanda de energía fósil.
Uruguay asistió a un temprano y acelerado proceso de urbanización; esto desvinculó a un número creciente de la población de las fuentes de provisión energética tradicionales (leña, especialmente) y aproximó a estos sujetos a artefactos modernos que demandaban formas también modernas de energía (cocinas, estufas, calefactores, refrigeradores, transporte automotor, etc.) y a nuevos hábitos de consumo energético.
La transición energética, aunque se inicia en las postrimerías del siglo XIX, es un fenómeno típico del siglo XX. Una vez iniciado el proceso, su ritmo y la forma en que se procesó el pasaje del carbón al petróleo se vio condicionado por los fenómenos descritos más arriba, pero también por factores que provenían del exterior, especialmente los problemas de abastecimiento durante los conflictos bélicos, los movimientos en los precios relativos de los energéticos y los cambios de hegemonía a escala global.
3 CONSTRUCCIÓN DE UNA SERIE DE CONSUMO DE CARBÓN EN EL URUGUAY: UN «ROMPECABEZAS»
Construir una serie continua de consumo de carbón desde sus orígenes supuso enfrentarse a un conjunto de dificultades estadísticas y recurrir a diversas fuentes de información.
La inexistencia de series oficiales de consumo para el período anterior a 1965 constituye una primera dificultad. Entonces, se utilizó el cálculo realizado por Oxman (Reference Oxman1961) para cubrir hasta 1937 y las estimaciones para el período anterior se llevaron a cabo a partir de las cifras de comercio exterior de carbón mineral que implicaron, a su vez, nuevos retos.
3.1 OFERTA BRUTA DE CARBÓN (1965-2011)
En 1965 comienza a elaborarse el Balance Energético Nacional (Dirección Nacional de Energía, DNE), que brinda información de la oferta bruta por fuente de energía primaria. Estas cifras son las que se utilizaron hasta el último año disponible: 2011.
3.2 Consumo bruto de carbón (1937-1965)
Desde 1937 hasta 1960 se recurre a Oxman (Reference Oxman1961), que presenta una estimación del consumo bruto de carbón tomando como referencia datos de la Administración Nacional de Combustibles, Alcohol y Portland (ANCAP) y de la Comisión Económica para América Latina (CEPAL). Estas cifras incluirían la variación de existenciasFootnote 8.
Para los cuatro años en que no se cuenta con datos de consumo, 1961-1964, se llevó a cabo la estimación del mismo aplicando la tasa de variación de las importaciones de carbón —tomado de los Anuarios Estadísticos— al valor de 1960.
3.3 Consumo aparente de carbón (1879-1937)
Para el período previo a 1937, se estimó el consumo aparente de carbón considerándolo como consumo doméstico. Esta metodología es de recibo en la literatura y, en particular, para el estudio de los procesos de transición energética en América LatinaFootnote 9.
Uruguay, al no disponer de yacimientos de carbón mineral, siempre ha debido recurrir a su importación, y las estadísticas de comercio exterior se convierten en fuente de información imprescindible. No obstante, las cifras presentan dificultades para aproximarse al consumo doméstico porque se registraban como importaciones partidas de carbón utilizado para abastecer a los buques del puerto de Montevideo y que, por lo tanto, no podía considerarse parte de la oferta energética. Este artículo plantea una propuesta para resolver ese problema apoyándose en el contraste de los registros de las importaciones uruguayas de carbón (publicadas en los anuarios estadísticos) y de su contracara, es decir, las exportaciones desde los principales socios comerciales (disponibles en los anuarios de comercio exterior de estos países).
Los primeros registros que aparecen en los anuarios estadísticos comprenden importaciones desde 1879. Si bien, para años anteriores, existen cifras de comercio de carbón, se ha privilegiado la homogeneidad de las fuentes antes que prolongar la serie unos pocos añosFootnote 10. Por otra parte, los niveles de importación adquirieron una dimensión importante, hacia finales de la década de 1870, y el foco de este estudio está más orientado a lo que sucedió a principios del siglo XX, con la dinámica de la transición del carbón al petróleoFootnote 11.
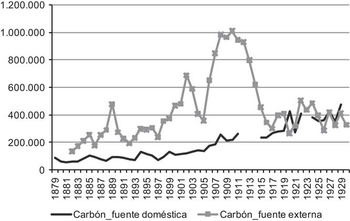
El carbón mineral del Reino Unido, que hasta la primera guerra mundial fue el principal abastecedor, representó más del 90 % de todo el que llegaba al puerto de Montevideo (el restante provenía, principalmente, de Estados Unidos y de reexportaciones de Argentina). La comparación entre la fuente doméstica y la externa permitió capturar la magnitud del carbón mineral que llegaba al puerto para abastecer a los buques y que, por tanto, no constituía consumo doméstico, pero que es difícil discriminar en los registros estadísticos nacionales.
La diferencia entre lo que era para consumo interno y lo arribado al puerto tenía como objetivo el reabastecimiento de los buques (denominado, por las estadísticas, «carbón de trasbordo» o «carbón para bunkering»), o el reembarco hacia otras regiones como Argentina, Paraguay o la frontera con Río GrandeFootnote 12. Montevideo no solo fue durante décadas la entrada a la región rioplatense, sino la escala preferida de muchas líneas, lo que la convirtió en una de las estaciones carboneras más importantes de América del Sur.
Ante tal problemática, es pertinente comparar las importaciones de carbón mineral desde el Reino Unido (fuentes domésticas) con las cifras de exportaciones de carbón mineral hacia Uruguay que surgen de los anuarios de comercio exterior del Reino Unido (fuentes externas), a los efectos de estimar el consumo aparenteFootnote 13. En el Gráfico 1 están representadas ambas series y ahí se observa una brecha significativa hasta 1916. Esto se explica por el carbón que salía del Reino Unido con destino a Montevideo —y, por tanto, figura en los anuarios estadísticos británicos—cuya finalidad era abastecer los buques del puerto. Las estadísticas nacionales consideraban ese carbón «en tránsito» y solo se registraba el destinado al consumo doméstico, en la medida en que era el único que estaba gravado por aranceles aduaneros.
EFECTO BUNKERING: COMERCIO DE CARBÓN EN TONELADAS, 1879-1930
Fuentes: Carbón serie fuente doméstica: DGE: anuarios estadísticos; Carbón serie fuente externa: Statistical Office of the Customs and Excise Department.

Hasta 1916, el carbón importado con destino al consumo interno pagaba, por concepto de derecho de aduana, un 6 % por tonelada, mientras que el «carbón que no se destinara para consumo interno estaba exento» (cabe interpretar que este es carbón para buques y, quizás, reexportación). En 1916 se modifica el régimen y el carbón importado queda exento de todo derecho de aduana o impuestos adicionales y el carbón que se moviliza en el puerto pasa a pagar derecho portuarioFootnote 14.
Por tanto, el carbón que no tenía por destino el consumo interno pasó a pagar, desde 1916, 0,20 pesos por tonelada. En la medida en que todo el carbón estaba gravado con el mismo derecho portuario, los anuarios estadísticos no discriminan en sus registros—desde entonces— las cantidades de carbón destinado al consumo doméstico de aquel que es para provisión de los buques.
Las dificultades emergentes de este cambio en la registración obligaron a asumir supuestos para estimar el consumo doméstico de carbón a partir de las importaciones. Se ha manejado la siguiente hipótesis: antes de 1916, se considera que únicamente el carbón para consumo interno pagaba derecho de aduana, mientras que el destinado a los buques estaba exento; a partir de dicho año, se elimina el pago del derecho de aduana al carbón para consumo interno, y se establece el pago del derecho portuario para todo el carbón, sea para consumo interno o para los buques. De esta manera, desde 1879 hasta 1915, las cifras de carbón mineral para consumo interno pueden obtenerse directamente de las importaciones registradas, entendiendo que solo se registraba el carbón que pagaba algún tipo de derecho aduanero.
A partir de 1916, es lógico pensar que la Dirección General de Estadísticas (DGE) comienza a registrar el total de importación de carbón mineral sin discriminar su fin. Esto genera una dificultad para la estimación que permanece hasta 1927, cuando comienzan a registrarse en los anuarios estadísticos cifras correspondientes al concepto «exportaciones de carbón» y, a partir de 1934, se especifica un rubro denominado «exportación de carbón para buques». De esta manera, para el período posterior a 1927 es posible obtener el consumo aparente de carbón con solo restar las exportaciones de carbón del total de importaciones.
Queda explicar cómo se estimó el consumo aparente entre 1916 y 1926. Los anuarios, entre 1905 y 1941, contienen cifras de la carga efectiva de carbón mineral en el puerto, que representaría el total de carbón arribado a Montevideo, sea para consumo interno o para aprovisionamiento de los buques. Si se toma el año 1915, previo a la modificación del régimen fiscal descrito, sería posible aproximarse al porcentaje de carbón mineral destinado a consumo interno, calculando la participación de las importaciones sobre el total de carga efectiva de carbón en el puerto. De lo cual resulta que el 59 % del total de carbón que llegaba a Montevideo era para uso interno, mientras que el 41 % se destinaba al abastecimiento de buques. Por otra parte, en 1927 —que, como se dijo, es posible aproximarse al consumo aparente—, el porcentaje destinado al consumo interno asciende al 74 %, es decir, disminuye la parte de carbón mineral para abastecer buques. Este fenómeno es coherente con dos procesos simultáneos que experimentaba el país: la sustitución del carbón mineral por el petróleo y la disminución de la importancia del puerto de Montevideo como abastecedor de las flotas del Atlántico sur.
Entonces, tomando la evolución de la carga efectiva de carbón en el puerto, y considerando una disminución lineal del porcentaje de carbón destinado al abastecimiento de buques que contempla la sustitución del carbón por el petróleo entre 1915 y 1927, se estimó el consumo aparente de carbón para dicho período. Este mismo criterio se utilizó para estimar el consumo durante los años de la primera guerra (1912-1914), en los que no fue posible ubicar los datos de importación en los anuarios estadísticos.
3.4 Empalme y homogeneización de los datos
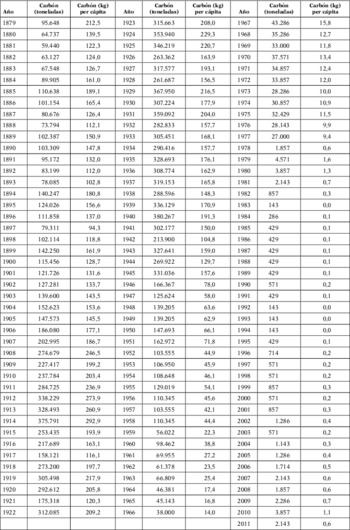
En la fase final de construcción de la serie histórica de consumo de carbón como energía primaria, se empalmaron todas las series, desde el presente hasta el origen. A partir de las cifras de la oferta bruta de carbón del Balance Energético Nacional, se ha extrapolado hacia atrás con la tasas de variación del consumo bruto de Oxman (Reference Oxman1961) y con la serie de consumo aparente de energía estimada. De esta manera, se asume que la variación de existencias, para la que no se dispone de información antes de 1937, presentó un comportamiento similar al del consumo. El resultado final de la serie histórica entre 1879 y 2011 se presenta en el apéndice (Cuadro A1).
4 URUGUAY: EL CICLO DEL CARBÓN Y LA TRANSICIÓN FÓSIL
La serie obtenida se analiza a continuación con el doble objetivo de describir el comportamiento del consumo agregado del carbón en Uruguay en el largo plazo y discutir el proceso en el contexto latinoamericano.
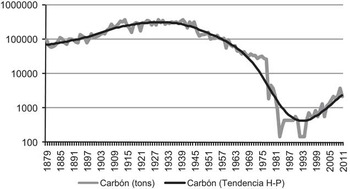
En el Gráfico 2 se observa la evolución del consumo en toneladas y su tendencia (extrayendo el componente cíclico de la serie), donde se identifica claramente un ciclo completo en el consumo de carbón mineral en Uruguay a lo largo de cien años y su virtual abandono en las últimas tres décadas del siglo XXFootnote 15.
CONSUMO DE CARBÓN (EN TONELADAS): SERIE ORIGINAL Y TENDENCIA (ESCALA LOGARÍTMICA), 1879-2011
Fuente: apéndice, Cuadro A-1. Nota: la tendencia de la serie se estimó aplicando el filtro de Hodrick-Prescott.

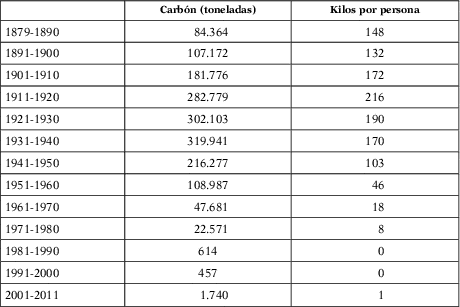
En los primeros veinte años, se constata un comportamiento fluctuante del consumo de carbón, en torno a las cien mil toneladas anuales, con una leve tendencia al alza. Desde comienzos del siglo XX se observa un extraordinario incremento, del que resulta una triplicación del consumo en vísperas de la primera guerra mundial. Al realizar un análisis por décadas, se observa que el consumo promedio de carbón se incrementó un 70 % entre la última década del siglo XIX y la primera del siglo XX, y vuelve a crecer un 56 % en la segunda década. Con posterioridad, se aprecian aumentos de menor magnitud: un 7 % y un 6 %, respectivamente, para los años veinte y treinta. La historia del carbón en Uruguay iniciaba su declive. Así lo refleja, también, la evolución del consumo per cápita, que ya en la década de 1920 comenzó su descenso (Cuadro 1).
CONSUMO DE CARBÓN, TOTAL Y POR PERSONA, EN TONELADAS. PROMEDIOS CADA 10 AÑOS (CON EXCEPCIÓN DE 1879-1890 Y 2001-2011)
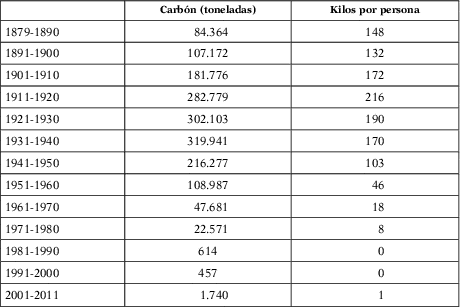
Fuente: apéndice, Cuadro A-1.
En los treinta años siguientes a la primera guerra mundial, el carbón satisfizo los requerimientos energéticos derivados de algunos sectores de demanda rígida (como fue el caso de la Compañía del Gas y de algunas maquinarias en el sector transporte y manufacturero) manteniendo, en términos absolutos, el nivel de consumo alcanzado. No obstante, estos años se caracterizaron por fuertes fluctuaciones derivadas de las guerras, crisis y depresiones a escala global.
Al finalizar la segunda guerra mundial, se produce una caída que retrotrae el nivel a cifras similares a las de principios del siglo y, desde entonces, se asiste a su paulatino abandono como energético hasta llegar a un último escalón negativo al final de la década de 1970, cuando la Compañía del Gas dejó de usarlo como insumo (estos procesos se analizarán con detalle en el apartado 5).
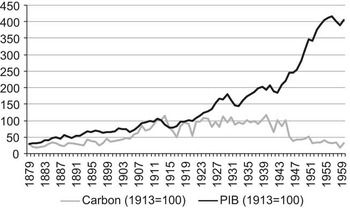
Cuando se compara la evolución del carbón con la dinámica del proceso económico que refleja el comportamiento del producto interno bruto (PIB), se puede señalar que hasta mediados de la segunda década del siglo XX habría existido una fuerte asociación entre el crecimiento del PIB y el consumo de carbón (Gráfico 3). Luego de una década de problemas de abastecimiento que parecen manifestarse en una desvinculación del movimiento de ambas series (1915-1923), la dinámica de crecimiento que se aprecia a nivel agregado de la economía ya no tiene correlación con el carbón. Este fenómeno se hace evidente tras la segunda guerra mundial, recorriendo ambas series derroteros opuestos. Ambas variables presentan una alta correlación (por encima del 80 %) hasta los inicios de la década de 1940, y, a partir de entonces, la dinámica entre ellas se torna negativaFootnote 16.
CONSUMO DE CARBÓN Y PIB REAL (ÍNDICE DE 1913 = 100), 1879-1960 (IZQUIERDA)
Fuentes: apéndice, Cuadro A-1. PIB de Bonino et al. (Reference Bonino, Román and Willebald2012) en base a Bértola et al. (Reference Bértola, Calicchio, Camou and Rivero1998), Bertino y Tajam (1999), Banco de la República Oriental del Uruguay y Banco Central del Uruguay. Nota: La tendencia de la serie se estimó aplicando el filtro de Hodrick-Prescott.

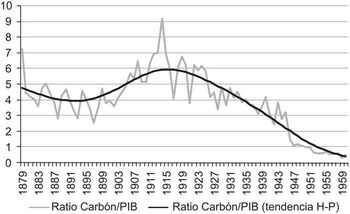
No parecería arriesgado señalar que la «era del carbón» en Uruguay, en lo que respecta a su aporte como energético asociado al crecimiento económico, debería ubicarse en las primeras décadas del siglo XX. La energía necesaria para los procesos de valorización se aportaría crecientemente, después de la primera guerra mundial, por otros portadores. De ahí la caída de la intensidad carbonífera que se aprecia en el Gráfico 4. El análisis de la dinámica de los sectores intensivos en el consumo de carbón aportará evidencia para dar robustez a esta premisa.
RATIO CARBÓN (KG) / PIB (MILES DE PESOS DE 2005). SERIE Y TENDENCIA, 1879-1960 (DERECHA)
Fuentes: apéndice, Cuadro A-1. PIB de Bonino et al. (Reference Bonino, Román and Willebald2012) en base a Bértola et al. (Reference Bértola, Calicchio, Camou and Rivero1998), Bertino y Tajam (1999), Banco de la República Oriental del Uruguay y Banco Central del Uruguay. Nota: La tendencia de la serie se estimó aplicando el filtro de Hodrick-Prescott.

La literatura, como se ha señalado, insiste en la sustitución del carbón por el petróleo como fenómeno típico de la transición en las sociedades en las que se asiste a la imposición de la energía moderna.
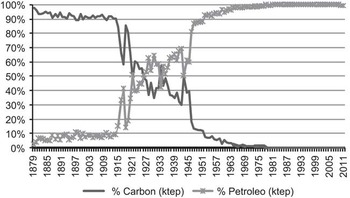
En el caso de Uruguay, resulta evidente la presencia de este proceso entre 1915 y 1950, cuando se invierte la participación de ambos energéticos (Gráfico 5). El momento clave debe ubicarse a mediados de la década de 1920; no obstante, este proceso de transición no es lineal. Podría interpretarse que, tras el primer síntoma de sustitución, durante la primera guerra mundial, la competencia entre estos dos energéticos solo se dio en algunos ámbitos, y que el avance del petróleo se explica como resultado del surgimiento de nuevas actividades más que por la sustitución del carbón en las ya existentes (el caso paradigmático sería el del transporte automotor). Luego, entre 1930 y 1945, se asiste a un período de estancamiento en las participaciones relativas del carbón y el petróleo; y justo después de la segunda guerra mundial, el petróleo domina la estructura al caer abruptamente el consumo de carbón.
TRANSICIÓN ENERGÉTICA: EL «MODELO URUGUAYO», 1879-2011 (PORCENTAJES)
Fuentes: apéndice Cuadro A-1. Serie de petróleo 1879-1882: exportaciones de petróleo desde el Reino Unido a Uruguay (Statitsical Office of the Customs and Excise Department); serie 1882-1965: Bertoni y Román (2008); serie 1965-2011: balance energético (DNE). Nota: series en toneladas equivalentes de petróleo (TEP) utilizando la conversión 1 TEP = 1,43 t de carbón.

¿Cómo se ubica la dinámica de la transición del carbón al petróleo en el Uruguay, en comparación con este proceso en otras sociedades?
Diversos trabajos han descrito las características de esta transiciónFootnote 17 y resaltan la existencia de dos modelos básicos: el de Estados Unidos y el de Europa occidental. El primero se caracterizaría por un temprano abandono del carbón (durante la primera mitad del siglo XX) y el segundo por la permanencia de este energético como portador dominante hasta la década de 1960. En cualquier caso, estos modelos muestran un comportamiento inercial muy importante que lleva a que, una vez iniciada la transición, esta se complete sin retrocesos o «demoras».
Los estudios sobre la transición energética en países en desarrollo cuestionan que estos procesos puedan caracterizarse a partir de dichos modelos. Para América Latina, Folchi y Rubio (Reference Folchi and Rubio2006) analizan el fenómeno de la transición en las energías fósiles y encuentran que la región no siguió ninguno de los dos patrones clásicos y que presenta diversas trayectorias. Se plantea que el fenómeno es más temprano y mucho más oscilante en los casos latinoamericanos que en Europa y Estados Unidos. Además, la velocidad con la cual se da este proceso es muy variable en la región, y en Rubio y Folchi (Reference Rubio and Folchi2012, p. 54) se identifican cuatro modelos de transición. El «modelo uruguayo» sería similar al detectado en Chile y Colombia, y se caracterizaría por ciclos de retroceso y recuperación del carbón, sin que se imponga con claridad la supremacía del petróleo hasta muchos años después de iniciada la transición.
La dinámica del carbón, a partir del trabajo empírico propuesto en este artículo, confirmaría esa peculiaridad del modelo uruguayo que identificaron Folchi y Rubio a partir del uso de otras fuentes. Una caída de la participación del carbón en la matriz energética durante la primera posguerra (del orden del 50 %) fue seguida de veinte años de fluctuaciones, hasta la segunda guerra mundial. Y solo a partir de entonces se completa la transición al petróleo (Gráfico 5).
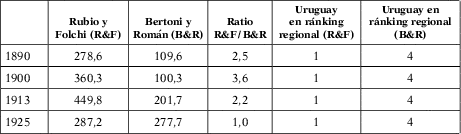
No obstante, la nueva serie construida ofrece información relevante que corrige de manera sustantiva los niveles de consumo manejados por Rubio y Folchi (Reference Rubio and Folchi2012)Footnote 18. Al tener en cuenta el efecto bunkering (Gráfico 1), el consumo per cápita de carbón de Uruguay se reduce dramáticamente y, aunque el país no abandona su lugar entre los cuatro mayores consumidores de energía moderna en la región, con la nueva información pasaría del primero al cuarto puesto en el ránking elaborado por dichos autores (Cuadro 2).
URUGUAY: CONSUMO DE ENERGÍA MODERNA PER CÁPITA (TEP CADA 1.000 HABITANTES)
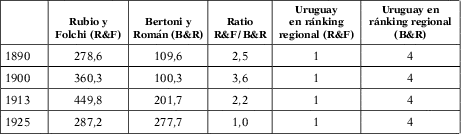
Fuentes: Rubio y Folchi (Reference Rubio and Folchi2012), Bertoni y Román (Reference Bertoni and Román2008) y Cuadro A-1 del apéndice.
Teniendo en cuenta que el consumo de energía moderna se utiliza en algunos trabajos como indicador de modernización económicaFootnote 19, esta corrección no es trivial y constituye un aporte a la mejor comprensión del grado de modernización de la economía uruguaya.
5 BUSCANDO PISTAS. LOS SECTORES INTENSIVOS EN EL CONSUMO DE CARBÓN
Para contribuir a explicar la dinámica del carbón y la transición al petróleo, en este apartado se aporta un panorama de los usos del carbón, cuantificando el consumo por sectores económicos identificados como «grandes consumidores» de este energético.
Dado que el uso que hicieron los hogares del carbón fue absolutamente marginal en el país, la estrategia consistió en concentrarse en analizar la evolución del uso del carbón para la producción de otras formas de energía secundaria (gas y electricidad) y su aporte como insumo en la actividad de la industria y el ferrocarril.
La información disponible ha permitido reconstruir parcialmente el consumo en estos cuatro sectores. Para dimensionar su representatividad como consumidores de carbón, se estimaron las toneladas requeridas por cada uno en el período 1908-1911 y se comparó el resultado con el consumo agregado promedio anual de esos cuatro años (Cuadro 3).
CONSUMO DE CARBÓN MINERAL TOTAL Y DE LOS PRINCIPALES SECTORES, 1908-1911

Fuente: véase el apartado 5.
En el caso de la industria, se realizó una estimación mediante la combinación de información de los censos industriales de 1908 y 1936 para la construcción, las actividades manufactureras y la industria extractivaFootnote 20. El cálculo se realizó a partir de la capacidad instalada de la industria, suponiendo que si en 1936 la potencia instalada de vapor (9.049 hp) requería como insumo 64.412 t de carbón, en 1908 los 16.750 hp instalados habrían requerido 119.222 tFootnote 21.
El consumo de carbón para generación eléctrica en 1910 se obtuvo de los anuarios estadísticos. En cuanto al consumo para la producción de gas, se partió de las cifras de consumo de carbón para 1933 (anuarios estadísticos) y del total de metros cúbicos de gas producidos anualmente entre 1911 y 1930Footnote 22, se supuso que la cantidad de carbón consumida en 1933 no habría tenido cambios sustantivos respecto a la de 1930 y, asumiendo el mismo coeficiente técnico, se consideró plausible que hacia 1911 el consumo se situara en 16.031 t anuales (véase el subapartado 5.2).
Finalmente, para dimensionar la importancia de los ferrocarriles, se recurrió al consumo requerido para el funcionamiento de las locomotoras de una de las compañías ferroviarias, The Central Uruguay Railway Company, a partir de la información que reportan las memorias. Esta empresa era la más importante del país y, hacia 1913, controlaba el 60 % de las vías férreasFootnote 23.
Como resumen, hacia 1908-1911, el uso de carbón mineral por estos cuatro sectores habría representado el 84 % del consumo total. El principal sector consumidor era la industria (52 %), seguido del transporte ferroviario (19 %), mientras que el carbón para la producción de gas y de electricidad representaba el 12 % del total (Cuadro 3).
Las dificultades para obtener información cuantitativa uniforme que ilustre el comportamiento de los sectores en el período relevante de la participación del carbón en la matriz energética llevaron a complementar la indagatoria con testimonios y fuentes cualitativas diversas.
5.1 Producción de energía eléctrica
Según las memorias de las Usinas Eléctricas del Estado (UEE), en vísperas de la primera guerra mundial la empresa consumía más de 25.000 t de carbón mineral en sus plantas generadoras de energía eléctrica en Montevideo (en torno al 8 % del consumo total de esos años)Footnote 24.
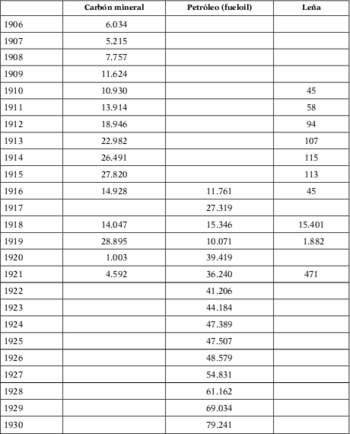
Las dificultades de abastecimiento durante el conflicto bélico obligaron a tomar medidas de carácter extraordinario, tales como la utilización de leña y otros combustibles orgánicos y, finalmente, las autoridades resolvieron convertir los quemadores de las calderas para poder utilizar fueloil. Esta decisión técnica y los cambios en el escenario económico mundial indujeron una transformación decisiva en las UEE, al sustituirse el carbón por el petróleo a comienzos de la década de 1920 (Cuadro 4).
USINA ELÉCTRICA DE MONTEVIDEO. CONSUMO DE COMBUSTIBLES (TONELADAS), 1906-1930

Fuente: anuarios estadísticos de la DGE.
No obstante, habría una «vuelta al carbón» durante las décadas de 1930 y 1940. La central termoeléctrica José Batlle y Ordóñez —puesta en funcionamiento en 1932—fue diseñada para utilizar fueloil o carbón indistintamente. Esto permitió dar cierto margen a la empresa para afrontar las dificultades emergentes de la gran depresión y, especialmente, las restricciones en materia de divisas, ya que el petróleo y el carbón provenían, principalmente, de áreas monetarias distintas.
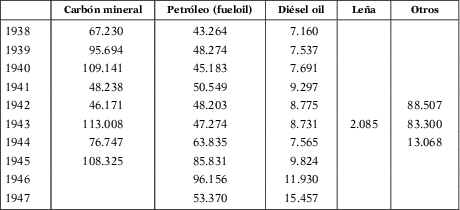
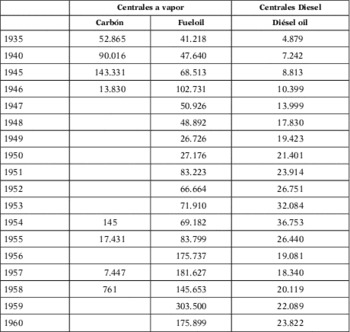
Aunque no fue posible encontrar información directa referida al consumo de combustibles en unidades físicas durante los años treintaFootnote 25, se pudo acceder a dos fuentes secundarias. Una es la publicación de la ANCAP, empresa estatal que, desde 1937 y hasta finalizar la segunda guerra mundial, abasteció a todos los organismos públicos de carbón mineral y que registra datos de «aprovisionamiento de combustibles a la UTE» (Cuadro 5)Footnote 26. La otra fuente es Oxman (Reference Oxman1961), que ofrece información, basada en documentación de la UTE, que cubre desde 1935 hasta 1960, cuando la ANCAP dejó de ser la única empresa proveedora de carbón para la UTE (Cuadro 6).
ANCAP: APROVISIONAMIENTO DE COMBUSTIBLES A LA UTE (TONELADAS), 1938-1947
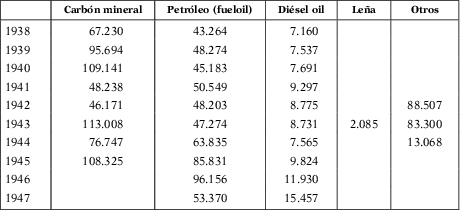
Fuente: Boletín Estadístico de la ANCAP (1948).
CONSUMO DE COMBUSTIBLES PARA LA PRODUCCIÓN DE ELECTRICIDAD (TONELADAS), 1935-1960

Fuente: Oxman (Reference Oxman1961, p. 73, Cuadro XIII).
Con base en dichas fuentes se constata que el carbón volvió a participar en la generación de energía eléctrica durante la década de 1930; sin embargo, su regreso fue efímero. En la inmediata posguerra, el petróleo sustituyó definitivamente al carbón en la generación termoeléctrica. El petróleo y la fuerza hidráulica compartieron desde mediados del siglo XX el aporte primario de energía para la generación, desplazando completamente al carbón.
En síntesis, el carbón mineral acompañó el crecimiento del sector eléctrico hasta la primera guerra mundial. Tras una parcial desvinculación de, aproximadamente, una década y media, en los treinta volvió a contribuir a la generación; pero, después de la segunda guerra mundial, dejó de participar prácticamente en esa función. Como se verá en el apartado 6, razones de orden tecnológico (eficiencia) y los precios relativos de los combustibles podrían contribuir a explicar este fenómeno.
5.2 La Compañía del Gas
El carbón mineral, desde las últimas décadas del siglo XIX, constituyó el insumo energético a partir del cual se llevó a cabo la producción de gas para el alumbrado de la ciudad de Montevideo. Aunque en la capital operaba una usina desde antes, esta utilizó residuos de animales, grasas y huesos para la fabricación de gas. La transferencia de la empresa a The Montevideo Gas Company Ltd. marcó un cambio fundamental, tanto en el tipo de servicio ofrecido como en la tecnología asociada a la producción del gas.
Hacia 1900, el uso de gas para alumbrado empezaría a perder protagonismo ante el avance de la energía eléctrica, pero amplió su participación en los hogares para la cocción, la calefacción y el calentamiento de agua. Según Maeso (Reference Maeso1910, p. 57), en 1908 había en Montevideo 16.536 servicios en operación, repartidos entre «instalaciones domiciliarias y casas de negocios». Según el censo de 1908, en Montevideo había un total de 36.080 viviendas, incluyendo casas particulares y de negocios, por lo que aquella cifra representaba una cobertura de 46 %. Si bien no se cuenta con información sobre la evolución de los suscriptores en los años siguientes, es posible identificar una ampliación de la actividad de la Compañía del Gas a través de su producción. Según Bertino et al. (Reference Bertino, Bertoni, Tajam and Yaffé2005, p. 293), entre 1911 y 1930 la compañía del gas aumentó su producción de cinco a nueve millones de metros cúbicos al año.
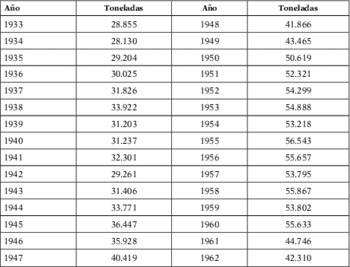
Se cuenta con información referente a los metros cúbicos de gas consumidos en Montevideo entre 1933 y 1939Footnote 27. Por su parte, una publicación de la Comisión de Inversiones y Desarrollo Económico (CIDE) ofrece, desde 1937, una serie homogénea del carbón carbonizado para producir gas (Cuadro 7). A partir de esta información, se realizó una estimación del consumo de carbón por parte de la Compañía del Gas en 1911, como se describió al comienzo de este apartado. Entonces, la producción de gas representaba el 7 % del total del consumo aparente de carbón.
CARBÓN CARBONIZADO POR LA COMPAÑÍA DEL GAS Y DIQUE SECO DE MONTEVIDEO, 1933-1962

Fuente: CIDE (1965, p. 52, Cuadro A).
Nota: las cifras para 1933-1936 se estimaron a partir del coeficiente de eficiencia de 1938.
La ampliación señalada más arriba en el servicio público de gas en Montevideo condujo a un incremento del consumo de carbón. Así, el uso promedio de carbón por parte de la Compañía del Gas representó entre 1933 y 1945 el 10 % del consumo total del país.
En la década siguiente, y debido a la sustitución del carbón por el petróleo y la electricidad en otras actividades, al tiempo que caía el consumo del primero en términos absolutos se incrementaba la participación de la Compañía del Gas como demandante, pasando primero a representar más de la mitad del total consumido y, ya en los años sesenta, alrededor de las tres cuartas partes. Desde 1965, casi la totalidad del carbón mineral importado por el país tuvo como destino la Compañía del Gas; y cuando, en 1978, dicha empresa dejó de utilizar como materia prima el carbón para sustituirlo por la nafta, virtualmente cesó el consumo de este combustible en la matriz energética del país.
5.3 Los ferrocarriles
Hasta la primera guerra mundial, las locomotoras de los ferrocarriles uruguayos consumieron carbón mineral como combustible. Pero, a raíz de las dificultades en el abastecimiento durante el conflicto bélico y del encarecimiento de este insumo, se impuso la necesidad de utilizar otro energético.
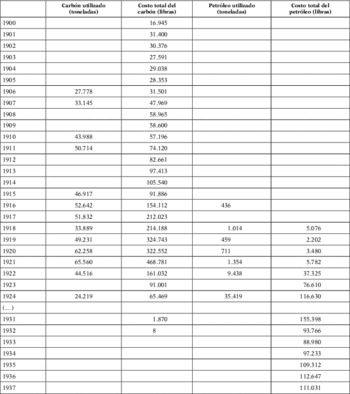
A diferencia de las UEE y de gran parte de los establecimientos industriales, que empezaron a utilizar el petróleo desde 1916, en los ferrocarriles, el carbón de piedra, junto a la leña y otros combustibles orgánicos, siguió siendo el combustible básico hasta el final de la primera guerra mundial. En los primeros años veinte, fuentes británicas señalaban que The Central Uruguay Railway Company contaba con un importante número de locomotoras que se habían reconvertido para quemar fueloil. En 1924, 75 máquinas locomotoras utilizaban ese combustible (22 más que el año anterior) y 67 seguían siendo consumidoras de carbón. Gran parte de estas últimas, eran de baja potencia y estaban acercándose al fin de su vida útil, por lo que no iban a ser reconvertidas a petróleoFootnote 28. En dicho año, el fueloil pasó a ser el combustible principal de las locomotoras. Como se observa en el Cuadro 8, el gasto total en combustibles permite dar cuenta de que a comienzos de la década de 1930 la sustitución del carbón por el fueloil se había completado.
THE CENTRAL URUGUAY RAILWAY COMPANY. CARBÓN CONSUMIDO POR LAS LOCOMOTORAS, 1900-1937

Fuente: The Central Uruguayan Railway Company of Montevideo (varios años).
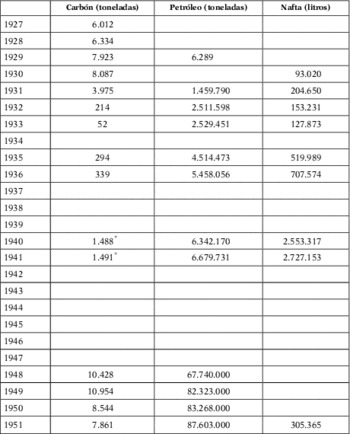
Como ya se adelantó, esta compañía ferroviaria solo explotaba el 60 % de la red nacional; por tanto, las cifras manejadas no reflejan lo ocurrido en los Ferrocarriles y Tranvías del Estado, así como en otras pequeñas empresas privadas. Como se deduce del Cuadro 9, elaborado a partir de las memorias de la Administración de los Ferrocarriles y Tranvías del Estado, allí los años treinta parecen constituir el momento clave de transición de un proceso que se consumaría en la inmediata posguerraFootnote 29.
ADMINISTRACIÓN DE LOS FERROCARRILES Y TRANVÍAS DEL ESTADO. CONSUMO DE CARBÓN, PETRÓLEO Y NAFTA, 1927-1951

Fuente: Administración de los Ferrocarriles y Tranvías del Estado (varios años).
* Incluye leña.
Al concretarse la nacionalización de los ferrocarriles en 1948, la nueva empresa estatal decidió la sustitución gradual de la tracción a vapor (ya en una gran proporción con quemadores a fueloil) por la tracción diésel. La primera etapa se concretó entre 1951 y 1955, y comprendió la dieselización del sistema en general, con excepción de las líneas del litoral (Salto, Cuareim, Artigas y ramal Fray Bentos). La segunda y última etapa para completar la dieselización del sistema se materializó en 1963 con la adquisición de 25 locomotoras de ruta y 14 de maniobras. Cumplida esta última etapa de la dieselización, quedaron teóricamente satisfechas las necesidades de tracción y, por lo tanto, se posibilitó la eliminación definitiva del parque a vapor que aún se mantenía en servicio.
La transición del carbón al petróleo en los ferrocarriles uruguayos debe ubicarse en las décadas de 1920 y 1930; y el definitivo ocaso de este energético en dicho sector, en la segunda posguerra.
5.4 La industria temprana
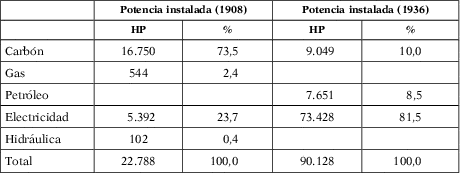
A partir de una discusión de los datos revelados en el Censo General de 1908y en el Censo Industrial de 1936, es posible aproximarse al proceso de sustitución del carbón por el petróleo y, especialmente, por la energía eléctrica como fuentes proveedoras de la fuerza motriz para la industria.
En el Cuadro 10, se presenta la «fuerza motriz instalada» en el sector industrial de Montevideo. A partir de aquí, se supone que los «motores de vapor» (1908) y las «máquinas y turbinas a vapor» (1936) se movían con energía proveniente de la combustión del carbón mineral. Esto oculta la posible sustitución que pudo haberse producido como resultado de la transformación de los quemadores de las calderas para la utilización de fueloil. Solo se consideró maquinaria demandante de derivados del petróleo aquella que aparece identificada como «motores a combustión interna». Este sesgo hace que, posiblemente, la participación del carbón mineral como energético en la industria pueda haber sido algo menor. Pero asumiendo esto, es posible comparar dos escenarios plausibles, ya que en 1908 la participación del petróleo, según otras fuentes, podría considerarse marginal y, en todo caso, en 1936 podría haber una sobreestimación del consumo de carbón, porque el uso del fueloil para alimentar las calderas seguramente estaba más extendido. Por tanto, los datos utilizados podrían considerarse una aproximación al proceso de sustitución del carbón en la industria.
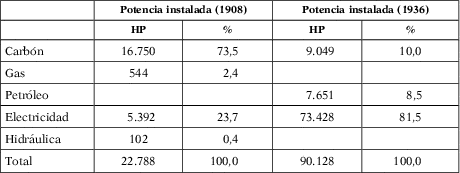
La potencia de los motores industriales que utilizaban carbón cayó casi a la mitad, reduciéndose su participación en el total de la fuerza motriz instalada desde el 73,5 % hasta el 10 % entre 1908 y 1936 (Cuadro 10). De manera paralela, hace su aparición el petróleo, que se utiliza como combustible (el 8,5 % de la potencia instalada en la última fecha, cifra similar a la del carbón). Finalmente, es extraordinario el incremento de los motores eléctricos, que se multiplican por 13,5 hasta representar más del 80 % del total de la potencia instalada en maquinaria industrial.
Entre 1920 y1930, la industria uruguaya creció a una tasa del 5,5 % acumulativa anual y, en su seno, el sector manufacturero un 4,5 %. Entre las actividades sustitutivas de importaciones, se destaca la rama de los minerales no metálicos, que es especialmente demandante de energía. Pero además, puede constatarse un incremento importante de importación de combustibles y un considerable aumento de la importación de bienes de capital con destino a la producción industrial, en particular hacia el final de la década de 1920Footnote 30. Esta dinámica habría tenido en los derivados del petróleo un insumo fundamental.
6 FACTORES EXPLICATIVOS DE LA TRANSICIÓN: PRECIOS, TECNOLOGÍA E INSTITUCIONES
En el apartado anterior se realizó un análisis descriptivo sobre la evolución del consumo de carbón por parte de ciertos sectores intensivos en el uso de esta fuente de energía. A pesar de la visión fragmentaria de lo ocurrido en el sector eléctrico, con la producción de gas, con el combustible utilizado por los ferrocarriles y con la energía que movió a la industria, esta ofrece información importante para aproximarse al fenómeno del auge y ocaso en el consumo de carbón y al proceso de la transición hacia el petróleo.
La transición del carbón operó a lo largo de las cuatro décadas que se iniciaron en tiempos de la primera guerra mundial. Esta mirada sectorial permite identificar diferentes dinámicas de este fenómeno: por un lado, un proceso relativamente acelerado de sustitución en algunas actividades a partir de la primera guerra mundial, como lo evidencia el uso del carbón en el transporte ferroviario y en la industria; y, por otro, un proceso de sustitución «demorado» en el sector energético por el mantenimiento del carbón como insumo básico de la producción de gas y un retorno en los años treinta al carbón para generación de energía eléctrica.
Ahora bien, resta por explicar cuáles fueron los principales factores que impulsaron a las compañías ferroviarias, eléctricas, del gas y al sector industrial a realizar la sustitución del carbón. El estudio se centrará en tres aspectos: las alteraciones en los precios y fletes internacionales, las innovaciones tecnológicas y las cuestiones de orden institucional.
6.1 Encarecimiento relativo del carbón
El análisis de las series de precios del carbón y del petróleo que debió pagar Uruguay en la primera mitad del siglo XX se dificulta por la ausencia de estadísticas oficiales que manejen valores de mercado para las importaciones. Hasta 1941, la Dirección Nacional de Aduanas, organismo encargado del registro del comercio exterior, maneja precios de aforo para las mercaderías ingresadas a los efectos de estimar los impuestos que se deben pagar por las mismas. Esto obliga a trabajar a partir de precios internacionales, pero entonces surge el problema de cómo estimar el costo de los fletes para obtener un precio CIF Montevideo.
Dados los objetivos de este trabajo, en este apartado solo se pretende encontrar señales en el mercado internacional que pudieron contribuir a la toma de decisiones de los actores estratégicos. En tal sentido, la evolución de los precios relativos de carbón mineral y petróleo ofrece una aproximación.
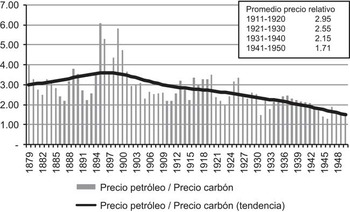
En el Gráfico 6 se presenta el precio de una tonelada equivalente petróleo (TEP) en relación con el carbón mineralFootnote 31. Desde 1900, se constata una tendencia descendente del precio del petróleo en términos relativos al carbón mineral. El período que particularmente interesa para discutir la transición se inicia en torno a la primera guerra mundial. Como puede observarse, el precio promedio del petróleo alcanza casi tres veces el precio del carbón en la década de 1910, se reduce a dos veces y media en la de 1920 y sigue disminuyendo en las décadas sucesivas.
PRECIO RELATIVO DEL PETRÓLEO EN RELACIÓN CON EL DEL CARBÓN (TEP, SERIE ORIGINAL Y TENDENCIA). DÓLARES CORRIENTES, 1879-1950
Fuentes: precio del carbón de Santa Fe Institute, en McNerney et al. (Reference Mcnerney, Dyne and Trancik2011) y del petróleo de British Petroleum (2012). Nota: la tendencia de la serie se estimó aplicando el filtro de Hodrick-Prescott.

Si se tienen en cuenta los problemas de abastecimiento originados en la primera guerra mundial y la evolución de los precios relativos desde entonces, podría existir un incentivo para el cambio de fuente energética.
En cuanto a los fletes, existen indicios de cierta tendencia a favor de los costos de transporte del petróleo en relación con el carbón mineral. En primer lugar, durante los años veinte y treinta, Uruguay se abastecía de petróleo y derivados desde el continente americano (Estados Unidos, México, Perú, Ecuador, Venezuela), lo que «acorta las distancias» respecto a la provisión de carbón mineral, que continúa siendo desde el Reino Unido de manera excluyente. La menor distancia debería haber incidido en el precio de los fletes respectivos según Bertoni et al. (Reference Bertoni, Román and Rubio2009).
Según Nahum (Reference Nahum2003, p. 325), en 1933 el carbón importado por Uruguay salía del Reino Unido con un precio FOB de 16,6 chelines por tonelada y pagaba un flete de 8,8 chelines por tonelada. Por su parte, la ANCAP estimaba el flete del crudo importado en un poco más de un tercio del precio FOB.
En un contexto de abaratamiento relativo del petróleo, los costos de los fletes no habrían operado en perjuicio de la transición al petróleo. Como ha sido señaladoFootnote 32:
«Cuando el petróleo apareció como una alternativa económica y tecnológicamente viable en los años de entreguerras, Uruguay se encontró ante la situación de enfrentar fletes más favorables para el petróleo que para el carbón, lo que parece ser una buena justificación para emprender una temprana transición al petróleo.»
En relación con los precios domésticos, las memorias de Central Uruguay Railway Company aportan evidencia reveladora de la alteración de los costos energéticos que afrontaban las empresas en Uruguay. A partir de los reportes anuales, se puede extraer información sobre los cambios en los precios de la tonelada de carbón mineral que pagaba dicha compañía y se convierten en testimonio del encarecimiento de este energético ya en vísperas de la primera guerra mundial. Pero la situación se agravó. El costo de la tonelada de carbón en 1910-1911 era de 1,51 libras, subió casi al doble durante el conflicto y continuó incrementándose durante los años siguientes. En 1915-1916, el precio de la tonelada de carbón era de 2,9 libras; en 1918-1919, era de 6,5 libras; y, al año siguiente, de 5,3 libras. El encarecimiento del carbón, junto con las dificultades de abastecimiento, continuaron durante los años siguientes a la guerra, lo que derivó en la adopción de una nueva estrategia energética: el uso de locomotoras a petróleo (como se explicó en el apartado 5.3).
6.2 Innovación tecnológica: ¿americanización de la tecnología?
La adopción de nuevas formas de producir y la incorporación a la canasta de consumo de bienes nuevos, implicaron demandas energéticas asociadas a fuentes diferentes al carbón, como era el petróleo. Tal es el caso de los motores a combustión interna, la «dieselización» del ferrocarril y la electrificación de las pequeñas localidades del país. En este contexto, el transporte automotor merece atención especial. El automóvil, como vehículo de las familias, y las camionetas y camiones para el transporte de bienes aparecieron en escena y provocaron una demanda de derivados del petróleo.
Como se señala en Bertino et al. (Reference Bertino, Bertoni, Tajam and Yaffé2005), la innovación que revolucionó el sector transporte después de la primera guerra mundial fue la derivada de la combustión del petróleo, en clara correspondencia con la nueva hegemonía mundial de Estados Unidos, donde se concentraba la mayor parte de las empresas petroleras y de las fábricas de automotores y neumáticos.
El incremento en la importación de automóviles (equivalente al consumo interno, puesto que no existe producción doméstica de este bien) es fiel reflejo de la acelerada adopción de esta tecnología. Tomando las cifras de comercio exterior, en 1903 aparece un solo automóvil importado, en 1915 la cantidad era de 183, en 1920 ascendió a 4.142 unidades, y la acumulación entre 1915 y 1933 fue de 51.686 unidades importadasFootnote 33.
Otro indicador de esta revolución de los transportes se observa en el incremento del transporte carretero de pasajeros y de carga; por ejemplo, medido a partir del crecimiento del valor agregado bruto. Este sector tuvo una dinámica sobresaliente, en especial durante los años veinte: el crecimiento promedio anual fue de un 16,1 % entre 1921 y 1925, y de un 19,3 % entre 1926 y 1930Footnote 34. La transformación en el transporte se produce, como ha sido señalado, en paralelo a una sustitución del carbón por derivados del petróleo en las locomotorasdel ferrocarril. Algunos autores han caracterizado este fenómeno como un cambio tecnológico asociado al agotamiento de la «tecnología británica» y a la emergencia de una «tecnología americana»Footnote 35. En Uruguay, se habla de un proceso de dieselización del parque de locomotoras que culminó con la nacionalización del ferrocarril y la consolidación de la Administración de Ferrocarriles del Estado en la segunda posguerra.
Como se presentó en el apartado 5.1, Uruguay vivió durante la primera mitad del siglo XX un importante proceso de electrificación. Dado que las líneas de trasmisión fueron extendiéndose lentamente por el territorio, la solución técnica fue la generación distribuida. Para brindar el acceso a la electricidad a pequeñas localidades se instalaron generadores a fueloil o a diésel oil. Antes de 1912, fecha en que se creó la empresa UEE con el monopolio sobre la generación, trasmisión y distribución de la energía eléctrica a escala nacional, había 13 usinas a carbón en todo el país. Entre 1912 y 1935 se crearon 30 usinas de generación, todas ellas consumiendo fueloil o diésel oil, dado que el tamaño de las mismas se correspondía con este tipo de tecnología. A esto debe sumarse la transformación progresiva de las 13 primeras usinas para consumir derivados del petróleo como energéticoFootnote 36.
Finalmente, cabe señalar que el incentivo para adoptar derivados del petróleo para la generación se fundaba en una razón de eficiencia. Oxman (Reference Oxman1961, p. 21) señala, a partir de información de UTE, que los rendimientos técnicos del proceso generador habrían experimentado importantes mejoras con la incorporación de los derivados del petróleo. En 1948, cada kw/h generado requería un consumo de 0,58 kg de petróleo, mientras que en 1960 este coeficiente había caído a 0,36 kg.
La incorporación de la hidroelectricidad a la matriz energética a partir de 1945-1948 completó un escenario de cambio tecnológico que marginaba al carbón como combustible para generación.
6.3 Aspectos institucionales: enfrentamiento al «empresismo británico»
Entre los factores explicativos de la transición del carbón al petróleo, no puede olvidarse la variable político-institucional. Los elencos «batllistas»Footnote 37 en el poder en las primeras tres décadas del siglo XX y, particularmente, durante el segundo Gobierno de José Batlle y Ordóñez (1911-1915), desarrollaron una política deliberada de enfrentamiento al «empresismo británico».
La creación de empresas públicas proveedoras de servicios públicos para evitar monopolios privados se complementó con obras de infraestructura que compitieran con el capital británico dueño de gran parte del transporte de carga y pasajeros. Como se señala en Bertino et al. (Reference Bertino, Bertoni, Tajam and Yaffé2005), en el discurso batllista, el desarrollo de las capacidades estatales se asoció con la defensa del interés nacional frente al capital extranjero y, en esta línea, la política de nacionalizaciones y estatizaciones hizo del Estado un agente relevante para las dimensiones de la estructura económica del país. En términos generales, el avance del Estado se habría llevado a cabo a costa del capital extranjero, mayoritariamente británico.
El impulso a la expansión de la red carretera nacional simultáneamente con los ferrocarriles del Estado debe considerarse parte de esta impronta «antibritánica». Es en este contexto, en el que deben ubicarse los planes de obras públicas que contemplaban el trazado de una red de carreteras, muchas de ellas paralelas a las vías de Central Uruguay Railway Company. Los planes de 1905 y 1909, así como la expansión carretera en los años veinte, deben analizarse desde esta perspectiva. El resultado fue la emergencia de la infraestructura necesaria para que el transporte automotor, una nueva tecnología intensiva en el uso de derivados del petróleo, compitiera con los ferrocarriles británicos.
7 CONCLUSIONES
El auge y el ocaso del carbón mineral son manifestaciones del proceso de modernización energética. La estimación histórica de una serie en Uruguay, ajustando el problema estadístico originado por el abastecimiento de carbón a los buques, permite analizar el consumo de carbón y, complementariamente, la dinámica de la transición fósil.
La «era del carbón» en Uruguay, en lo que respecta a su aporte como energético asociado al crecimiento económico, debería ubicarse en las primeras décadas del siglo XX. La energía necesaria para los procesos de valorización sería aportada crecientemente después de la primera guerra mundial por otros vectores como el petróleo.
La demanda efectiva de cuatro grandes consumidores, las usinas eléctricas, la producción de gas, los ferrocarriles y la industria, que hacia 1909-1911 utilizaban el 84 % del carbón, contribuye a explicar el comportamiento del carbón mineral. La evidencia manejada permite afirmar que la transición al petróleo se operó a lo largo de cuatro décadas, que se inician alrededor de la primera guerra mundial.
No obstante, el fenómeno es el resultado de tres trayectorias diferentes: la sustitución del carbón por otro energético (caso del ferrocarril y la actividad industrial), el surgimiento de nuevas actividades intensivas en el uso de otra fuente de energía (el transporte automotor) y el parcial retorno al carbón en los años treinta, como es el caso de la generación de electricidad. Como resultado, la competencia entre el carbón y el petróleo solo se produjo en algunos ámbitos, lo cual explica que el proceso de transición no se haya completado hasta después de la segunda guerra mundial. A la luz de estos resultados, es posible afirmar que el ocaso del carbón aparecería, como antes su auge, como una manifestación del proceso de modernización energética.
Esta dinámica confirma el modelo uruguayo, de retrocesos y recuperación, identificado por otros estudios comparativos a escala regional. La nueva serie construida permite corregir los niveles de consumo de carbón per cápita manejados por esos trabajos y altera la posición de Uruguay en el contexto regional durante el primer cuarto del siglo XX. En este sentido, si bien se mantiene entre los cuatro principales consumidores de carbón, se coloca detrás de Argentina, Chile y Cuba, lo que refleja una realidad más acorde con la economía uruguaya de entonces.
La modernización económica, el incipiente desarrollo industrial y el acelerado proceso urbanístico que vivió Uruguay durante las primeras décadas del siglo XX incidieron en el ritmo de la transición fósil. Pero además, con estos fenómenos interactuaron los problemas de abastecimiento emergentes durante la —llamada por Hobsbawm—«era de las catástrofes», la alteración en los precios relativos, la dinámica del cambio tecnológico y factores de orden institucional.
Un encarecimiento del precio del carbón respecto al petróleo actuó como incentivo para adoptar una tecnología nueva y más eficiente (el motor de combustión interna) y este proceso encontró un marco institucional favorable a partir de las acciones gubernamentales hostiles hacia el «empresismo inglés».
APÉNDICE
CONSUMO DE CARBÓN MINERAL EN URUGUAY, 1879-2011