

Introduction
Avast literature demonstrates that electoral intermediaries, or brokers, help politicians engage in clientelism across the developing world.Footnote 1 Community-level brokers, in particular, are thought to be efficiency enhancing for politicians by allowing them to secure support from coordinated blocs of voters without having to engage in more complex, and less monitorable, exchanges at the individual level.Footnote 2 But a closely related question remains more theoretically and empirically ambiguous: under what conditions do community-level brokers help voters? Brokers may produce gains for their followers by linking them to patronage resources to which they would not otherwise have access or by helping blocs of voters leverage their collective voting power to extract more resources from politicians than they would be able to on their own.Footnote 3 Yet brokers can also exploit intermediary positions for rent-seeking,Footnote 4 taking advantage of their voters and leaving them worse off than they would be if bargaining directly with politicians.
This article argues that whether brokers benefit voters is a function of the accountability relationship between brokers and their clients. Where there is elite capture and brokers are not beholden to their followers to continue in their positions, brokers are freer to engage in rent-seeking, trading away votes for deals in their own, not voters’, best interest. Unaccountable brokers who have captured community-level power may strike worse deals for their clients than voters could achieve on their own without a broker, or than voters would receive if under the influence of a more accountable broker.
I examine these comparisons by studying traditional leaders, or chiefs, in Northern Ghana. Like much of rural Africa,Footnote 5 chiefs in Northern Ghana are often key intermediaries linking politicians to voters. But the presence and nature of chieftaincy varies widely. Over thirty distinct ethnic groups share the same geographic, electoral, and economic context. Approximately one-third of residents come from groups who since the precolonial period, have always had chiefs. Another third is from groups who were acephalous prior to colonialism, with no political centralization, but who saw chieftaincy invented by the British colonial government. The remainder were ignored by colonial authorities, and as a result have never had their own independent hierarchy of legally recognized chiefs since the onset of colonialism.
This variation allows for comparisons of communities with and without chiefs, as well as of communities in which chiefs have different accountability relationships with their subjects. In this context, accountability between community-level brokers and their clients is shaped by institutional rules for the selection of chiefs.Footnote 6 In Northern Ghana, these rules differ by the historical origins of chieftaincy. In particular, the ad hoc nature of the British colonial imposition of chieftaincy left behind institutions much more prone to elite capture than those that emerged organically in the precolonial period. Unaccountable, invented chiefs should then be less liable to strike deals with politicians in their followers’ interest compared to communities that do not have traditional leaders capable of brokering their votes and to communities with chiefs who are more accountable and rooted in precolonial institutions.
Empirically evaluating these types of comparisons is typically limited because brokers emerge through opaque processes that are endogenous to voter and community characteristics.Footnote 7 For example, there is usually no valid control group without community-level brokers against which to compare the fortunes of voters under the influence of these intermediaries. But Northern Ghana’s history provides unusual, plausibly exogenous leverage to study the selection of voters into brokerage. The distinction between ethnic groups with colonially invented chiefs and those left largely without recognized chiefs today was in large part determined by which side of the pre-World War I, Anglo-German Gold Coast–Togoland border an ethnic group initially lived. This border was drawn prior to colonial rule, in a manner unrelated to local populations. While British authorities immediately began inventing chieftaincy on their side, the Germans engaged in no similar efforts. When the British took control over part of Togoland after WWI, they nominally extended the rule of chiefs who they had already been working with eastward to cover the annexed territory. The result was that while almost all precolonially acephalous groups initially on the British side of the border saw the invention of chieftaincy prior to WWI, no ethnic groups originally placed in Togoland ever had chiefs invented by the British. These differences persist with only a few exceptions, creating contemporary variation in the presence of chiefs who can serve as community-level brokers.Footnote 8 This exogenous variation only applies to a subset of groups, but still offers better leverage on selection into community-level brokerage than is typically possible.
I draw on original data on ethnic institutional histories and chieftaincy succession combined with fine-grained village-level census data, polling station–level election results, and geocoded Afrobarometer surveys. The analysis proceeds in several parts. First, I present suggestive evidence in support of the mechanisms in the argument. I document that colonially invented chieftaincies are more prone to capture and are perceived as less accountable by their subjects. I then show that these chiefs are nonetheless important intermediaries in contemporary elections. I find that ethnic groups with chiefs cluster their votes more at the community level, consistent with traditional leaders serving as vote-coordinating, community-level brokers, and that chiefs also appear to substitute for individual-level mobilization by party organizations,Footnote 9 with members of groups without formal chiefs receiving the most vote-buying offers and contact with party agents.
Second, I turn to the key comparisons of interest. I find that chieftaincy institutions most susceptible to capture—those invented during colonial rule—reduce voters’ ability to extract a series of state-provided benefits during modern electoral competition compared to communities without formal chiefs and to communities with more accountable chieftaincy institutions dating to the precolonial period. I provide descriptive evidence for this claim and present similar results for the comparison to communities without chiefs when instrumenting for the presence of colonially invented chieftaincy based on the pre-WWI distribution of ethnic groups relative to the original Gold Coast–Togoland border.
This article makes several contributions. Most important, it contributes to the study of brokers in new democracies. It shifts the main focus of existing literature from how brokers help parties to a less studied, but equally important, question of the conditions under which brokers help voters. I build on research on other settings to show that the extent to which brokers are accountable to followers shapes whether brokers create gains from collective bargaining, helping voters extract more resources from politicians, or instead leave voters worse off than they would have been on their own.Footnote 10 Moreover, by exploiting exogenous assignment in the introduction of brokerage, I have better ability to test this argument.
The article also has implications for other literatures. It advances recent research on chiefs in African elections.Footnote 11 I suggest that chiefs’ accountability to their subjects is a key, but underexplored, determinant of whether they benefit their communities, complicating recent assumptions that chiefs have consistent incentives to represent community interests in their pursuit of resources from politicians.Footnote 12 Moreover, existing analyses are typically not able to use ethnic groups who lack chiefs as a comparison for estimating the effects of chieftaincy on resource distribution.Footnote 13 This article examines plausibly exogenous variation in overall selection into chieftaincy, albeit only among a subset of ethnic groups, for the first time.
It additionally contributes to research on the contemporary legacies of colonial and precolonial institutions. Consistent with Mahmood Mamdani, I show that colonially invented elites can remain powerful, negative forces in rural African communities, contrasting with arguments from other cases suggesting that colonially imposed chiefs were mostly unable to sustain themselves as influential political actors.Footnote 14 This article offers new evidence for the political microfoundations of findings, such as those by Nicola Gennaioli and Ilia Rainer and Stelios Michalopoulos and Elias Papaioannou, that suggest that precolonially acephalous ethnic groups may have lower present-day development in part due to unaccountable forms of leadership imposed during colonialism.Footnote 15 But in contrast to those studies, I also document that a subset of precolonially acephalous groups avoided the imposition of chieftaincy and have a better development trajectory today. Ultimately, my findings reinforce both that the effects of colonial institution building were not monolithic—they vary within the same colonyFootnote 16—and that the growing literature on historical legacies in developing countries cannot understand relationships between precolonial history and contemporary outcomes without closely examining the mediating effects of colonialism.
Brokers, Chiefs, and Distributive Politics
Chiefs as Community-Level Brokers
Community-level brokers help politicians engage in clientelism. By coordinating bloc voting on a party’s behalf at the community level, these brokers allow parties to buy support wholesale.Footnote 17 Brokers’ coordination lets parties substitute away from costly individual-level engagement with voters, including more complex efforts to initiate and to monitor direct voter-level exchanges.Footnote 18 As a result, where community-level brokers are active, there should be more bloc voting and less direct individual-level resource distribution by, or voter contact with, party organizations.
Traditional chiefs in rural Africa are well positioned for such a role. Policies of indirect rule, especially in British colonies, gave chiefs power over taxation, local public goods, and other forms of administration. Although most chiefs have little remaining formal governance role today, they still wield socioeconomic power in rural areas through control over communally owned land, as mediators in disputes, and by organizing communal labor.Footnote 19 Chiefs often leverage these powers into a role as electoral intermediaries,Footnote 20 becoming “king makers” who coordinate community votes.Footnote 21
But not all ethnic groups have active or powerful chiefs. Groups without chiefs often lack similarly powerful community-wide brokers capable of coordinating community votes and substituting for direct partisan engagement.Footnote 22 Other types of brokers may emerge instead, such as party brokers employed within a party organization. But without landowning, judicial, or labor-organizing powers, other brokers will typically have less community-wide influence than chiefs, making them relatively less able to coordinate bloc voting and to strike wholesale community-level deals with politicians. Ultimately, in competitive elections in which the votes of groups without chiefs are valuable to parties, the efficiency gains from using chiefs as brokers among some ethnic groups should allow parties to concentrate more campaign effort on the direct mobilization of ethnic groups who do not have chiefs.
Brokers’ Accountability to Voters
Even if brokerage leads to less direct resource provision and engagement from parties, do voters with chiefs still benefit from having their votes brokered, extracting more state resources overall in return for their support? Existing literature offers conflicting answers. Some studies expect that community-level brokers strike beneficial deals for their followers, producing gains from collective bargaining. If brokers are free agents—nonpartisans able to drive a hard bargain between competing parties—they can create an auction for a community’s votes, more effectively extracting resources than voters can individually. Politicians may also target more resources to communities in which they know a strong broker is capable of coordinating support because they can be more certain of the electoral returns from doing so.Footnote 23 The vote coordinating of intermediaries should also be beneficial if they are simply pointing voters to candidates with whom they will best cooperate in coproducing local resources.Footnote 24
But a broker could just as plausibly leave followers worse off, especially when voters place little accountability pressure on the broker. Brokers often exploit their intermediary position for rent-seeking, skimming from benefits passed down by politicians or coordinating votes in return for side payments that never reach voters.Footnote 25 Rent-seeking is a bigger risk when there is capture and brokers are not accountable to voters.Footnote 26 Adam Auerbach shows, for example, that Indian slums in which multiple brokers compete for followers receive greater investments in local public goods because brokers have to secure more benefits for voters or risk losing their positions.Footnote 27 Brokers will also strike worse deals for voters when they themselves are accountable to a party or political patron for their position—not to voters—and thus cannot drive hard bargains.Footnote 28
Chiefs in rural Africa who are particularly unaccountable to their subjects are those least likely to act in voters’ best interests when serving as community-level brokers. The accountability of chiefs to their followers depends on the rules used to select chiefs. I highlight two features of chieftaincy selection that can undermine accountability and facilitate capture.
First, some chieftaincy institutions empower hereditary “despots,” granting single families permanent access to positions without popular input.Footnote 29 For example, Daron Acemoglu and colleagues show that where hereditary rights to chieftaincies in Sierra Leone have been concentrated historically in fewer families, communities have worse development outcomes today because of greater rent seeking and coercion by unaccountable chiefs.Footnote 30 Second, elsewhere, limits to accountability can emerge instead from the ambiguity of succession rules. Where chieftaincy succession is poorly codified and perpetually in dispute, governments have legal leverage to intervene in appointments and impose preferred brokers on communities. Chiefs dependent on politicians for their positions risk becoming multilevel instruments of capture, controlling their communities’ votes as they, themselves, are controlled by the politicians who installed them.
Where either set of succession institutions—capture by single families or political imposition of partisan chiefs—is in place, chiefs coordinate community members’ votes while facing limited accountability pressure to deliver for their subjects. The resulting ability of chiefs to exploit their brokerage positions may harm voters, rendering community members less able to extract state resources in return for their votes than if they interacted with politicians and parties directly.
Relationship to Existing Literature
My argument departs in several ways from other recent research on the brokerage role of chiefs. First, Kate Baldwin predicts more consistently positive effects of chiefs on their communities; our different expectations emerge in part from focusing on different outcomes.Footnote 31 Baldwin examines coproducible resources that communities help to provide to themselves, while I focus on state resources directly provided by politicians.Footnote 32 Coproduction depends as much on the ability of chiefs to solve intracommunity collective action problems as on politicians’ distribution. Unaccountable chiefs may still be quite effective at compelling communal self-provision.Footnote 33 A more important difference stems instead from Baldwin’s assumption that chiefs’ time horizons and embeddedness create clear incentives to pursue community interests.Footnote 34 I suggest that this altruism is contingent and will not necessarily prevail where chiefs are particularly unaccountable to their subjects.
Second, my argument does not depend on how chiefs coordinate votes, a key focus of other research. It is often assumed that chiefs’ vote coordination is implicitly coercive, for example, through threats over access to land.Footnote 35 Jeffrey Conroy-Krutz shows that communities vote more as blocs in rural Uganda in communities in which voters depend more on local elites for land tenure.Footnote 36 More directly, Jessica Gottlieb shows that traditional leaders in Senegal who are less accountable to their communities coordinate votes more coercively. If there is coercion, unaccountable chiefs should be the most effective brokers. But vote coordination could also be achieved through persuasion and respect,Footnote 37 or because voters draw informational value from chiefs’ candidate endorsements.Footnote 38
Coercion also provides the most direct explanation for why unaccountable chiefs continue to coordinate votes successfully even as they extract fewer state resources for voters. But coordination could still be achieved even if coercion is limited. Chiefs can take advantage of the respect of isolated rural voters who cannot easily observe the relative extent to which they are disfavored in allocations of state resources.Footnote 39 Daniel Posner and Elizabeth Carlson demonstrate that rural African voters often have very limited information about what other communities are receiving.Footnote 40 Voters may also benefit in other ways from voting with the chief. If unaccountable chiefs are effective at the coproduction of smaller-scale resources, as I discuss above, voters may still support chiefs’ preferred candidates in expectation of more cooperative coproduction.Footnote 41 Short-run defections from voting with the chief may only compound a community’s disadvantages, leading to fewer coproduced resources in addition to fewer resources directly from politicians.
The Case: Northern Ghana
Ghana’s three northern-most administrative regions—Northern, Upper East, and Upper West—are distinct from the rest of the country. During colonialism, they were governed separately as the Gold Coast’s Northern Territories. They continue to form a geographically, economically, and culturally separate region.
State resources are often politically targeted to win votes in Ghana’s competitive presidential and parliamentary elections. Administrative districts—originally twenty-four in the north, now fifty—are the key unit of distribution, receiving budget transfers from the national government that are allocated within districts by unelected officials appointed by the president. Two parties dominate, the ruling New Patriotic Party (NPP), in power from 2001 to 2008 and from 2017 to the present, and the National Democratic Congress (ndc), in power from 1992 to 2000 and from 2009 to 2016. The north is a relative stronghold of the ndc, with 61 percent and 58 percent voting for it in the 2012 and 2016 presidential elections, respectively. But presidential election results are locally variable, and many of Northern Ghana’s more than thirty small ethnic groups are divided between these parties.
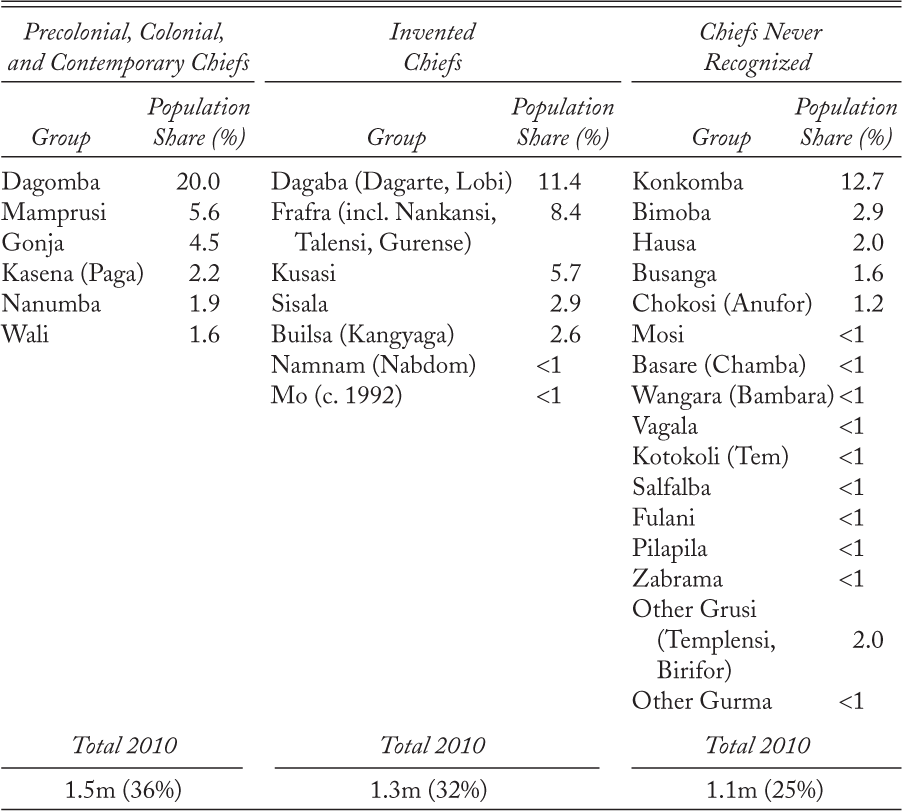
From the outset of formal colonial rule in 1901, the British began to empower chiefs as local agents to keep staffing low. Although the British used existing chiefs where possible, they also resorted to inventing chiefs among Northern Ghana’s many previously acephalous groups, “creat[ing] chieftaincy institutions among people for whom this institution was either unknown or at best peripheral.”Footnote 42 Institutional choices from colonialism persist. Every group among whom the British either recognized existing chiefs or invented new ones still has chiefs today. And all but one of the groups among whom they did not recognize or invent chiefs still lack their own recognized hierarchy of chiefs. Table 1 lists every group indigenous to Northern Ghana, along with their 2010 population share. Groups are in three categories: those who have always had chiefs across the precolonial, colonial, and postcolonial periods; groups who were acephalous, but saw chiefs invented after the onset of colonialism;Footnote 43 and groups who were ignored by the colonial state and have largely lacked recognized chiefs.Footnote 44
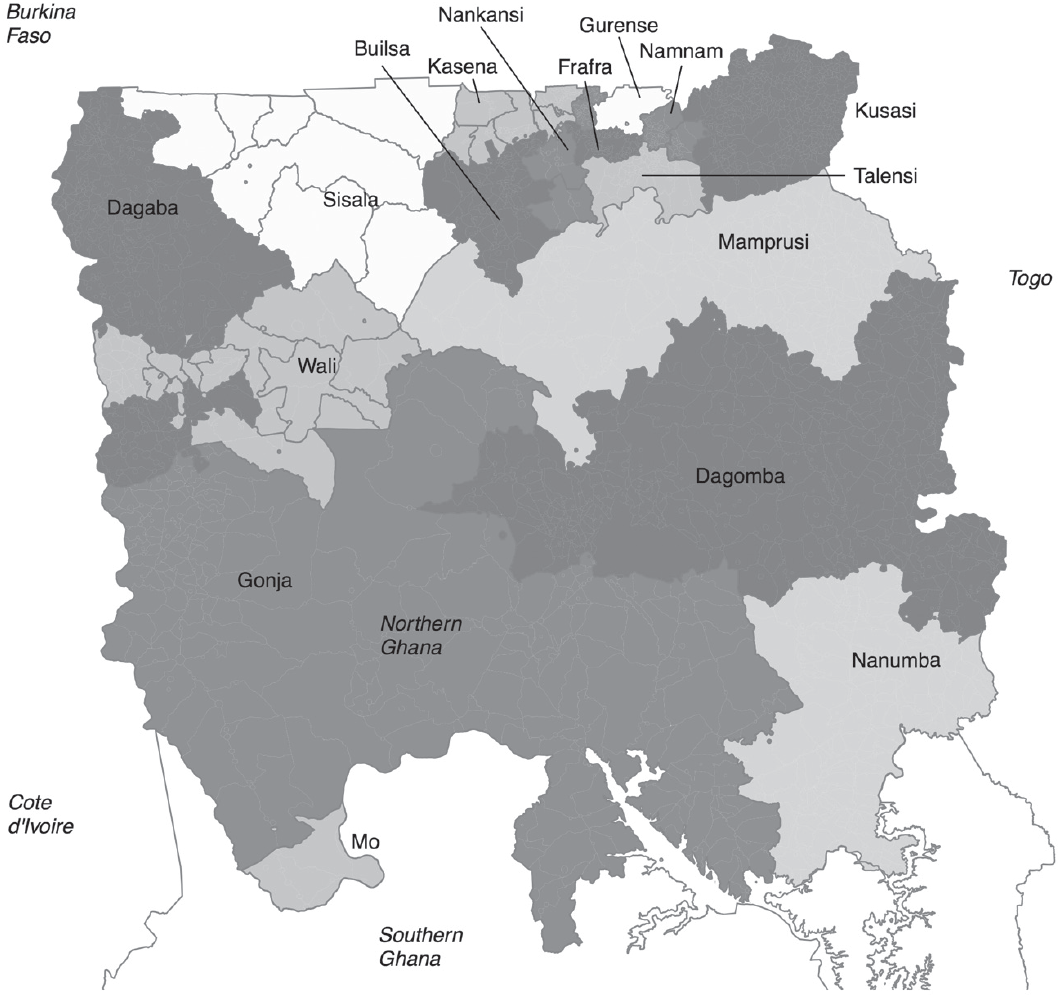
Figure 1 maps present-day jurisdictions of each group with recognized chiefs. The north is divided into Traditional Councils led by a paramount chief. The chief of each local community—its most immediate potential broker—is either a divisional or village-level chief serving beneath the paramount. Importantly, these Traditional Councils are separate from and do not directly line up with administrative districts and parliamentary constituencies, the main units of formal governance.
Since 1979, Ghana’s constitution has granted northern chiefs formal ownership of all land in their jurisdictions. These rights are not uniformly exercised in practice.Footnote 45 But in many communities, control over the most important resource in the agrarian economy gives chiefs potential coercive power over subjects.Footnote 46 Elsewhere, chiefs’ power stems more from their quasi-judicial role and from the social respect they are afforded as elders and spiritual leaders.
Ethnic Groups and Invented Chieftaincy in Northern Ghanaa

a Group names and share of northern population from the 2010 census. The remaining 7 percent is southern or non-Ghanaian.
The present-day influence of chiefs also comes from their role as electoral intermediaries. Qualitative research on Northern Ghana regularly describes chiefs as community-level brokers. For example, according to A. K. Awedoba and colleagues, “[G]iven [chiefs’] perceived influence over their people, politicians . . . exhibit generosity to the chief in order to secure his goodwill and through him that of the community.” Although most exchanges between politicians and chiefs are unobservable, chiefs are thought to extract a range of rents from politicians in return for mobilizing votes. In addition to standard forms of patronage, these include tacit permission from local governments to engage in informal taxation, from which chiefs benefit personally.Footnote 47 Another private benefit is state influence in succession. Where succession is contested, chiefs benefit directly from politicians exerting leverage over the courts and police to ward off rival claimants.
Traditional Council Jurisdictions in Northern Ghanaa

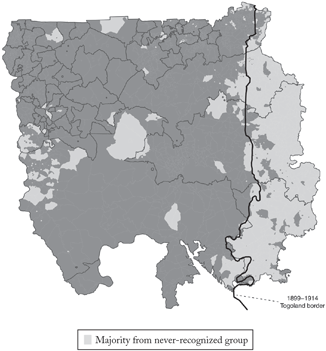
But more than one-quarter of the population has never had its own recognized, independent traditional council. Figure 2 shows 2010 census enumeration areas in which the majority population is from a never-recognized group. Large swaths of the north, especially in the former German togoland, are home to ethnic groups nominally placed within the Traditional Councils of unrelated groups. Denied full state recognition, these groups still lack formal land ownership and usually do not have formal traditional leaders who can serve as powerful brokers.
Majority Never-Recognized Communitiesa

A small number of chiefs from never-recognized groups have been appointed within the existing hierarchies of neighboring groups. Such appointments have often been attempts to avoid violent land conflicts. For example, Dagomba leaders have appointed Konkombas as the chief in a handful of Konkomba towns.Footnote 48 But all results discussed below are robust to dropping communities in which official chieftaincy registries from the National House of chiefs indicate a cross-ethnic appointment has been made (see the supplementary material).Footnote 49 For many areas dominated by never-recognized groups, the parties must engage voters through other means than powerful chiefs.
Theory Applied: Accountability and the Origins of Chieftaincy
Crucially, the different histories of ethnic groups in Table 1 create variation in the accountability of community-level brokers that can be used to examine my argument. This section applies the theory to the Ghanaian case, generating predictions for the analysis. Colonially invented chiefs in Northern Ghana are especially unlikely to be accountable to their subjects. Colonial invention was deeply arbitrary. Appointment procedures varied widely within ethnic groups and rarely codified clear succession institutions.Footnote 50 This lack of well-defined succession rules has heightened present-day risks of both types of capture outlined above: permanent control by single families and the political imposition of partisan chiefs.
First, in some cases, the original families empowered by the British used advantages accrued in the colonial period to capture effectively permanent control. An illustrative case is Lawra, a Dagaba town in which the British introduced chieftaincy in 1903. Starting from their first appointment to the position in 1927, the Karbo family has been able to sustain dynastic local power in the absence of clear succession rules. The family used powers conferred on chiefs by the British to amass significant wealth advantages in the colonial period.Footnote 51 The second Karbo chief ’s son, Abayifaa Karbo, was among the first Dagaba to receive higher educationFootnote 52 and was elected as the area’s first MP, benefitting from his father’s support.Footnote 53 He then succeeded his father as chief. Upon Abayifaa’s death in 2004, the wealth and educational advantages that the Karbos had accumulated allowed them to “ride rough-shod” over other claimants, interpreting ambiguous rules in their own favor and installing Abayifaa’s nephew as the new chief.Footnote 54 Like his grandfather once did for his uncle, this chief now uses his influence to campaign openly for his son, who has become the area’s MP.Footnote 55
Lawra exemplifies a pattern among invented-chiefs groups. I measure hereditary capture using contemporary registers from the National House of chiefs, the official agency that registers chiefs, combined with British archival documents listing all chiefs in the Northern Territories in 1909, 1922, and 1934. These data suggest that the sustained capture of chieftaincy positions by single families is especially common among groups with invented chiefs. The contemporary registers include any changes in chieftaincy appointments dating to the 1980s. For the 485 rural communities with documented changes, 44 percent of positions passed between chiefs sharing the same surname in invented-chiefs groups compared to only 19 percent for always-chiefs groups.Footnote 56 In addition, I match the two sets of lists to code whether contemporary chiefs share a surname with colonial-era chiefs from the same community, indicating that the same family has likely held power for decades. Across the 534 rural communities that I can match to colonial-era records, among invented-chiefs groups there are three times as many cases in which a family from the early colonial period still occupies the chieftaincy (30 percent) compared with the always-chiefs groups (10 percent).
Second, where single families have not captured control, succession disputes are common, creating opportunities for Ghana’s ruling parties to install partisan chiefs. Wyatt MacGaffeyFootnote 57 describes partisan interference in chieftaincy that has become so common that “litigation and political alliance with the party in power” are now major mechanisms for appointing chiefs. Partisan interference creates another avenue to capture. Many chiefs are popularly known to be “ndc men” or “npp men”—partisans whose contested claim to power depends on their ties to a specific party. Succession disputes that allow for partisan interference are far more common in invented-chiefs groups. Awedoba and colleagues comprehensively document all active succession disputes in Northern Ghana in the first decade of the twenty-first century, the same period I examine below.Footnote 58 Among thirty-one disputes, 68 percent (twenty-one) involved invented chieftaincies, including five of the seven invented-chiefs groups in Table 1.Footnote 59 Awedoba and colleagues trace most of these disputes directly to ambiguities left behind by British institution building.Footnote 60
Both dynamics contrast with groups who have always had chiefs. Drawing on precolonial institutions left largely intact, these groups often rotate positions among gates, or subgroup clans. At any one time, the paramount is from one gate while divisional and village-level chiefs are from others. Rather than allowing for capture by a single family, positions are not hereditary and offices typically are not held for life.Footnote 61 Instead, chiefs start their careers at the lowest levels and are gradually promoted or rotated to other positions. Among the Dagomba—for whom chieftaincy dates to the fifteenth century—there are usually multiple candidates, each representing different families, lobbying for each position. Higher-level chiefs consider local preferences when making appointments and ordinary Dagomba have informal veto powers that create avenues for bottom-up accountability. For example, “[T]he people may refuse to allow [a new chief] to occupy the palace if they do not like him.”Footnote 62 Some positions are also set aside for commoners, allowing nonroyal families to enter traditional leadership.Footnote 63 There are still succession disputes at the highest levels in some of these kingdoms, most notably the Dagomba, the most powerful precolonial kingdom. But at lower levels—especially among divisional and village chiefs—power is decentralized across a complex, ever-shifting assortment of families.
Afrobarometer surveys show that these differences in institutions reflect contemporary perceptions of chiefs’ accountability. Respondents in Northern Ghana from ethnic groups with invented chiefs are less likely to report that their chiefs listen to their concerns than respondents from groups who have always had chiefs (75 percent always chiefs versus 60 percent invented chiefs, N = 183), although this difference is not statistically significant at conventional levels (p = 0.06).Footnote 64 Respondents from groups with invented chiefs are also 10 percentage points less likely to report trusting their chiefs than respondents from groups who have always had chiefs (p < 0.01, N = 528).Footnote 65
Combined with the presence of the never-recognized groups, these relative differences in accountability allow for two main empirical comparisons. First, by comparing invented chiefs and never-recognized communities, I can examine the resource extraction of community-level brokers who are likely to be unaccountable to their voters versus a reference category of communities that largely lack these brokers. Second, by comparing invented-chiefs and always-chiefs communities, I can examine the differential effectiveness of community-level brokers who are relatively more or less accountable.
The theory predicts a clear direction for both main comparisons: communities with colonially invented chiefs should fare worse at securing state resources. The theory is more agnostic about the expected direction of the third possible comparison—between never-recognized and always-chiefs communities. Although the differences in selection institutions documented here indicate that always-chiefs communities have less capture than invented-chiefs communities, chieftaincy positions that date to the precolonial period are still unelected and bottom-up accountability mechanisms remain informal. It is not clear ex ante whether chiefs in always-chiefs groups will be sufficiently accountable overall that the benefits of collective bargaining through a community-level broker outweigh the risks of rent-seeking.
Data Sources
The analysis employs a series of data sources.Footnote 66 First, I examine bloc voting at the community (village) level using geocoded polling-station results from the 2012 and 2016 presidential elections.Footnote 67 As of 2012, polling stations in the rural north had 491 registered voters on average, corresponding to a single community or section of a town. Polling stations are joined with enumeration area–level 2010 census data to calculate demographic characteristics. The census data are 10 percent individual-level random samples of each of 3,945 enumeration areas, also mostly corresponding to individual communities. I approximate demographics of each polling station by taking spatially weighted averages of census characteristics in the vicinity.
Second, I examine individual-level contact with political parties using Afrobarometer data, subsetting to rural respondents in the three northern regions. I rely on the Round 5 (2012; N = 424 in the north) and Round 6 (2015, N = 376) surveys. Both are representative samples of these three regions. I calculate demographic characteristics of the communities in which each respondent resides by linking respondents to their census enumeration areas.
Third, I estimate the contemporary provision of state resources by examining changes in enumeration area–level census data between the 2000 and 2010 censuses. The Ghana Statistical Service used slightly different enumeration area boundaries in each census, even though both were conducted at similar disaggregation. I thus calculate a weighted average of the 2000 data within each 2010 enumeration area boundary, weighting by the proportion of the surface area of each 2000 enumeration area that falls within the 2010 enumeration area.Footnote 68
Chiefs as Brokers
I begin with suggestive evidence that chiefs in Northern Ghana serve as brokers. I show that having a chief predicts vote coordination at the polling-station (community) level and that chiefs appear to allow parties to substitute away from individual-level mobilization. Each result is strongest for groups with invented chiefs, consistent with chiefs who are less accountable to their followers being those best able to compel voters to back a party.Footnote 69 I then turn to the key comparisons of interest.
Bloc Voting by Community
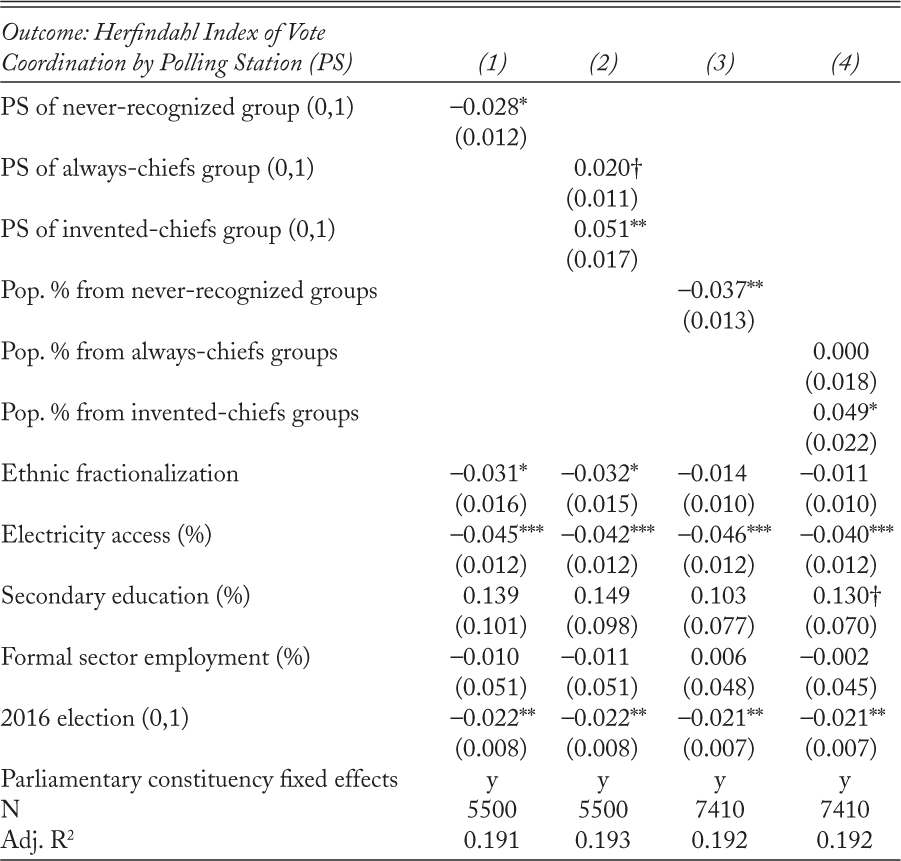
I first examine the clustering of votes in the 2012 and 2016 presidential elections by rural polling station, or community. Clustering indicates bloc voting,Footnote 70 a key component of a broker’s ability to engage in an exchange with a party. The outcome is a Herfindahl index of vote shares at each polling station; scaled from 0 to 1, this is the probability that two randomly selected voters supported the same party.
I estimate two sets of ols models in Table 2. First, to ease interpretation of ecological data, I restrict columns 1 and 2 to communities in which the large majority of the population (≥ 75 percent) is from a single ethnic group. This applies to 74 percent of stations, indicative of the homogeneity of the large majority of rural communities analyzed in this article. The predictor in column 1 is an indicator for whether the polling station is dominated by a group that has never had recognized chiefs. Communities with chiefs are the omitted category. Column 2 flips this: the predictors are communities that always had chiefs or have invented chiefs. In columns 3 and 4, I examine marginal differences in the population proportion of each type of ethnic group using the full sample. All models include parliamentary constituency fixed effects.Footnote 71
Voter Coordination by Polling Station, 2012 and 2016 Presidential Electionsa

significant at † p < .1, ** p < .05, ** p < .01, *** p < .001
a All models are ols with parliamentary constituency fixed effects. Columns 1 and 2 are restricted to polling stations in which one type of ethnic group makes up 75 percent or more of the population. Columns 3 and 4 include all polling stations. Standard errors clustered by the plurality ethnic group at the polling station.
All models also control for underlying demographic characteristics that could affect vote coordination.Footnote 72 Standard errors are clustered by the plurality ethnic group in each community.
In column 1, I find that communities from ethnic groups who do not have recognized chiefs score 2.8 percentage points (p = 0.02) lower on the index of vote clustering than communities dominated by groups with chiefs. By contrast, column 2 shows that communities dominated by groups with invented chiefs score 5.1 percentage points higher (p < 0.01) than communities of groups without chiefs. This is substantively large: 5.1 percentage points on the Herfindahl index is equivalent to the difference between a polling station at which the ndc and npp both received 50 percent of the vote and a station at which one received 65.9 percent and the other 34.1 percent. In addition, column 2 shows that communities of groups who have always had chiefs are also more likely to cluster their votes than those without chiefs, although p = 0.08. Columns 3 and 4 show that similar results hold for marginal differences in population proportions in the full sample from the never-recognized and invented-chiefs groups.Footnote 73
Party Contact and Individual-Level Clientelism
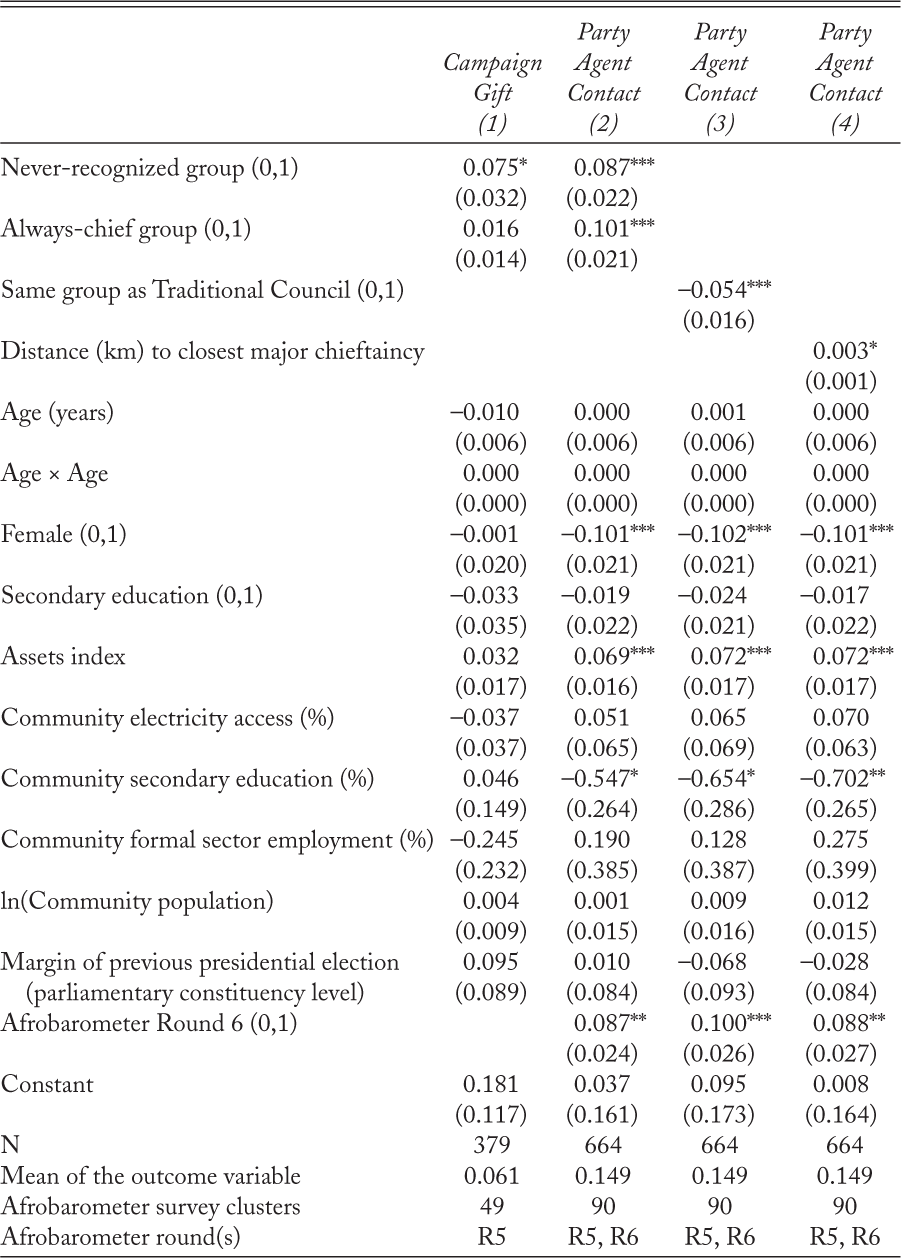
In this section, I examine whether ethnic groups who engage in more bloc voting are also less exposed to individual-level contact with parties, indicating that brokerage via traditional leaders may be substituting for direct mobilization. The unit of analysis shifts to the individual voter. Table 3 focuses on two outcomes: whether Afrobarometer respondents report being offered gifts for their votes and whether respondents report interactions with party agents.Footnote 74 The first is a standard measure of individual-level campaign clientelism.Footnote 75 The second proxies for connections to party networks—the primary channel through which Ghana’s parties engage in individual-level patronage relationships with voters.Footnote 76 These are linear probability models (ols) with standard errors clustered by ethnic group.Footnote 77 I include individual- and community-level controls that could also affect campaign attention, including the margin of the previous presidential election in each respondent’s parliamentary constituency to rule out differences between core versus swing areas.
Party Contact by Chieftaincy Type, Afrobarometer Respondentsa

significant at * p < .05, ** p < .01, ***p < .001
a ols coefficients with standard errors clustered by ethnic group. To ease interpretation, I drop the small minority of respondents who are from southern ethnic groups.
Colonially invented chiefs appear to substitute the most for direct campaigning by parties. Column 1 of Table 3 shows that respondents from never-recognized groups are 7.5 percentage points (p = 0.02) more likely to receive direct offers of vote buying than respondents from groups with invented chiefs (the omitted category). Column 2 shows that respondents from never-recognized groups are 8.7 percentage points (p < 0.001) more likely to have contact with party organizations. This more than doubles the baseline level of contact (8.2 percent) in groups with invented chiefs. Column 2 also shows significantly greater partisan contact for respondents from the always-chiefs groups compared to those with invented chiefs. This result is consistent with the result above: groups who have always had chiefs both coordinate their votes to a lesser degree and receive more direct mobilization.
Column 3 introduces an indicator for whether a respondent is from the same ethnic group as their Traditional Council (Figure 1). Respondents of the same ethnicity as the recognized local chiefs—and thus those most likely to have social ties to these chiefs—are 5.4 percentage points (p = 0.001) less likely to have contact with party agents. Column 4 finds that contact with party agents increases in distance from the seat of a powerful paramount or divisional chief. A respondent 20 kilometers farther away from a community in which a major chief sits is 6.0 percentage points (p = 0.01) more likely to have contact with party agents.
Goods Distribution
I now turn to the key estimates of interest: whether the brokerage role of chiefs benefits voters. For each of the two main comparisons outlined above—invented chiefs versus never-recognized chiefs and invented chiefs versus always chiefs—I find that communities of groups with invented chiefs benefit less from the contemporary distribution of state resources. I begin with descriptive analyses of these comparisons and rule out alternative explanations. I then explore exogenous variation, which provides a better-identified examination of the comparison between the invented-chiefs and never-recognized communities.
The unit of analysis shifts back to the community, proxied by the census enumeration area.Footnote 78 I examine five measures of state resource distribution: (1) the percentage of residents with electricity, one of the main local public goods distributed as government patronage in Northern Ghana;Footnote 79 (2) the percentage of adults with some secondary education, indicative of both government provision of secondary schools, scarce in the north, and provision of scholarships, a common private patronage good; (3) the percentage of residents with access to piped water; (4) the percentage of residents with public employment, which is highly valued; and (5) whether each enumeration area was included in one of the new administrative districts created between 2000 and 2010.Footnote 80 Because they divide local government resources among a smaller group of people, new districts direct a bundle of valuable resources to recipient communities.Footnote 81 Overall, I focus on resources that can only be provided by the state to isolate provision of resources by politicians from the ability of communities to self-provide or coproduce their own smaller-scale resources, as examined by Baldwin.Footnote 82 I include multiple resources to avoid overinterpreting patterns for any specific good.Footnote 83
I examine contemporary flows of resources to capture the ability of communities to extract state benefits during democratic elections. There are long-run inequities in present-day levels, or stocks, of these resources. Because colonial policy empowered chiefs, both sets of groups with chiefs—the always-chiefs and invented-chiefs groups— received more initial state investments than the never-recognized communities did. These patterns continued under Ghana’s postindependence authoritarian governments. The result is that both sets of groups with chiefs had greater stocks entering the contemporary democratic period. I focus on modern flows by examining the 2010 level of each resource, controlling for the 2000 level, to isolate changes in resource provision that happened within a period when chiefs could serve as electoral brokers. These analyses thus explicitly compare communities with the same historically accumulated level of each resource, such that aggregate differences in initial levels across groups cannot account for the results.
I address several potential concerns about using changes on the census as a measure of state distribution. First, in addition to controlling for the 2000 level of each resource in each community, there is little risk of ceiling effects: despite baseline inequities, all groups are poor and have significant need for each resource. Second, differences between the separate comparisons of invented-chiefs versus never-recognized communities and always-chiefs versus never-recognized communities clearly rule out that the results could be due to a simple “catch up” effect, in which ethnic groups who have lower initial stocks on average in 2000 receive more between 2000 and 2010 because of greater need.Footnote 84 Third, all results are robust to controlling for changes in total population. Fourth, where appropriate, the results are robust to examining dichotomous shifts in access—that is, whether a community has any electricity—not just percentage changes in levels (see the supplementary material).Footnote 85
Descriptive Analysis of Distribution
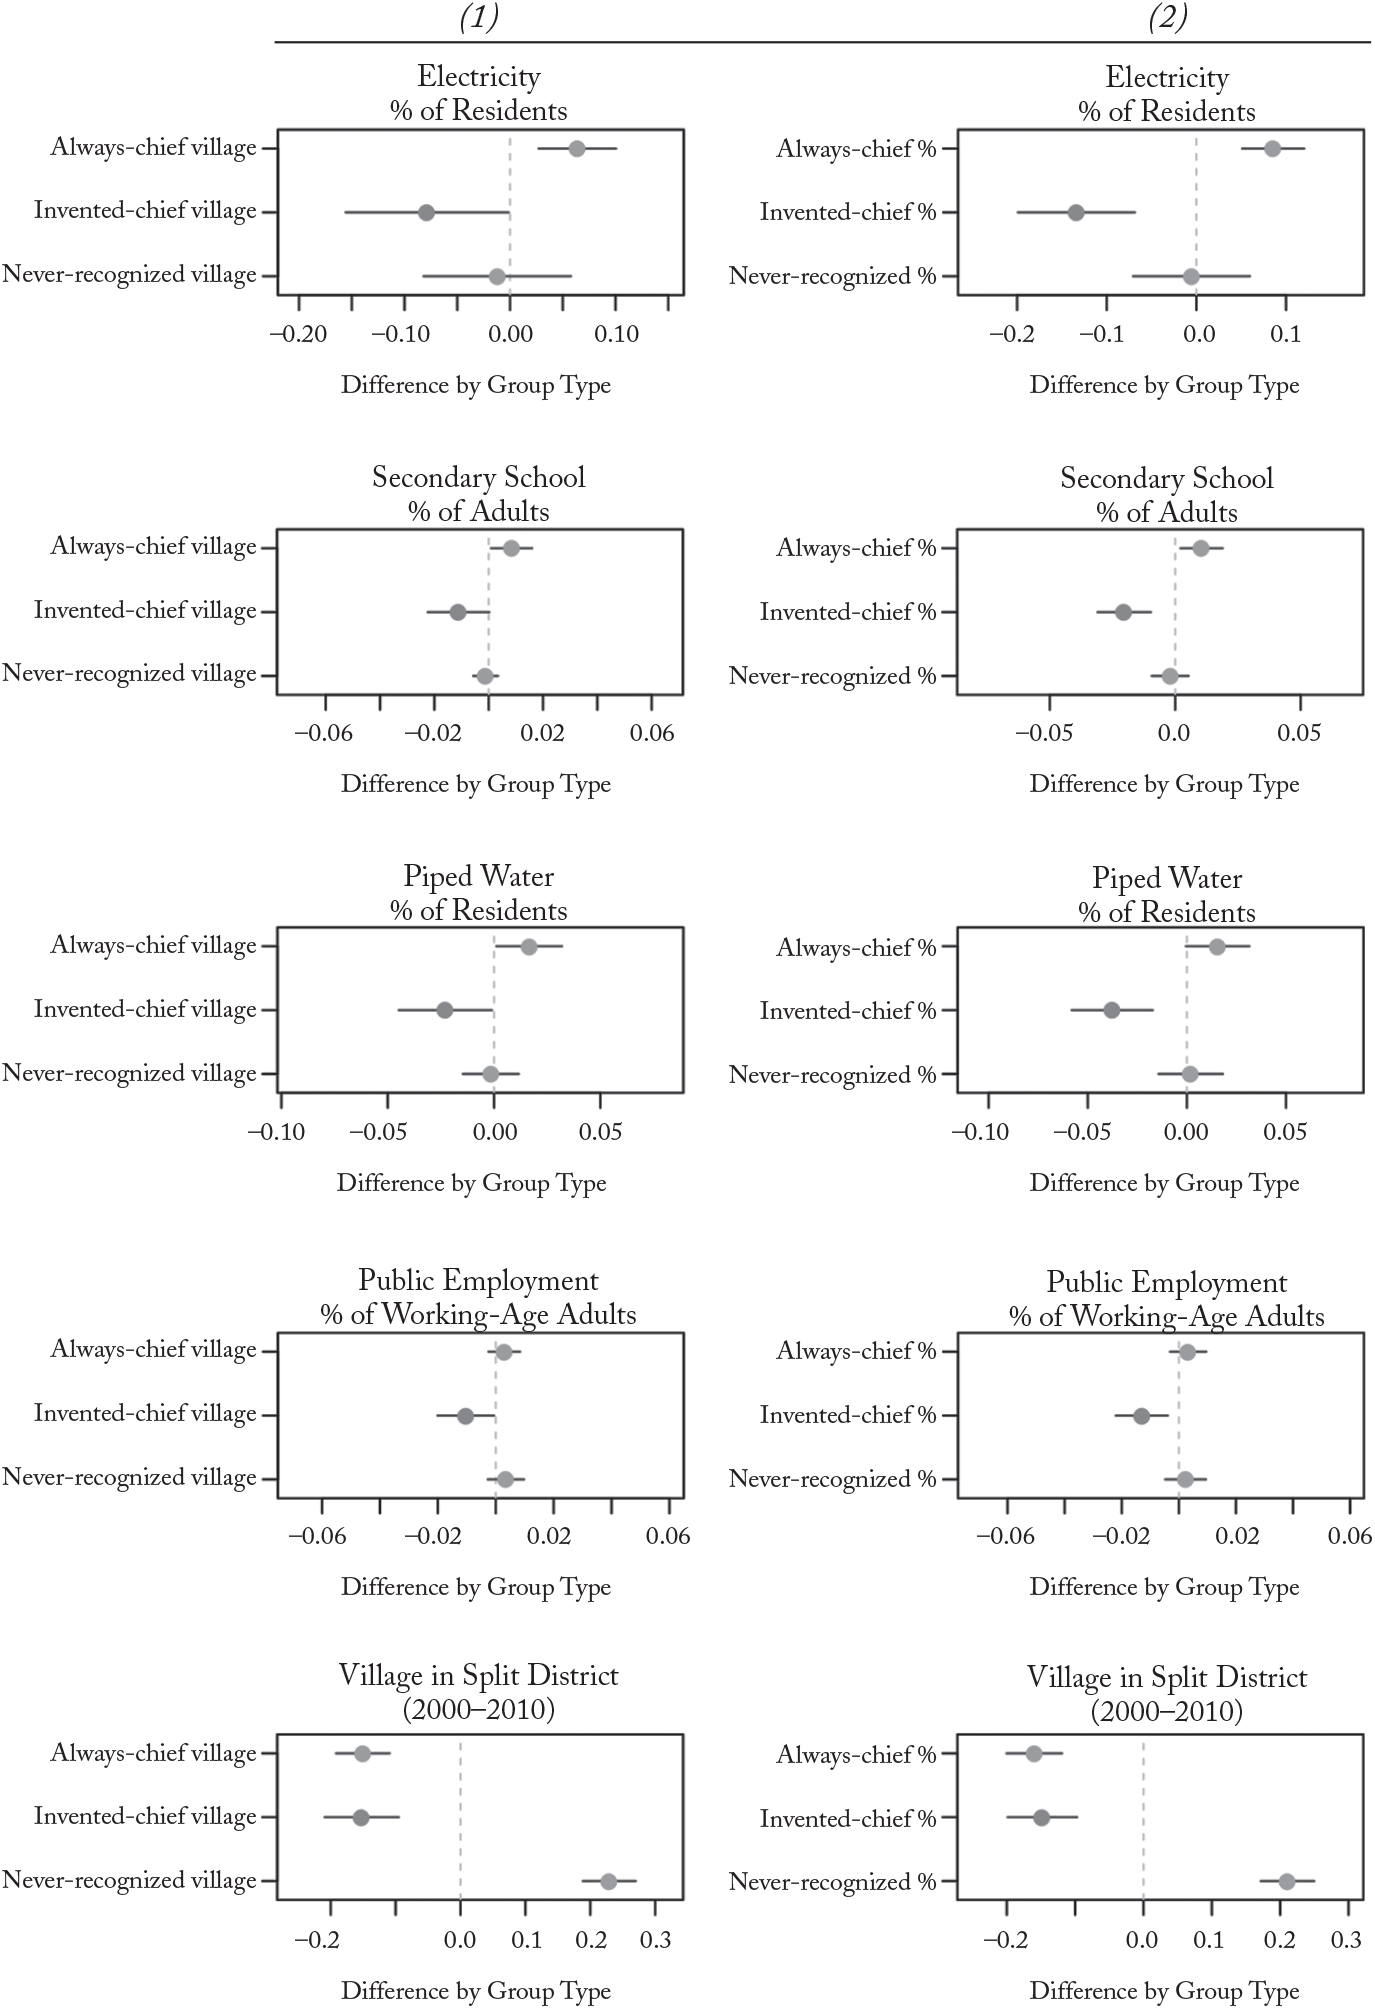
Figure 3 presents coefficients from ols regressions. The outcomes for the first four pairs of plots are the 2010 level of each variable, controlling for the 2000 level in the same community. The outcome in the final pair is an indicator for an enumeration area being included in a new district between 2000 and 2010. Column 1 of Figure 3 restricts (as noted above) to homogeneous communities, and column 2 examines marginal differences in group population shares over the full set of communities. The explanatory variable for each estimate is a measure of the population from each type of ethnic group, with the other two as the omitted categories.
To account for variation in the marginal cost of extending services, I control for the distance to the nearest electrified or piped enumeration area as of 2000 in the analyses for electrification and running water, and the 2000 rate of completed middle school education in the analyses of secondary school access. To account for partisan favoritism, I control for 2000 ndc vote share by parliamentary constituency. To account for community wealth, I control for each community’s level of development as of 2000, measured as electrification and formal sector employment. Other controls include community size (logged 2000 population), each community’s distance to its district capital (the largest town in the area) as of 2000, the index of the overlap between the census maps, and each community’s distance to the hometown of its MP.Footnote 86
Distribution Between 2000 and 2010 by Group Typea

To examine distribution within districts, the first four pairs of plots in Figure 3 include fixed effects for the 2000 district of each community. Districts receive set formula-based allocations of funds from the national government, which are then allocated within districts by local officials of the national ruling party.Footnote 87 Most opportunities for political targeting of local public goods and public patronage jobs are thus within district.Footnote 88 Traditional Councils and administrative districts do not overlap, such that most districts contain a mix of groups with different types of chieftaincy (see the supplementary material).Footnote 89 I instead include region fixed effects for the final outcome because the government assigned the number of new districts to each region proportional to population and then made within-region decisions about boundaries. Standard errors for the first four outcome variables are clustered by the community’s plurality ethnic group.Footnote 90
The key result in both columns of Figure 3 is that communities with larger populations from groups with invented chiefs do significantly worse in contemporary access to each type of resource. These disadvantages are large. The typical community dominated by an ethnic group with invented chiefs saw a 7.9 point smaller increase (p = 0.046) in the percentage of its residents with access to electricity, and was 15.2 percentage points less likely to be included in a new district (p < 0.001), than a community dominated by one of the other two types of groups.
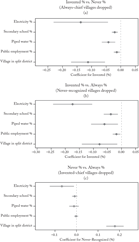
Figure 4 provides head-to-head comparisons.Footnote 91 Panel (a) repeats the models in column 2 of Figure 3 after dropping all communities with majority populations from the always-chiefs groups to isolate a comparison of communities with invented chiefs and those that never have had formal chiefs. Panel (b) drops communities with majority populations from the never-recognized groups to compare groups with invented chiefs and those that always have had chiefs. Consistent with expectations, both panels show that communities with larger populations from invented-chief groups were significantly disadvantaged in access to each resource.
Distribution Between 2000 and 2010, Head-to-Head Comparisonsa

By contrast, there is no consistent pattern in panel (c), the third head-to-head comparison, which looks at communities dominated by groups who have always had chiefs and those that have never had recognized chiefs. Never-recognized communities receive less electricity than always-chiefs communities, but are more likely to be included in new districts. There are no differences for the other outcomes.
Alternative Explanations for the Descriptive Results
I rule out five alternative explanations for these results. First, this is not simply the incumbent (2001–2008) npp government directing resources away from ndc supporters. Invented-chiefs groups are not homogeneously pro-ndc and all models already control for ndc vote share at the parliamentary constituency level and are robust to controlling for constituency-level competitiveness. I cannot measure community-level partisanship in the same time window as the census data because polling station results are not available before 2012. But I use the 2012 and 2016 results to identify communities most likely to have been core ndc strongholds across time as enumeration areas containing polling stations with ndc vote share above the 75th percentile across both elections. All results hold when dropping these most consistent ndc strongholds (see the supplementary material).Footnote 92 This test is imperfect because 2012 and 2016 voting could be outcomes of past distribution. But to the extent that partisan alignment is stable over time, this robustness test suggests that the results hold when subsetting to swing and progovernment (npp) communities only.
Second, access to the state through other channels could explain resource access. As a legacy of their historical dominance, groups who have always had chiefs are more educated, have the greatest representation in the civil service, and had a coethnic as vice president during this period.Footnote 93 But the main differences persist even when dropping communities dominated by the ethnic groups of these vice presidents. Moreover, the overrepresentation of the always-chief groups in the state cannot account for the differences in panel (a) of Figure 4; groups with invented chiefs are also significantly better educated than—and have more than double the civil service representation of—the never-recognized groups, yet received fewer state resources.
Third, even though I restrict to state-provided resources, there could be concern that these differences are still an outcome of each group’s propensity for self-provision via collective action. I measure differences in collective action through Afrobarometer questions on how often respondents come together with their community to solve problems. Opposite of what would need to hold if this alternative were true, groups with invented chiefs are most likely to act collectively, even as they receive the fewest state resources (see the supplementary material).Footnote 94 Moreover, I conduct placebo tests for access to less capital-intensive goods that can be produced by communities on their own without state involvement: boreholes, which Baldwin identifies as a resource that local rural communities can produce themselves,Footnote 95 and whether household trash is collected, a low-cost activity some communities coordinate on their own. Communities dominated by groups with invented chiefs are not disadvantaged in boreholes or trash collection (see the supplementary material),Footnote 96 consistent with the results being distinct from self-provision. It also is not credible that invented-chiefs groups extract fewer resources because chieftaincy succession disputes leave them internally divided; it is inconsistent with the Afrobarometer result for collective action and with the finding that these groups cluster their votes the most.
Fourth, the observed disadvantages of communities populated by invented-chiefs groups are robust to controlling for indicators of other cultural differences: religion (Islam); patrilineal versus other types of inheritance systems, a cultural attribute shown to predict political behavior;Footnote 97 and whether groups traditionally live in compact villages or scattered homesteads,Footnote 98 likely correlated with elements of social structure (see the supplementary material).Footnote 99 The results are also robust to sequentially dropping communities dominated by each individual ethnic group, such that no particular cultural or other feature of a specific group is driving the results (see the supplementary material).
Fifth, I rule out the effects of Northern Ghana’s sporadic, localized, ethnic conflicts using geolocated conflict event data from the Armed Conflict Location and Event Data Project (see the supplementary material).Footnote 100
Instrumenting for Invention: The Annexation of German Togoland
Of course, there may still be unobserved differences between communities with different histories of chieftaincy. The pre-WWI Anglo-German border creates plausibly exogenous variation in the colonial invention of chieftaincy that helps to overcome these inferential challenges for the comparison of the invented-chiefs and never-recognized groups—the key comparison of interest for identifying whether unaccountable brokers limit voters’ ability to secure state resources.
It is not a coincidence that most communities inhabited by groups without recognized chiefs are on what was once the German side of the border between Togoland and the British Northern Territories of the Gold Coast (see Figure 2). The British began inventing chiefs among acephalous groups in the Northern Territories as early as 1902.Footnote 101 The Germans engaged in no similar practices in Togoland.Footnote 102 At the onset of WWI, the British and French expelled the Germans and jointly occupied Togoland, with the colony’s western third coming under British control. Most of British-occupied Togoland was governed separately from the Gold Coast until 1923, and the exact border between the new British and French occupied territories remained ambiguous through multiple negotiations until 1930.Footnote 103 Until the new Anglo-French border was finalized, it remained unclear how many—and which—new ethnic groups would ultimately come under British control.
After the war, British officials decided that rather than creating new chieftaincies, the easiest interim means to administer Togoland was to extend outward the jurisdictions of the chiefs with whom they were already working to the cover the new territory.Footnote 104 By the time administrators from the Northern Territories took full control of the occupied territory, they had been governing through chiefs on their side of the border for decades and were preparing to formalize indirect rule by devolving more administrative duties to Native Authorities.Footnote 105 At this point, there appeared to be little interest in starting over with new chiefs among new ethnic groups. Although almost all precolonially acephalous groups living on the British side had already seen the initial invention of chiefs prior to WWI,Footnote 106 no groups on the German side ever experienced the colonial invention of chieftaincy.Footnote 107
Crucially, assignment to initial British rule relative to assignment to initial German rule appears unrelated to groups’ preexisting characteristics. Similar claims of exogeneity from colonial African borders are common and contested.Footnote 108 But such an assumption is especially plausible here. Much of the Anglo-German border was drawn in 1886, prior to either colonial power having detailed information about local populations.Footnote 109 The final border was settled in 1899—still prior to the formal onset of colonial rule—as a side concession in Anglo-German negotiations over the unrelated Pacific island of Samoa.Footnote 110 This final demarcation largely followed a small river, the Daka, and did not appear to take demographics into account, splitting up existing ethnic communities, including the area’s most powerful precolonial kingdom (the Dagomba). Geographically, the Northern Territories and northern Togoland were largely similar and had shared a precolonial economy. In addition, there are fewer concerns relative to other borders that the Anglo-German border represents a complex bundle of treatments accumulated over the entire subsequent historical experiences on each side.Footnote 111 The border was only fully in effect for fifteen years, at the outset of colonial rule when the colonial footprint on each side remained small. After the British annexed the German territory, groups on both sides were exposed to the same subsequent history of British and then Ghanaian rule.
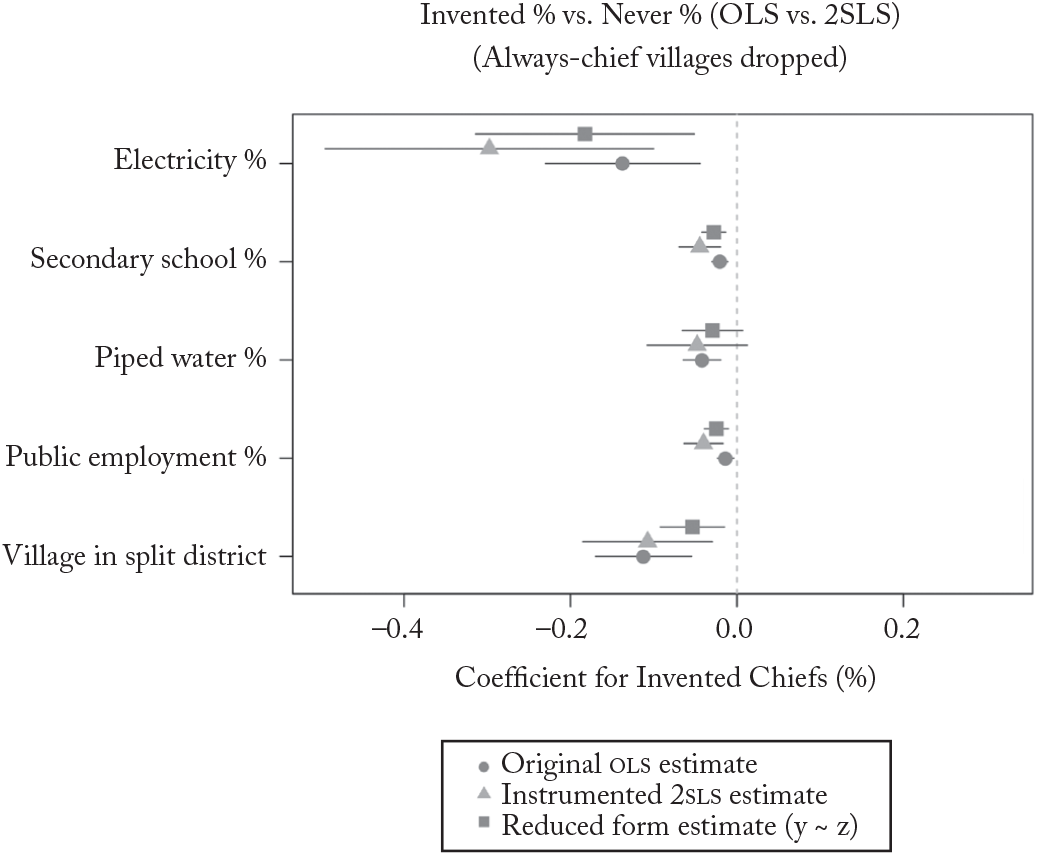
In Figure 5, I leverage this exogeneity to repeat the analysis for a comparison of the invented-chiefs and never-recognized groups shown in Figure 4, again dropping all communities with majority always-chief populations. Figure 5 contains the ols estimates as noted above for the coefficients on the proportion of the population in each enumeration area from an invented-chiefs group. It compares these estimates to coefficients from (1) a new analysis that instruments for each community’s population proportion from invented-chiefs ethnic groups using two-stage least squares (2sls) and (2) reduced form (“intent-to-treat”) models, which are ols regressions of each outcome on the instrument. The analysis remains at the community level with district fixed effects and includes the same controls as noted above, although because the controls are all posttreatment, I also show that the results are robust to excluding them (see the supplementary material).Footnote 112 Standard errors remain clustered in the same manner as in figures 3 and 4.
Comparison of OLS, 2SLS, and Reduced-Form Estimatesa

The treatment in the 2sls models is each community’s population share from ethnic groups with invented chiefs. The instrument is the community’s population share of ethnic groups who had both been pre-colonially acephalous and initially lived entirely on the British side of the Anglo-German border.Footnote 113 Given that the British invented chiefs among almost all precolonially acephalous groups on their side of the border and none on the other side, the first stage relationship between this instrument and the treatment is very strong (see the supplementary material).Footnote 114 The 2sls models estimate a local average treatment effect among “compliers,” which in this case are communities that have larger populations from invented-chiefs groups because they have larger populations from ethnic groups who were once acephalous and had initially lived on the British side of the pre-1914 border.Footnote 115 The reduced form estimates instead provide an overall comparison of groups who initially lived on each side of the pre-1914 Anglo-German border.
I focus both the 2sls and reduced form analyses on the comparison of invented-chiefs and never-recognized communities only. The endogenous selection of always-chiefs groups into chieftaincy in the precolonial period means the new estimates in Figure 5 do not have validity to all ethnic groups; they are estimated among groups who were not centralized precolonial kingdoms, and the effects of chieftaincy may be different among those that were.Footnote 116 Nonetheless, using the pre-1914 border provides better empirical leverage on the assignment of chieftaincy—and by extension, community-level brokers—than previously possible, even if only among this subset of groups. This analysis also matches the first of the two main comparisons of interest as detailed above.
Figure 5 confirms the descriptive result. Communities with larger populations from groups with invented chiefs are disadvantaged in the contemporary distribution of all five types of resources relative to communities populated by groups who mostly lack traditional leaders who could serve as brokers. This is consistent with invented chiefs reducing the benefits voters can extract from politicians relative to not having chiefs. All estimated effects are similar across the ols, 2sls, and reduced-form models, although some estimates for water are no longer significant at the conventional level.
There may be several concerns with using this border as an instrumental variable. First, although it would not have been possible to anticipate the Anglo-German boundary and to strategically sort prior to 1899, groups may have migrated into/out of treatment between 1899 and 1914.Footnote 117 There is no discussion in historical accounts of large population shifts between 1899 and 1914, but there is discussion of migration much later in the twentieth century, with members of never-recognized groups gradually moving west in search of land.Footnote 118 But any cross-border migrations after the annexation of Togoland are not a threat; colonial invention had already finished being assigned. Indeed, later migration is the reason I do not employ the border as a regression discontinuity or compare one side directly to the other.
A second concern is a violation of the exclusion restriction—another reason that a larger population from an acephalous group that had lived on the British side prior to WWI explains present-day differences in resource provision. Although it is untestable, reasoning through this assumption suggests that the instrument is unlikely to affect the outcomes except via the invention of chieftaincy. Figure 5 is robust to including the additional controls from the discussion of alternative arguments, casting doubt on violations related to partisanship, state connections, self-provision, culture, or violence. Moreover, the models for electricity, running water, and secondary school already control for differences in the marginal cost of providing more of each respective resource. Figure 5 also cannot be explained by differences in geography of communities populated by different ethnic groups; the results are robust to controlling for highly localized measures of rainfall, soil quality, and slope (ruggedness) from the United Nations Food and Agriculture Organization (see the supplementary material).Footnote 119 Most important, the 2sls models control for the historically accumulated levels of each resource as of 2000. For these estimates to be valid, the exclusion restriction only must hold after conditioning on 2000 levels. Any remaining exclusion restriction violation would have to influence the 2010 levels of resources independently from the 2000 stocks in each community.
It is not clear what such a violation would be. One possibility is if the Germans created other institutions that also persisted among groups initially living in Togoland. But German rule was brief and had low intensity. Benjamin Talton writes, “[T]here was little interaction overall between the Konkomba [the largest group on the German side] and their German administrators” prior to WWI.Footnote 120 Historical accounts of the areas of northern Togoland that later joined Ghana include no discussion of major social disruptions from Germany’s brief control.Footnote 121 Another possibility is that the British created other institutions prior to WWI that also affect contemporary resource provision among invented-chiefs groups. But the primary reason the British invented chiefs was because they were seeking to govern on the cheap through local elites to keep colonial staffing and activity as limited as possible. Other institution building was sharply constrained in the years before WWI, with “only the feeblest of efforts . . . Made to promote . . . Economic development . . .” in what the British saw as a valueless and burdensome hinterland.Footnote 122 As a result, the British invention of chieftaincy represented by far the most important institutional shift on either side of the border during the first decade-and-a-half of the twentieth century.
Conclusion
Clientelism is usually assumed to be bad for voters.Footnote 123 Indeed, some clientelistic brokers appear unambiguously pernicious: intermediaries like early-twentieth century Chilean landlordsFootnote 124 or monopsonist Russian employersFootnote 125 clearly take advantage of the power they wield, amassing private rents while forcing voters to falsify their electoral preferences. But elsewhere, voters are instead genuinely grateful to their brokers, happy with and voluntarily loyal to electoral intermediaries who provide a lifeline to valuable state resources.Footnote 126
This article examines brokerage in the context of traditional chieftaincy, but the findings have broader implications for explaining what separates these voter experiences. The limitations of invented-chiefs communities to extract state resources relative to the other two sets of ethnic groups in Northern Ghana suggest that how much brokers help or harm voters is tied to brokers’ accountability to their clients. Where brokers wield community-wide authority but are largely insulated from bottom-up pressure (the situation I describe facing many rural Northern Ghanaians with colonially invented chiefs), negative forms of clientelism become more possible, at worst even the more extreme forms of capture shown by Jean-Marie Baland and James Robinson.Footnote 127 But capture should not occur where clients exert real pressure on brokers. Scholars of Argentinian clientelism, for example, describe that many voters can instead easily defect from one broker to another if their current intermediary stops delivering, forcing brokers to either help voters or lose influence.Footnote 128 Ultimately, scholars must more fully incorporate differences across types of brokers into existing theories to better explain how clientelism affects voters.
More indirectly, my findings also suggest that there may be theoretically important variation within and across cases in other important dynamics of brokered politics not examined here, such as how intermediaries exercise influence over voters or how politicians cultivate their brokers. Studies that examine these other aspects of clientelism in a diverse range of cases echo the patterns in Northern Ghana, suggesting that these key features of clientelism will also vary with brokers’ accountability relationships with their own clients.Footnote 129 Future research exploring this variation can expand our understanding of patronage-based politics in the developing world.
Supplementary Material
Supplementary material for this article can be found at https://doi.org/10.1017/S0043887119000030.
Data
Replication data for this article can be found at https://doi.org/10.7910/DVN/SWFNQE.
Acknowledgments
Sarah Brierley; Kim Yi Dionne; Adam Harris; Mai Hassan; Allen Hicken; Eric Kramon; Daniela Osorio Michel; George Ofosu; Tom O’Mealia; Zara Riaz; Robert Schub; Ariel White; the anonymous reviewers for World Politics; and audience members at Columbia University, University of Michigan, Nuffield College Oxford, Vanderbilt University, mgape, mpsa, and mweps provided helpful comments. Thanks to Alhassan Ibn Abdallah, Paul Atwell, Moustafa El-Kashlan, Eve Hillman, and Megan Ryan for research assistance. Thanks in addition to Philomena Nyarko, Rosalind Quartey, and the Ghana Statistical Service, Alexander Essien and the National House of Chiefs, the Electoral Commission of Ghana, and Nahomi Ichino for access to data.
Author
Noah L. Nathan is an assistant professor of political science at the University of Michigan. His research examines political behavior, clientelism, and the development of political parties in sub-Saharan Africa. He can be reached at nlnathan@umich.edu.