This symposium presents 13 articles forecasting the 2012 US national elections. Included in this collection are the eight national and one state presidential vote forecasting models published in PS: Political Science & Politics during the 2008 elections along with three additional forecasts and one article offering a composite of the forecasts. Although the focus remains on the presidential contest, as in past years, several articles extend their scope to cover the congressional elections as well.
While modern election forecasting models have been around for more than three decades (Brody and Sigelman Reference Brody and Sigelman1983; Fair Reference Fair1978; Lewis-Beck and Rice Reference Lewis-Beck and Rice1984; Rosenstone Reference Rosenstone1983; Sigelman Reference Sigelman1979), and 2012 marks the third presidential election in which PS has assembled forecasts, the rationale behind many of the models and the challenges that the models confront may not be well understood—at least it appears that way, judging by some of the commentary of our critics. Before reviewing the 2012 forecasts, it may be useful to step back to put the forecasting enterprise in context so that the forecasts can be reasonably evaluated.
THE RATIONALE AND DIVERSITY OF FORECASTING MODELS
The rationale behind many of the statistical election forecasting models is (1) that we can identify general influences that normally influence the vote (the fundamentals, such as the economy and incumbency), (2) that many of the fundamentals are known and measured before the general election campaign begins, (3) that these fundamentals shape how normal campaigns are likely to affect the vote, and (4) that their typical effects on the vote can be estimated based on the history of past elections. Note that forecasting does not necessarily assume the lack of campaign effects on the vote or that campaigns do not matter. Campaign effects themselves may be shaped by the fundamentals (Campbell Reference Campbell2008). Some models also start from a precampaign public opinion baseline and assess those influences that may affect the development or change in voter preferences during the campaign. Whether using a precampaign public opinion baseline as a starting point or not, this line of reasoning is the foundation of the enterprise. It would not seem to be terribly controversial or particularly mysterious.
Of course, the devil is in the details. The specific factors included as fundamentals, their appropriate indicators, the time over which their typical effects are estimated, the lead time before the election for the forecast, and other choices create a diverse array of models and forecasts. This diversity is often overlooked. A substantial difference (often lost on critics) exists between evaluating election forecasting models as an enterprise and evaluating individual models. Some models are considered more credible than others. Some have longer and stronger track records than others. Some are more consistent with the existing body of voting behavior and campaign effects research. By the same token, there is an important distinction between evaluating each model and its forecast for a particular election. Each election prediction offers a real test of a forecasting model, but as important as it is, it is only a single test.
THE CHALLENGES FOR ELECTION FORECASTING
As one might gather from the common rationale for the models, forecasts confront plenty of challenges. The identification of the fundamentals that affect the vote is likely to be imperfect. The number of predictor variables available for forecasting is limited, and the number of these that have been available long enough so that their typical impact on the vote can be assessed is even more limited. The measurements of these predictor variables are imperfect and may have changed over the years. We know, for instance, that any public opinion indicator, whether presidential approval or candidate preference, has a sampling error as well as other kinds of errors associated with it. Sample sizes, timing of the surveys during the year, instructions to interviewers, question wording and order, and other measurement conditions may have changed over time. Even a variable as seemingly “hard” as the growth in the economy is not definitive at the time of the forecast and undergoes continuing refinement over many years.
Beyond the many possible sources of errors in constructing election forecasting models, every election's campaign has effects on the vote that cannot be anticipated. While the fundamentals of the election condition how voters generally may receive news and candidate messages (whether voters are likely to be receptive, hostile, or neutral toward a candidate), every campaign has its idiosyncrasies. Although the models presume that the campaigns of major party candidates are generally equally well run, one campaign may be more effective than another in any particular election. Even if the models overcame these specification, measurement, and estimation challenges, their forecasts would not be perfectly accurate. Normal campaigns affect turnout and vote choices that cannot be perfectly anticipated. These unanticipated campaign effects are normally small, but are not negligible. Any forecast that predicts the vote on the nose has done so only with a good deal of luck.
Unanticipated modest campaign effects along with issues of data availability, measurement, and specification are among the standard challenges to election forecasting accuracy, but there are always new challenges as well. The financial crisis that developed in the midst of the 2008 election is one. An implicit assumption of election forecasting is that no major idiosyncratic events intervene between the forecast and the vote that divert the election's results from what would be historically expected by the fundamentals incorporated in the models. It does not make sense to predict a normal election based on abnormal elections. For instance, if a candidate resigned in October, one would not reasonably expect the forecast to hold and that election would not be useful in estimating a forecast for future elections. Although the resignation of a candidate is hypothetical, presidential events of similar gravity have historically occurred (including assassinations, attempted assassinations, heart attacks, and terrorist attacks), only not in the middle of the fall campaign—until 2008. The Wall Street Meltdown in late September 2008 sent the economy in an unanticipated spiral that had immediate political consequences unforeseeable by the forecasting models and raises the question of whether 2008 offers useful information for forecasting 2012 and future elections (Campbell Reference Campbell2009; Reference Campbell2010; Reference Campbell2011). On one hand, forecasters would not want to be seen as “cherry picking” data, and one election may not make much of a difference to model estimates. On the other hand, a case like 2008 was so aberrant that it is likely to be more misleading than instructive about how fundamentals affect the vote. What to do with the 2008 election is a real question for forecasters.
Beyond the 2008 election question, the breakdown of the campaign financing system and the rise of the Super PACs, the unprecedented lateness in the scheduling of party conventions, the possibility that Obama's race or Romney's religion are hidden influences on the vote, and the intensifying polarization in the public might also be added by some forecasters to the list of new or fairly recent complications that may need to be considered for 2012.
SOME PERSPECTIVE ON ACCURACY
A cynic might read the laundry list of forecasting challenges, perennial and new, as preparing a featherbed landing for forecasting errors. My intent, however, is not to let forecasts off the hook for errors, but to gain some perspective on these errors. On the one hand, it is silly to dismiss forecasting because forecasts are not perfectly accurate. On the other hand, it is silly to defend errors of all sizes as inevitable because some errors are inevitable. Perfection is not a reasonable standard, and not having a standard is not a reasonable standard.
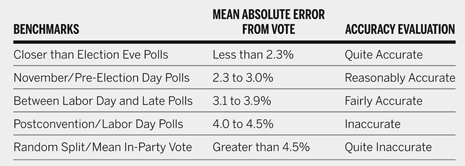
Instead, I suggest that the preference polls (the main competitor of statistical forecasting models) along with the historical distribution of the vote itself provide benchmarks or reasonable standards for evaluating the forecasts. Table 1 uses these to suggest five levels of accuracy. The most accurate forecasts are those that beat the average error of the preference polls in the last week of the campaign. If a forecast made a few months or more out from the election beats the average error of the November and Election Eve polls, the forecast did a great job of predicting the vote. Forecasts within 2.3 percentage points of the two-party popular vote are in this category. If a forecast issued months ahead of the vote does about as well as the very late polls, an error in the range of 2.3 to 3 percentage points of the vote, then the forecast should be judged as reasonably accurate. Forecasts with errors somewhere between the accuracy of postconvention or Labor Day polls and the very late polls should be regarded as fairly accurate. If they fare worse than the post-convention or Labor Day accuracy record, then it would seem fair to judge them as inaccurate. Finally, at the other end of the accuracy spectrum are those less accurate than the average error of a coin-toss or the historical two-party vote division. A forecast that was no more accurate than a coin-toss guess or the average error of guessing the historical two-party vote division for the in-party candidate can be safely evaluated, to put it mildly, as quite inaccurate in predicting that particular election. An error of more than 4.5 percentage points drops a forecast into this league.
Evaluating Presidential Vote Forecasts Relative to Three Benchmarks

THE 2012 PRESIDENTIAL AND CONGRESSIONAL FORECASTS
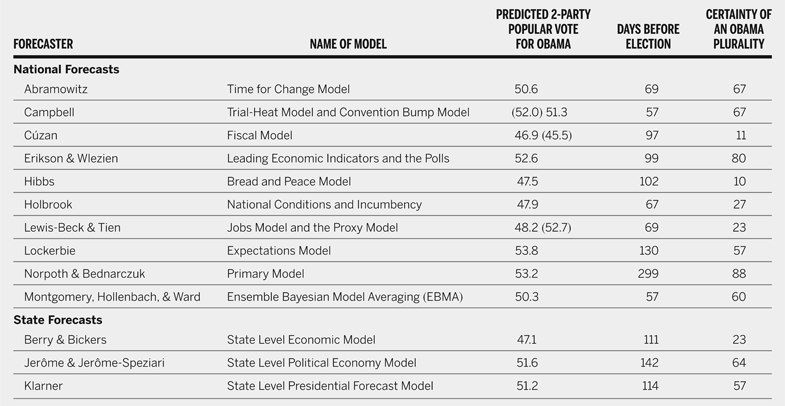
With some perspective provided in how the forecasts might be appropriately evaluated after the dust settles in November, what are the predictions about the voters' verdicts this year? The symposium's 13 forecasts of the presidential vote are presented in table 2. Each forecast presents the percentage of the two-party national popular vote for President Obama, the in-party candidate. The table also indicates how many days before the election the forecast was made and an estimated likelihood that the forecast has identified the candidate receiving a majority of the two-party vote. Five of the forecasts predict that Barack Obama will receive a popular vote plurality (though three of these are on the cusp of predicting a toss up), five predict a popular vote plurality for Mitt Romney, and three regard the election as a toss up. The forecasts range from 53.8% of the vote for Obama to 53.1% for Romney. The median forecast is 50.6% of the two-party popular vote for Barack Obama.
The 2012 Presidential Vote Forecasts
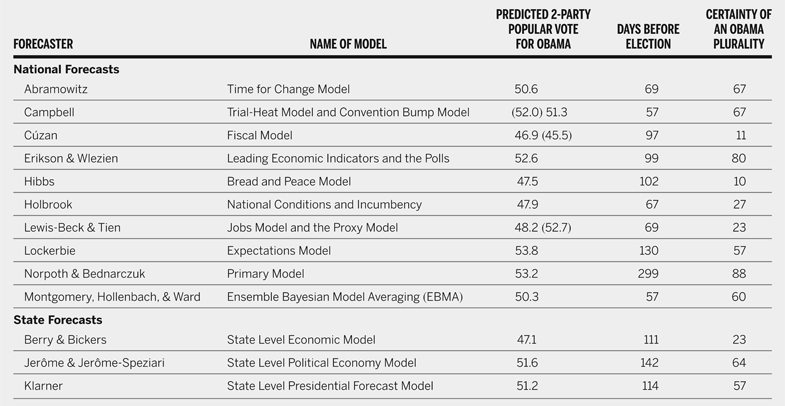
Note: A forecast without parentheses is the preferred forecast. A forecast in parentheses is a secondary or companion forecast.
With the forecasts in, the post-convention campaigns can begin. Fasten your seat belts, it's going to be a bumpy ride.
Symposium Authors
Alan Abramowitz is the Alben W. Barkley Professor of Political Science at Emory University. He can be reached at polsaa@emory.edu.
Michael Bednarczuk is a graduate student at the University of Wisconsin-Milwaukee. His current research focuses on campaign effects and voter mobilization. He can be reached at bednarc2@uwm.edu.
Michael J. Berry is an assistant professor in the department of political science at the University of Colorado, Denver. He can be reached at Michael.Berry@ucdenver.edu.
Kenneth N. Bickers is a professor in the department of political science at the University of Colorado, Boulder. He can be reached at Kenneth.Bickers@colorado.edu.
James E. Campbell is a UB Distinguished Professor of Political Science at the University at Buffalo, The State University of New York. He currently serves as chair of the Political Forecasting Group, a related group of APSA. His research interests center onAmerican macropolitics and electoral change. He is the author of three books and more than 70 journal articles and book chapters. His most recent book is The American Campaign: U.S. Presidential Campaigns and the National Vote. He can be reached at jcampbel@buffalo.edu.
Alfred G. Cuzán is Distinguished University Professor in the department of government in the University of West Florida. He can be reached at acuzan@uwf.edu.
Robert S. Erikson is professor of political science at Columbia University. His research on American elections has been published in a wide range of scholarly journals. He is coauthor of The Timeline of Presidential Elections (Chicago), The Macro-Polity (Cambridge), Statehouse Democracy (Cambridge) and American Public Opinion (Pearson). He is a former editor of the American Journal of Political Science and Political Analysis. He can be reached at res14@columbia.edu.
Douglas A. Hibbs, retired, has been a professor of both economics and political science and has taught graduate courses in applied econometrics, empirical macro-political economy, and macroeconomic theory. He has published five books and dozens of articles in journals in economics, political science, and sociology. An active consultant and occasional university lecturer, Hibbs regards his research on aggregate votes for president as pinning down quantitatively the persistent influence of objectively measured political-economic fundamentals, rather than predicting votes optimally or tracking them statistically after the fact. He can be contacted at douglas@douglas-hibbs.com.
Thomas M. Holbrook is department chair and the Wilder Crane Professor of Government in the department of political science at the University of Wisconsin, Milwaukee. He can be reached at holbroot@uwm.edu.
Florian M. Hollenbach is a PhD candidate at Duke University with a focus in political economy and methods. His current interests are the political economy of taxation, redistribution as well as state capacity and revenue extraction in developing countries. Additional interests include applied statistics and economic development. He can be reached at florian.hollenbach@duke.edu.
Bruno Jerôme is an associate professor in the department of Economics at the University of Paris 2 and member of the Law and Economics Center of Paris 2. He can be reached at bruno.jerome@gmail.com
Véronique Jerôme-Speziari is an associate professor in the department of Management at the University of Paris Sud 11and member of the Paris 2 Laboratory of Management. She can be reached at veronique.jerome@gmail.com.
Carl E. Klarner is an assistant professor in the department of political science at Indiana State University. His research interests include campaigns and elections, state politics, and welfare policy, especially as these three subjects pertain to political and social inequality and reform. He can be reached at Carl.Klarner@indstate.edu.
Michael S. Lewis-Beck is F. Wendell Miller Distinguished Professor of Political Science at the University of Iowa. His interests are comparative elections, election forecasting, political economy, and quantitative methodology. Professor Lewis-Beck has authored or co-authored over 200 articles and books. He has served as Editor of the American Journal of Political Science and of the Sage QASS series (the green monographs) in quantitative methods. He can be reached at michael-lewis-beck@uiowa.edu.
Brad Lockerbie is a professor and chair, department of political science at East Carolina University. He can be reached at Lockerbieb@ecu.edu.
Jacob Montgomery is an assistant professor in the department of political science at Washington University in St. Louis and a Fellow at the Center for Political Economy. His research is in the areas of political methodology and American politics. He graduated with a BA from Wake Forest University with majors in political science and mathematical economics. He earned an MS in statistical science, as well as his PhD (2011) in political science from Duke University. He can be reached at jacob.montgomery@wustl.edu.
Helmut Norpoth is a professor of political science at Stony Brook University. He is coauthor of The American Voter Revisited and has published widely on topics of electoral behavior. His current research focuses on public opinion in wartime. He can be reached at helmut.norpoth@sunysb.edu.
Charles Tien is a professor in the department of political science at Hunter College and The Graduate Center, CUNY. He can be reached at ctein@hunter.cuny.edu.
Michael D. Ward is professor of political science at Duke University. His primary interests focus on developing predictive models of political phenomena. His PhD (1977) is from the home of political science predictions, Northwestern University. Much of his current work focuses on predicting the onset and duration of international crises and domestic events such as rebellion, insurgency, and ethnic and religious violence. In addition, he works on link prediction in the context of the dynamic evolution of social networks. He first learned about forecasting from Kenneth Frank Janda. He can be reached at michael.d.ward@duke.edu.
Christopher Wlezien is professor of political science at Temple University. His research on American and comparative politics has appeared in numerous journals. He is coauthor of The Timeline of Presidential Elections (Chicago) and Degrees of Democracy (Cambridge) and coeditor of a number of other books, including Who Gets Represented? (Russell Sage). He is the former founding editor of The Journal of Elections, Public Opinion and Parties and currently coedits the “Poll Reviews” section of Public Opinion Quarterly. He can be reached at Wlezien@temple.edu.