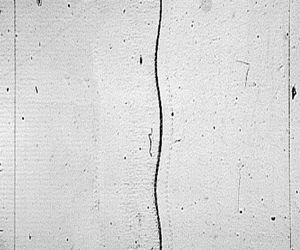

1. Introduction
Richtmyer–Meshkov (RM) instability (Richtmyer Reference Richtmyer1960; Meshkov Reference Meshkov1969) occurs when an initially corrugated interface separating two fluids of different densities is impulsively accelerated by shock waves. It has gained extensive attention for decades due to its crucial role in various industrial and scientific fields such as inertial confinement fusion (ICF) (Nuckolls et al. Reference Nuckolls, Wood, Thiessen and Zimmerman1972; Lindl Reference Lindl1998; Betti & Hurricane Reference Betti and Hurricane2016) and supernova explosion (Arnett et al. Reference Arnett, Bahcall, Kirshner and Woosley1989; Kuranz et al. Reference Kuranz2018). One tremendous obstacle of ICF realization is the occurrence of hydrodynamic instabilities (Lindl Reference Lindl1998), such as the RM instability caused by an impulsive acceleration (generally a shock wave), and the Rayleigh–Taylor (RT) instability (Rayleigh Reference Rayleigh1883; Taylor Reference Taylor1950) induced by a continuous acceleration. Note that the RM instability occurs regardless of the shock direction, whereas the RT instability can only occur when the continuous acceleration is directed from the light fluid to the heavy one. The RM instability is generally served as the seed of the RT instability that develops during the implosion phase (Goncharov Reference Goncharov1999). The RM instability induced by a single shock wave or shock waves propagating in the opposite directions, e.g. incident shock and reflected shock, has been extensively studied (Brouillette Reference Brouillette2002; Zhou Reference Zhou2017a,Reference Zhoub; Zhai et al. Reference Zhai, Zou, Wu and Luo2018b). In both conventional direct- and indirect-drive central ignition schemes of ICF (Goncharov et al. Reference Goncharov, Knauer, McKenty, Radha, Sangster, Skupsky, Betti, McCrory and Meyerhofer2003; Lindl et al. Reference Lindl, Amendt, Berger, Glendinning, Glenzer, Haan, Kauffman, Landen and Suter2004), and most of the innovative ignition schemes (Tabak et al. Reference Tabak, Hammer, Glinsky, Kruer, Wilks, Woodworth, Campbell, Perry and Mason1994; Murakami et al. Reference Murakami, Nagatomo, Azechi, Ogando, Perlado and Eliezer2006; Betti et al. Reference Betti, Zhou, Anderson, Perkins, Theobald and Solodov2007; Zhang et al. Reference Zhang2020), to raise the drive pressure to a magnitude required for ignition while keeping the target shell at a relatively low entropy, a multishock drive scheme is generally employed (Betti & Hurricane Reference Betti and Hurricane2016). However, the RM instability induced by successive shock waves (SSS-RMI) was rarely investigated. How does a double-shocked interface evolve and how to predict its development? What is the dependence of the physical process of the SSS-RMI on the initial conditions? The hydrodynamic mechanisms and dependence on initial conditions remain unclear. These issues motivate the present study.
The SSS-RMI was theoretically considered by Mikaelian (Reference Mikaelian1985), and a simple model which preserves the structure of the impulsive model (Richtmyer Reference Richtmyer1960) was proposed to predict the linear growth of double-shocked interface. It was stated that if the growth rate caused by the second shock exactly offsets the growth rate induced by the first shock, a so-called ‘freeze-out’ phenomenon (the amplitude growth stagnates) may occur. The interaction of two successive shock waves with a free surface of liquid aluminium was numerically investigated (Charakhch'yan Reference Charakhch'yan2000). It was found that if the second shock impact occurs in the linear growth regime of perturbation, the linear superposition model (Mikaelian Reference Mikaelian1985) is valid. However, if the perturbation evolution is at the nonlinear stage when the second shock arrives, the variation of the perturbation growth rate depends weakly on the pre-second-shock amplitude and the initial wavelength. Then an empirical model was proposed to predict the linear growth rate of the double-shocked free surface, and the conditions for achieving the ‘freeze-out’ phenomenon were predicted. The empirical model was verified to be applicable even under conventional shock-tube conditions by considering the interaction of successive shock waves with either air–helium or freon–air interface (Charakhch'yan Reference Charakhch'yan2001). Numerical studies on ejecta emanating from twice shocked liquid metals were performed (Karkhanis et al. Reference Karkhanis, Ramaprabhu, Buttler, Hammerberg, Cherne and Andrews2017; Karkhanis & Ramaprabhu Reference Karkhanis and Ramaprabhu2019). It was found that if the pre-second-shock bubble has reached a nonlinear evolution state, it resembles a shape referred to as ‘flycut’ (semicircle). The shape effects of such a non-sinusoidal interface can be described by using the concept of effective wavelength (Cherne et al. Reference Cherne, Hammerberg, Andrews, Karkhanis and Ramaprabhu2015; Karkhanis et al. Reference Karkhanis, Ramaprabhu, Buttler, Hammerberg, Cherne and Andrews2017, Reference Karkhanis, Ramaprabhu, Cherne, Hammerberg and Andrews2018; Karkhanis & Ramaprabhu Reference Karkhanis and Ramaprabhu2019). The development of a bubble (lighter fluids penetrating heavier ones) can be predicted by the potential flow model proposed by Mikaelian (Reference Mikaelian1998), while the empirical model proposed by Karkhanis et al. (Reference Karkhanis, Ramaprabhu, Cherne, Hammerberg and Andrews2018) that considers both nonlinearity and compressibility provides a good prediction to the terminal growth rate of spike (heavier fluids penetrating lighter ones). Williams & Grapes (Reference Williams and Grapes2017) considered the material spall in the simulations of double-shock ejecta production, and found that pre-second-shock spall failure would occur if the time interval between two shock-wave impacts is long enough. The second shock would be disturbed by the irregular surfaces of the subsurface spalled layers, which may have a significant effect on the development of the surface after it was reshocked.
Experimentally, Dimonte et al. (Reference Dimonte, Frerking, Schneider and Remington1996) firstly observed the SSS-RMI phenomenon. In their experiments, the first shock wave is generated by irradiating a beryllium ablator with strong X-radiation. When the first shock encounters a heavy–light interface, backward moving rarefaction waves are generated. When these rarefaction waves meet the ablation front which is also a heavy–light interface, compression waves are generated and they finally form the second shock which propagates in the same direction as the first shock wave. However, the emphasis was on the high Mach number and high initial-amplitude effects on the interface evolution but less attention was paid to the SSS-RMI. To investigate the ejecta phenomenon on twice shocked metals, Buttler et al. (Reference Buttler2014a,Reference Buttlerb) developed an explosively driven tool that can generate two successive shock waves. Ejecta masses and surface velocities induced by two successive shock waves were measured, and RM bubble and spike dynamics were captured. It was found that mass ejections on twice shocked materials can be attributed to two mechanisms: RM unstable mass ejections and local spallation or cavitation. The tool developed by Buttler et al. (Reference Buttler2014a,Reference Buttlerb) can produce two successive shock waves that are strong enough to melt the metal and create an environment with much higher energy density than that in conventional shock tube. However, the explosive loading shock waves are ‘unsupported’ (Taylor waves), and, therefore, the perturbation development would be affected by rarefaction waves. Also, the development of interface is driven not only by RM instability, but also by the material failure phenomenon (Karkhanis et al. Reference Karkhanis, Ramaprabhu, Buttler, Hammerberg, Cherne and Andrews2017; Williams & Grapes Reference Williams and Grapes2017; Karkhanis & Ramaprabhu Reference Karkhanis and Ramaprabhu2019), which would disturb the second shock and pollute the flow field. Specifically, due to the multiphysical processes involved, the strengths of the first and second shock waves, as well as the time interval between them arriving at the metal target, are difficult to precisely control. In addition, the complicated diagnostic techniques of the experiment can only provide limited information, the interface properties immediately preceding the second shock impact, which are crucial for studying the SSS-RMI, are not available (Karkhanis & Ramaprabhu Reference Karkhanis and Ramaprabhu2019). Until now, an experimental facility for investigating the SSS-RMI is still lacking. As we know, the development of the RM instability is highly sensitive to the initial conditions. Therefore, it is necessary to ensure that the experimental approach is well reproducible in generating two successive shock waves with controllable strengths and the time interval. These also motivate the current study.
In this work, a specific shock tube which contains an additional driver section between the driver and driven sections of the standard shock tube is firstly designed and manufactured. Then shock tube flows without and with an interface are described. The capability of the shock tube for generating two successive shock waves with controllable strengths and time interval is verified experimentally. Finally, experiments on the developments of single-mode light–heavy interfaces with different initial conditions are conducted, and some typical models for predicting single-shocked perturbation growth are examined.
2. Shock-tube design principle and realization
2.1. Design principle and shock-tube details
A sketch of the entire shock-tube facility is shown in figure 1, in which the scales do not exactly reflect the real ones. The main bodies of all the sections of the shock-tube facility are made of steel. To produce two successive shock waves, a driver section (I) together with two identical transparent acrylic devices (acrylic devices I and II), is added between the driver section (II) and the driven section of a standard shock tube. For the driver sections I and II, the acrylic devices I and II and the driven section, the inner cross-section is circular with a radius of 30 mm. Gases in the driver sections II and I (the driver section I and the driven section) are separated by a polyester membrane embedded in the acrylic device II (I). Note that in this work, the gases in all regions are air unless specifically defined. The distance between the polyester membrane embedded in the acrylic device II and the inner end wall of the driver section II and the distance between two polyester membranes are 1750 and 700 mm, respectively. The distance between the polyester membrane embedded in the acrylic device I and the right-hand end of the driven section is 1470 mm. To avoid confusion, the region between the polyester membrane embedded in the acrylic device II and the end wall of the driver section II, and the region between two polyester membranes are hereinafter referred to as the driver section II and the driver section I, respectively.
Sketch of the shock-tube facility for generating two successive shock waves.
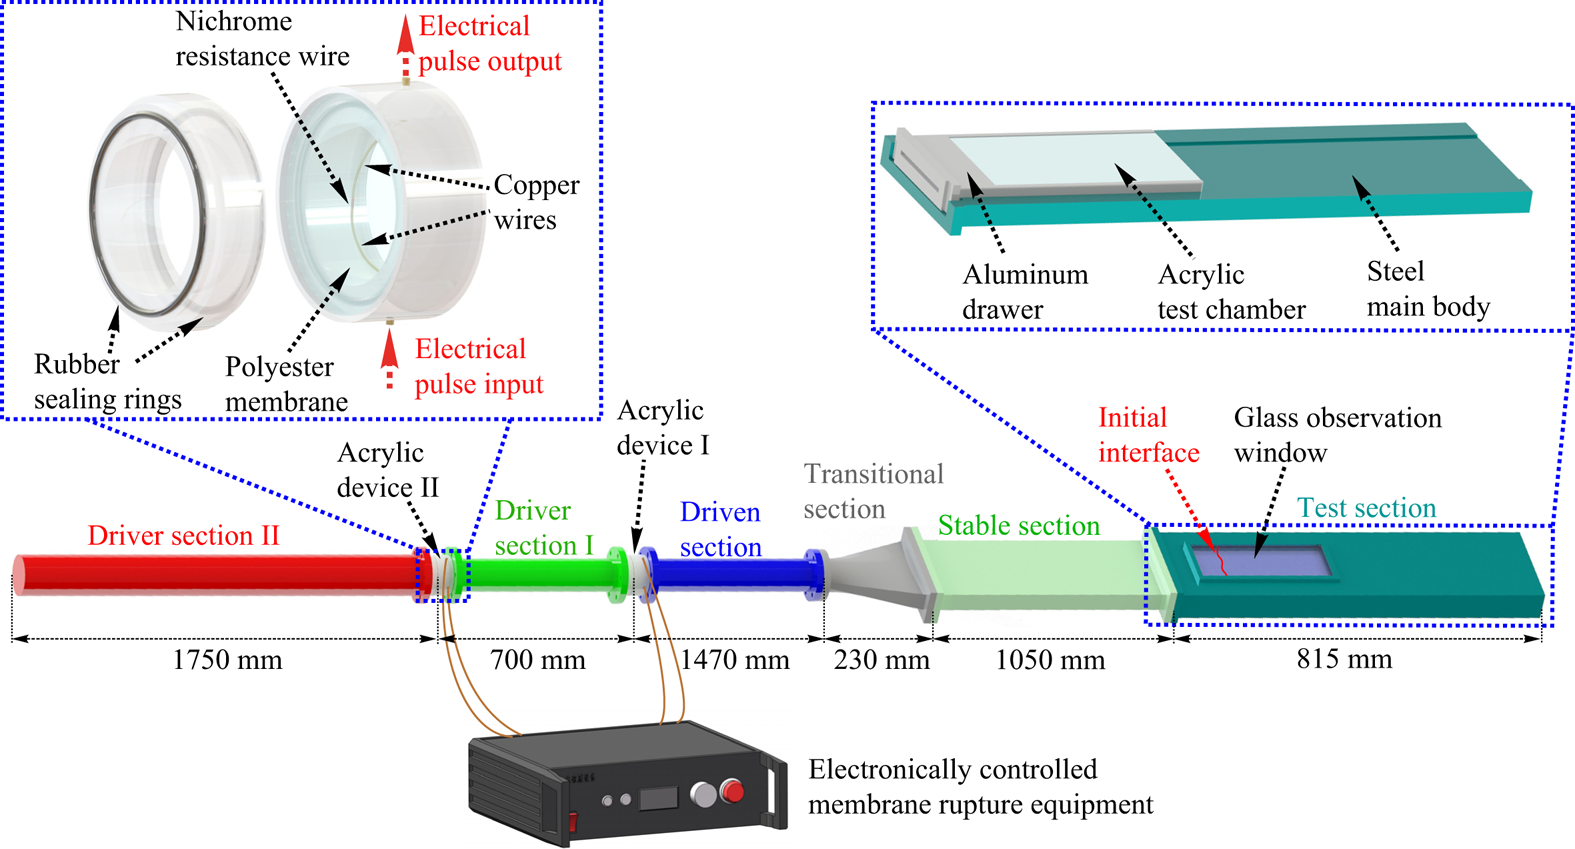
To precisely control the initial Mach numbers of two shock waves, i.e. the initial pressures in two driver sections, and to achieve the synchronous generation of two shock waves, i.e. the synchronization of the rupture of membranes, an electronically controlled membrane rupture equipment (ECMRE) is adopted. The ECMRE is generally used to produce a high-voltage electrical pulse to heat the resistance wire in contact with the membrane, resulting in localized melting of the membrane, reducing its pressure-bearing capacity and thus achieving the rupture of the membrane. Compared with the traditional membrane rupture method, i.e. rupture the membrane directly through the pressure difference across it, an active rupture of the membrane can be realized by the ECMRE, and thus the timing of the membrane rupture and the pressures on both sides of the membrane when it ruptures can be precisely controlled. When the current through the resistance wire is high enough, the resistance wire will explode and the rupture of the membrane with a high quality can generally be achieved. If the blast wave generated by the explosion of the resistance wire is strong, it may introduce additional disturbances to the flow. The ECMRE adopted in the present work can produce two synchronous high-voltage electrical pulses, with output voltage up to 500 V and output current up to 2000 A. To illustrate the experimental set-up more clearly, an enlarged view of the acrylic device II is shown in figure 1. The polyester membrane is placed between the two parts of the acrylic device II and is held by the rubber sealing ring during the experiment. The thickness of the membrane depends on the preset pressure difference across it. Generally, to ensure the success and the repeatability of the experiment, it is desirable that the pressure-bearing capacity of the membrane is close to the preset pressure difference across it. A nichrome resistance wire with its ends connecting to the copper wires of very low resistance is in contact with the membrane. Before each experimental run, we first charge the energy-storage capacitor of the ECMRE to the required voltage. Since the resistances of the nichrome resistance wires attached to the polyester membranes are low (approximately 0.26  $\Omega$) and they are connected in parallel, the voltage selected in experiments is 250 V to avoid the damage to the ECMRE due to the excessive current. Then the ECMRE is triggered to produce two synchronous electrical pulses, causing the explosion of the nichrome resistance wires. When the polyester membranes rupture, two shock waves, two contact surfaces and two rarefaction waves are generated. These shock waves propagate from the driven section to the stable section with a rectangular cross-section of
 $140\,{\rm mm} \times 20\,{\rm mm}$ through a transitional section with a length of 230 mm. Note that in the transitional section where the cross-section changes from circular to rectangular, the cross-section area changes from 2827 to 2800 mm
 $^2$. The area change is negligible and the transition of the cross-section is smooth, which ensure that the intensities of the shock waves would not be significantly affected. The stable section with a length of 1050 mm is adopted to stabilize the shock waves before they enter the test section. In this work, the soap-film technique is adopted to create the initial single-mode interface. A single-mode soap-film interface has a minimum-surface feature (Luo, Wang & Si Reference Luo, Wang and Si2013) and its three-dimensionality is highly related to its height. For investigating a quasi-two-dimensional SSS-RMI phenomenon, the cross-section is changed from
 $140\,{\rm mm}\times 20\,{\rm mm}$ to
 $140\,{\rm mm}\times 6\,{\rm mm}$ at the junction of the stable section with the test section to weaken the three-dimensionality of the soap-film interface generated in experiments. Inevitably, the cross-section truncation will have some effects on the shock intensities and the flow. This will be discussed in Appendix A.
As shown in figure 1, the test section mainly consists of four parts: the steel main body; the glass observation window; the transparent acrylic test chamber; and the aluminium drawer. The length of the test section is 815 mm, which ensures that the rarefaction waves generated when the first shock wave exits the open end of the test section would not affect the development of the interface. The observation window made of K9 optical glass has a width of 95 mm and a length of 275 mm, and its left-hand side is 75 mm away from the junction of the stable section with the test section. The transparent acrylic test chamber is served as the interface formation device when performing experiments with the soap-film interfaces. For the soap-film technique, readers can find more details in our previous works (Liu et al. Reference Liu, Liang, Ding, Liu and Luo2018; Liang et al. Reference Liang, Zhai, Ding and Luo2019).
To investigate the SSS-RMI, there are three key objectives of designing the shock-tube facility. The first is the reliable and repeatable generation of two successive shock waves. The second is the controllable variations of the shock intensities and the time interval between two shock waves arriving at a given position, which are necessary to investigate the effects of different initial conditions on the flow. Intuitively, the shock intensities can be manipulated by changing the pressure ratios across the membranes, and the time interval can be regulated by varying the distance between the initial positions of two shock waves, the distance from the initial position of the first shock to the test section and the intensities of two shock waves. The third is the generation of a relatively ‘clean’ flow field, which means that the interface is accelerated by two shock waves but is not significantly affected by other waves. Note that although the flow just after the rupture of the membranes can be considered as a combination of two standard shock-tube flows, waves and contact surfaces would then interact with each other, making the flow field far complicated than that in a conventional shock tube. As a result, the flow in such a shock tube must be at least qualitatively well understood.
2.2. Shock-tube flow analysis
We first consider the one-dimensional (1-D) shock-tube flow. Figure 2 shows the distributions of flow regions before and after the membranes rupture. Gases in all sections are air. After the membranes rupture, as indicated in figure 2 at  $t=t_1$, two shock waves (SW
 $_1$ and SW
 $_2$), two contact surfaces (CS
 $_1$ and CS
 $_2$) and two rarefaction waves (RW
 $_1$ and RW
 $_2$) are generated, and the flow can be divided into seven regions. In fact, the flow in this shock tube at
 $t=t_1$ can be considered as a combination of two standard shock-tube flows. Therefore, given the initial parameters, including the pressure (
 $p$) and the temperature (
 $T$) in the driven section (region 1), the driver section I (region 2) and the driver section II (region 3), the initial intensities of the two shock waves can be obtained by shock-tube theory (Glass & Hall Reference Glass and Hall1959; Owczarek Reference Owczarek1964; Han & Yin Reference Han and Yin1993)
 \begin{equation} \frac {p_h}{p_l} = \left[1+\frac{2\gamma_l}{\gamma_l+1}(M_{s}^2-1)\right] \left[1-\frac {\gamma_h-1}{\gamma_l+1} \frac {c_l}{c_h}\left(M_{s}-\frac {1}{M_{s}}\right)\right]^{{({-}2\gamma_h)}/{(\gamma_h-1)}}, \end{equation}
where subscript ‘ $h$’ (‘
 $l$’) denotes the flow region with higher (lower) pressure,
 $M_s$ is the Mach number of the shock generated. Here
 $\gamma$ and
 $c$ are the specific heat ratio and sound speed, respectively. Once the shock Mach numbers are known, the flow parameters in regions 4 and 6 (behind the shock waves) can be calculated by normal shock relations ((B1)–(B5) in Appendix B). The flow Mach numbers (
 $M'$) in regions 5 and 7 (behind the rarefaction waves) can also be calculated by shock-tube theory
 \begin{equation} M'=\left[\frac{c_h}{c_l} \frac{(\gamma_l+1)M_s}{2(M_s^2-1)}-\frac{\gamma_h-1}{2}\right]^{{-}1}, \end{equation}
and other flow parameters such as pressure  $p'$, density
 $\rho '$, temperature
 $T'$, speed of sound
 $c'$ and velocity
 $u'$ can be easily deduced by (B6)–(B10) in Appendix B. Superscript ‘
 $'$’ denotes the flow region between rarefaction waves and contact surface.
Distributions of flow regions before and after the rupture of membranes. Here SW refers to shock wave, CS or CR refers to contact surface or contact region and RW refers to rarefaction waves. Superscripts ‘ $r$’ and ‘
 $t$’ denote reflected and transmitted, respectively. Here
 $t_0$ and
 $t_1$ are the moments before and shortly after the membranes rupture, respectively;
 $t_2$ is the moment after the shock SW
 $_2$ interacts with the rarefaction waves RW
 $_1$;
 $t_3$ is the moment after the shock SW
 $_2^{t}$ interacts with the contact surface CS
 $_1$, and after the rarefaction waves RW
 $_1^{t}$ interact with the contact surface CS
 $_2$, and after the rarefaction waves RW
 $_2$ reflect from the end wall. The shade of the colour generally indicates the magnitude of pressure.

However, as time proceeds, the flow in our new facility becomes far more complicated than that in the standard shock tube because there are many wave–wave and wave–contact surface interactions. We first assume that the driver section II is long enough, which allows the first three of four interactions considered below to occur before they are affected by the reflected rarefaction waves (RW $_2^{r}$) of RW
 $_2$ from the end wall.
(I) The interaction of the SW $_2$ with the RW
 $_1$ generates a transmitted shock (SW
 $_2^{t}$), transmitted rarefaction waves (RW
 $_1^{t}$) and a contact region (CR), as shown in figure 2 at
 $t=t_2$. The corresponding
 $x$–
 $t$ diagram is shown in figure 3(a). The intensity of the RW
 $_1^{t}$ is weaker than that of the RW
 $_1$, while the intensity of the SW
 $_2^{t}$ increases gradually during the interaction. As a result, a non-isentropic contact region CR, rather than a contact surface, is generated between the SW
 $_2^{t}$ and the RW
 $_1^{t}$. From region 2 to region 6, the variations of flow parameters satisfy the normal shock relations ((B1)–(B5) in Appendix B), and from region 6 to region 9, the variations of parameters satisfy the isentropic wave relations ((B11)–(B12) in Appendix B). From region 2 to region 5 and from region 5 to region 8, the variations of the flow parameters similarly satisfy the isentropic wave relations and the normal shock relations, respectively. In addition, the pressures and flow velocities at both sides of CR, i.e. regions 8 and 9, are the same. By combining these relations, the intensities of both the SW
 $_2^{t}$ and the RW
 $_1^{t}$ and the flow parameters in regions 8 and 9 can finally be determined.
The  $x$–
 $t$ diagrams of interactions. The interaction of the shock SW
 $_2$ with the rarefaction waves RW
 $_1$ (a); the interaction of the transmitted shock SW
 $_2^{t}$ with the contact surface CS
 $_1$ (b); the interaction of the transmitted rarefaction waves RW
 $_1^{t}$ with the contact surface CS
 $_2$ (c) and the rarefaction waves RW
 $_2$ reflection from the end wall (d).

(II) As the SW $_2^{t}$ moves forward, it interacts with the contact surface CS
 $_1$, generating a transmitted shock (SW
 $_2^{tt}$) and reflected rarefaction waves (RW
 $_{3}$), as shown in figure 2 at
 $t=t_3$. The corresponding
 $x$–
 $t$ diagram is presented in figure 3(b). From region 4 to region 10 (region 8 to region 11), the variations of flow parameters satisfy the normal shock relations (the isentropic wave relations). Combining these normal shock relations, isentropic wave relations with the compatibility relations, the intensities of both the SW
 $_2^{tt}$ and the RW
 $_{3}$ and the flow parameters in regions 10 and 11 can be solved.
(III) As shown in figure 2 at  $t=t_3$, because the driver section II is long enough, the CS
 $_2$ would interact with the RW
 $_1^{t}$ before it is affected by the RW
 $_2^{r}$. The corresponding
 $x$–
 $t$ diagram is presented in figure 3(c). This interaction forms reflected rarefaction waves (RW
 $_1^{rt}$) and transmitted rarefaction waves (RW
 $_1^{tt}$). It is the head of the RW
 $_1^{rt}$ (hRW
 $_1^{rt}$) that may first overtake the SW
 $_2^{tt}$, and its trajectory needs to be determined. As the hRW
 $_1^{rt}$ propagates forward, it will interact with the RW
 $_1^{t}$, CR, RW
 $_{3}$ and CS
 $_1$ sequentially. These interactions can be solved by combining the isentropic wave relations with the compatibility relations across the contact surface or contact region. Although the hRW
 $_1^{rt}$ would be influenced by contact surfaces and waves after it is generated, it is still represented by this symbol in the following text for simplicity.
(IV) The  $x$–
 $t$ diagram of the reflection process of the RW
 $_2$ on the end wall is given in figure 3(d). This process can be solved by combining the isentropic wave relations with the boundary conditions of the end wall.
In this work, unless otherwise specified, the lengths of the driver section I ( $L_{{I}}$) and driver section II (
 $L_{{II}}$) are 700 and 1750 mm, respectively. Provided that the initial flow is stationary, the initial temperature is 293.15 K and the initial pressures in regions 1–3 are 101.325, 202.650 and 379.969 kPa, respectively, the shock-tube flow is solved and its
 $x$–
 $t$ diagram is presented in figure 4. Here, the position of the junction of the driver section I with the driven section is defined as
 $x = 0$ mm, and the moment when the membranes rupture is defined as
 $t = 0\,\mathrm {\mu }$s. The Mach numbers of SW
 $_1$ (
 $M_{s1}$), SW
 $_2$ (
 $M_{s2}$), SW
 $_2^{t}$ (
 $M_{s2}^{t}$) and SW
 $_2^{tt}$ (
 $M_{s2}^{tt}$) are 1.160, 1.144, 1.152 and 1.144, respectively. According to the 1-D gas dynamics theory, the Mach number of the downstream-travelling shock wave (SW
 $_2$) would increase after it interacts with the upstream-travelling rarefaction waves (RW
 $_1$), and would decrease after it interacts with the downstream-travelling contact surface (CS
 $_1$). This leads to the very limited difference between the
 $M_{s2}$ and the
 $M_{s2}^{tt}$. It is found that the flow can be correctly described by figure 2. Under the given conditions, SW
 $_2^{tt}$ would not be overtaken by hRW
 $_1^{rt}$ before it meets SW
 $_1$. The interaction of SW
 $_2^{tt}$ with SW
 $_1$ occurs at
 $x = 3388$ mm when
 $t = 8495\,\mathrm {\mu }$s. As a result, to investigate the SSS-RMI, the initial interface should be located in front of
 $x = 3388$ mm. The initial interface in our experiments is positioned at
 $x = 2918$ mm, and the time interval of two successive shock waves moving to this specific position is approximately 235
 $\mathrm {\mu }$s.
Shock-tube flow without interface. Only partial regions are involved for simplicity.

Provided that the initial flow parameters and the length of the driver section I are identical to those shown in figure 4, if the driver section II is shorter than 1750 mm but still longer than 267 mm, the CS $_2$ would still be affected first by the RW
 $_1^{t}$, and the shock-tube flows are identical to those shown in figure 4. However, if the driver section II is shorter than 267 mm, the CS
 $_2$ would be affected first by the RW
 $_2^{r}$ instead of the RW
 $_1^{t}$. If the driver section II is even shorter than 17 mm, the SW
 $_2$ would be overtaken by the RW
 $_2^{r}$ before it meets the RW
 $_1$. Even so, the flow field can still be solved by combining the normal shock relations, the isentropic wave relations, the compatibility relations across the contact surface or contact region with the wall boundary conditions, although some tedious calculations are sometimes required.
2.3. Experimental results of shock-tube flow
Furthermore, generation of two successive shock waves is realized in the specially designed shock tube as described above. The flow field is monitored using high-speed schlieren photography. The schlieren optical arrangement adopted is identical to the one illustrated in the previous work (Guo et al. Reference Guo, Cong, Si and Luo2022), where readers can find more details. The frame rate of the high-speed video camera (FASTCAM SA5, Photron Limited) is 50 000 f.p.s. with a shutter time of 1  $\mathrm {\mu }$s. The spatial resolution of the schlieren images is 0.38 mm pixel
 $^{-1}$.
Three experimental runs (runs 1, 2, 3) with the same initial parameters as those adopted in the theoretical analysis except the ambient temperature are first performed. The relevant experimental parameters are provided in table 1. The membranes embedded in the acrylic devices I and II have thicknesses of 25 and 30  $\mathrm {\mu }$m, respectively, and their pressure-bearing capacities (approximately 125 and 225 kPa, respectively) are close to the corresponding pressure differences across them (approximately 100 and 175 kPa, respectively). Because the qualitative differences among different runs are very subtle, only the schlieren photographs from the run 1 are provided, as shown in figure 5(a). The definition of the spatial origin is the same as that in the theoretical calculation, whereas the temporal origin is defined as the moment when SW
 $_1$ reaches the preset interface position, i.e.
 $x = 2918$ mm from the junction of the driver section I with the driven section. From the schlieren images, the SW
 $_1$ is quite planar but the SW
 $_2^{tt}$ is slightly convexly curved (
 $t = 616\,\mathrm {\mu }$s) due to the effect of boundary layer behind the SW
 $_1$. In experiments, because the SW
 $_2^{tt}$ moves behind the SW
 $_1$, the boundary layer always exists, and makes the SW
 $_2^{tt}$ convexly curved. Note that a curved shock wave has the characteristic of recovering a flat shape as it moves through a tunnel with a constant cross-section (Ishizaki et al. Reference Ishizaki, Nishihara, Sakagami and Ueshima1996; Bates Reference Bates2004), and this characteristic can be referred to as the self-recovery effect of shock wave. Induced by the self-recovery effect, the amplitude of a curved shock is oscillated, and finally tends to zero if the boundary layer is absent (Ishizaki et al. Reference Ishizaki, Nishihara, Sakagami and Ueshima1996; Bates Reference Bates2004). In other words, the SW
 $_2^{tt}$ may be convexly curved, planar or concavely curved during its propagation. For these three experimental runs, due to the size limitation of the visualization window and the long time interval between two shock waves arriving at the test section, the two shock waves do not display in the schlieren photographs at the same time.
Experimental schlieren photographs of the propagation of two successive shock waves. Numbers represent the time in  $\mathrm {\mu }$s, and the temporal origin is defined as the moment when SW
 $_1$ reaches the preset interface position, i.e.
 $x = 2918$ mm from the junction of the driver section I with the driven section.

Initial parameters and results of experiments without interface. Here  $MT_{I}$ and
 $PBC_{I}$ (
 $MT_{II}$ and
 $PBC_{II}$) are the thickness and the pressure-bearing capacity of the membrane embedded in the acrylic device I (II), respectively.

The  $x$–
 $t$ diagrams of the SW
 $_1$ and the SW
 $_2^{tt}$ from three different runs are shown in figure 6(a). It can be found that the two shock waves move linearly, indicating that their intensities are stable. The Mach numbers of the two shock waves (
 $M_{s1}$ and
 $M_{s2}^{tt}$), as well as the time interval between the two shock waves arriving at the preset interface position (
 $\delta t$) are measured as shown in table 1. The experimental
 $M_{s1}$ (
 $1.182\pm 0.003$ with 0.003 corresponding to the maximum deviation of these shock Mach numbers from the average) is slightly larger than its theoretical counterpart (1.160), which is ascribed to the reduction of the cross-sectional area. The effects of the cross-section truncation on the intensities of two shock waves are discussed in Appendix A. The experimental
 $M_{s2}^{tt}$ (
 $1.106\pm 0.006$) is slightly smaller than its theoretical counterpart (1.144), which should be attributed to the boundary-layer effect and the effect of the shock wave generated by the reflection of SW
 $_1$ from the junction of the stable section with the test section. The time interval
 $\delta t$ varies within the range of
 $658 \pm 30\,\mathrm {\mu }$s in different runs, because the complete synchronization of the rupture of membranes is difficult to achieve in experiments. The attenuation of the SW
 $_2^{tt}$ and the enhancement of the SW
 $_1$ result in a larger
 $\delta t$ in experiment than that in the theoretical prediction.
The  $x$–
 $t$ diagrams of shock waves from experiments without interface: (a), runs 1, 2, 3; (b), runs 4, 5, 6; (c), runs 7, 8, 9.

In the studies of SSS-RMI, the time interval  $\delta t$, which is related to the two shock Mach numbers and the lengths of sections, is crucial. For given
 $L_{{I}}/L_{{II}}$ and the initial pressures and temperatures in sections, the inviscid shock-tube flow is self-similar, i.e. the spatial and temporal coordinates of waves, contact surfaces and contact region are linearly related to
 $L_{{I}}$ or
 $L_{{II}}$, which indicates that
 $\delta t$ can be varied by changing
 $L_{{I}}$ while maintaining the other initial parameters constant. To verify this approach, three additional experiments (runs 4, 5, 6) with the same initial parameters as those in runs 1, 2, 3 except
 $L_{{I}}$ and
 $T$ are conducted. The membranes adopted here are the same as those in the runs 1–3. The schlieren images from run 4 and the
 $x$–
 $t$ diagrams of the shock waves from three different runs are provided in figures 5(b) and 6(b), respectively. Both two shock waves can be observed in the same image at
 $t = 273\,\mathrm {\mu }$s and the intensities of two shock waves are stable. The curvature of the shock SW
 $_2^{tt}$ in the run 4 is more significant than that in the run 1, and it increases gradually within the experimental observation area. Note that due to the limitations of the temporal resolution and the length of the experimental observation area, it is hard to observe all the transition processes of the SW
 $_2^{tt}$ shape variation. As shown in table 1, the Mach numbers of two shock waves (
 $M_{{s1}}$ and
 $M_{s2}^{tt}$) in different runs are measured as
 $1.185\pm 0.007$ and
 $1.093\pm 0.004$, respectively, while
 $\delta t$ varies within the range of
 $395\pm 53\,\mathrm {\mu }$s. The run 6 seems to produce a significantly different
 $\delta t$. Note that for different experimental runs, although the initial pressures in sections and the voltages of the electrical pulses are constant, there are subtle differences in the properties of the membranes (or the resistance wires), such as the thickness (or the resistance), resulting in the slight differences in the time interval and shock Mach numbers among different runs. Given the complexity of the membrane rupture process, the difference in time intervals among different runs is acceptable. As a result, the shock-tube facility is capable of varying
 $\delta t$ by changing
 $L_{{I}}$ while fixing the other parameters constant.
Moreover, through changing the pressure in the driver section II, the variation of the shock intensity is examined. Three additional experiments (runs 7, 8, 9) are carried out, in which the initial parameters are the same as those in runs 1, 2, 3 except  $p_3$ and
 $T$, as shown in table 1. The membrane embedded in the acrylic device I is the same as that in the runs 1–6, whereas the membrane embedded in the acrylic device II has a thickness of 38
 $\mathrm {\mu }$m with a pressure-bearing capacity of approximately 350 kPa. The schlieren images from run 7 and the
 $x$–
 $t$ diagrams of the shock waves are provided in figures 5(c) and 6(c), respectively. The two shock waves can be observed in the same images from
 $t = 84\,\mathrm {\mu }$s to
 $t = 264\,\mathrm {\mu }$s and their intensities are stable. In this case, the observed shock SW
 $_{2}^{tt}$ maintains nearly flat. The Mach numbers of two shock waves (
 $M_{s1}$ and
 $M_{s2}^{tt}$) in different runs are measured as
 $1.176\pm 0.009$ and
 $1.199\pm 0.016$, respectively, while
 $\delta t$ varies within the range of
 $113\pm 6\,\mathrm {\mu }$s. Therefore, the variation of
 $M_{s2}^{tt}$ is realized while maintaining the
 $M_{s1}$ almost unvaried. Relative to the runs 1–6, the uncertainties of the
 $M_{s2}^{tt}$ values are increased in the runs 7–9. Two reasons may account for this disparity. First, the membrane used to separate the gases in the driver sections II and I in the runs 7–9 is thicker than that in the runs 1–6 (see table 1), which increases the uncertainty of the membrane rupture process and thus the uncertainty of the
 $M_{s2}^{tt}$. Second, because the initial intensity of the second shock in the runs 7–9 is stronger than that in the runs 1–6, and the flow behind the first shock is slightly different for runs due to the uncertainty of the first shock intensity, the interactions of the second shock with the contact surface, waves and the boundary layer would introduce a greater uncertainty of the
 $M_{s2}^{tt}$. Even so, we can conclude that the shock intensities and the
 $\delta t$ can be manipulated by changing the pressures in the driver sections and the lengths of the sections, and the first two key objectives of designing the shock-tube facility are achieved.
3. Shock-tube flow with a flat interface
The shock-tube flow with a flat interface is then considered. The initially flat air–SF $_6$ interface is positioned at
 $x = 2918$ mm. The values of
 $\gamma$ for air and SF
 $_6$ are 1.4 and 1.094, respectively. The initial pressure and temperature of SF
 $_6$ gas are set as 101.325 kPa and 293.15 K, respectively, and other initial parameters are the same as those adopted in § 2.2. Before the shock–interface interaction occurs, the shock-tube flow with an interface is identical to that without an interface, as shown in figure 4. Therefore, we will focus on the shock–interface interaction here. The distributions of flow regions shortly before and after the shock–interface interaction occurs are provided in figure 7, and the
 $x$–
 $t$ diagram showing the details of shock–interface interactions is presented in figure 8. As the SW
 $_1$ meets the initial interface (II), a downstream-moving transmitted shock (SW
 $_1^{t}$) and an upstream-moving reflected shock (SW
 $_1^{r}$) are generated. Meanwhile, the single-shocked interface (SSI) starts to move downstream. When the SW
 $_2^{tt}$ meets the SW
 $_1^{r}$, two transmitted shock waves (SW
 $_2^{ttt}$ and SW
 $_1^{tr}$) and a contact surface (CS
 $_3$) are formed. Under the conditions considered, the shock intensities are limited, the flow parameters on both sides of the CS
 $_3$ (regions 18 and 19) are therefore similar. Therefore, the interactions between the CS
 $_3$ and the waves are ignored, i.e. regions 18 and 19 are regarded as one region. When the SW
 $_2^{ttt}$ impacts the interface, a transmitted shock (SW
 $_2^{tttt}$) and a reflected shock (SW
 $_2^{rttt}$) are generated. The SW
 $_2^{tttt}$ will finally overtake the SW
 $_1^{t}$, forming a shock wave, a contact surface and rarefaction waves (RW
 $_4$). Besides, the hRW
 $_1^{rt}$ will sequentially interact with the SW
 $_1^{tr}$ and the SW
 $_2^{rttt}$. It is the head of the RW
 $_4$ (hRW
 $_4$) or the hRW
 $_1^{rt}$ that may first influence the double-shocked interface (DSI) movement. The shock-tube flow with an interface is solved by combining the normal shock relations, the isentropic wave relations with the compatibility relations across the contact surface (region). The Mach number of the SW
 $_2^{ttt}$ (
 $M_{s2}^{ttt}$) is 1.141 and the time interval
 ${\rm \Delta} t$ between the two shock waves impacting the interface is approximately 271
 $\mathrm {\mu }$s. Note that the
 ${\rm \Delta} t$ here is slightly different from the
 $\delta t$ in § 2.2. Because the interface has a velocity after the first shock impact, the
 ${\rm \Delta} t$ is generally greater than the
 $\delta t$. Under the conditions considered, it is the hRW
 $_4$ that first encounters the interface at
 $x = 3040$ mm when
 $t = 8569\,\mathrm {\mu }$s.
Distributions of flow regions before and after the first shock–interface interaction occurs. Here  $t_n$ and
 $t_{n+1}$ are the moments shortly before and after SW
 $_1$ collides with the initial interface (II), respectively;
 $t_{n+2}$ is the moment after SW
 $_2^{tt}$ interacts with SW
 $_1^{r}$;
 $t_{n+3}$ is the moment after SW
 $_2^{ttt}$ interacts with the single-shocked interface (SSI).

The  $x$–
 $t$ diagram showing the details of the shock–interface interactions.

Furthermore, three experiments (runs 10, 11, 12) on the interaction of two successive shock waves with a planar air–SF $_6$ interface are performed. The experimental parameters are the same as those in the theoretical prediction except the gas concentrations on both sides of the interface and ambient temperature. The ambient temperatures for these three runs are 297.0, 297.1 and 297.3 K, respectively. The soap-film technique (Liu et al. Reference Liu, Liang, Ding, Liu and Luo2018; Liang et al. Reference Liang, Zhai, Ding and Luo2019, Reference Liang, Liu, Zhai, Ding, Si and Luo2021) is adopted to generate the planar air–SF
 $_6$ interface, and the details of this interface formation method are ignored. Note that the soap-film interface has a discontinuous feature relative to membrane-free interface (Motl et al. Reference Motl, Oakley, Ranjan, Weber, Anderson and Bonazza2009), and it is easily broken relative to the interface formed by the jelly membrane (Meshkov & Abarzhi Reference Meshkov and Abarzhi2019). The experimental schlieren photographs from the run 10 are shown in figure 9. Here, the temporal origin is defined as the moment when the SW
 $_1$ reaches the mean position of the interface, and similarly hereinafter. The initial interface appears to be thicker due to the presence of the constraint strips used to restrict the soap-film interface (
 $-117\,\mathrm {\mu }$s). We have concluded in our previous work (Wang et al. Reference Wang, Wang, Zhai and Luo2022) that the presence of the constraint strips will introduce non-uniform pressure and velocity fields behind the shock, and inhibit the amplitude growth. The effects of the constrain strips are more pronounced as their heights increase. When the heights of the constrain strips protruding into the flow field are generally less than 10 % of the height of the flow field, the effects of the constrain strips on the shocked flow are limited and can be ignored. In this work, the heights of the constrain strips protruding into the flow field are approximately 6.7 % of the height of the flow field (the height of the constraint strip at each side protruding into the flow is approximately 0.2 mm, and the flow field height is 6 mm), and, therefore, their effects can be ignored. After the SW
 $_1$ encounters the initial interface, the planar SW
 $_1^{t}$, SW
 $_1^{r}$ and SSI are generated (43
 $\mathrm {\mu }$s). Due to the boundary-layer effect, the SSI gradually becomes slightly convexly curved (603–703
 $\mathrm {\mu }$s). Behind the SSI, a planar SW
 $_2^{ttt}$ can be observed (603–703
 $\mathrm {\mu }$s). After the SW
 $_2^{ttt}$ impacts the SSI, the DSI and the SW
 $_2^{tttt}$ can be clearly observed (943
 $\mathrm {\mu }$s), whereas the SW
 $_2^{rttt}$ can be barely observed due to its weak intensity. The DSI is thicker than the SSI, which can probably be attributed to the development of the small random perturbations on the initial interface and the diffusion of the soap droplets.
Experimental schlieren photographs of the interaction of two successive shock waves with an undisturbed air–SF $_6$ interface.

The  $x$–
 $t$ diagrams of interface and shock waves including SW
 $_1$, SW
 $_1^{t}$, SW
 $_1^{r}$, SW
 $_2^{ttt}$ and SW
 $_2^{tttt}$ from experimental runs 10–12, denoted by black, red and blue symbols, respectively, are shown in figure 10(a). All shock waves move linearly, indicating that the intensities of shock waves are stable, although there is a slight difference in
 ${\rm \Delta} t$. Besides, the nearly linear movements of the SSI and the DSI indicate that the interface is not heavily affected by additional waves other than SW
 $_1$ and SW
 $_2^{ttt}$ throughout the experiment, i.e. the flow field is rather ‘clean’, which is crucial for studying the SSS-RMI. As a result, the third key objective of designing the shock-tube facility is achieved. To theoretically calculate the interface velocities, the gas composition at the right-hand side of the initial interface should be determined (the air at the left-hand side of interface is considered as pure). For different experimental runs, the velocities of SW
 $_1$ (
 $u_{s1}=406.3\pm 1.8$ m s
 $^{-1}$) and SW
 $_1^{t}$ (
 $u_{s1}^{t}=176.9\pm 0.4$ m s
 $^{-1}$) are firstly measured. Given the ambient temperature (
 $T=297.1\pm 0.2$ K), the volume fraction of SF
 $_6$ at the right-hand side of the interface (
 $V_{SF_6}=0.93\pm 0.01$) can be determined by matching the
 $u_{s1}^{t}$ according to the 1-D gas dynamics theory. Then the velocity of the SSI (
 $u_{ssi}$) can be theoretically calculated by combining the normal shock relations ((B1)–(B5) in Appendix B) with the compatibility relations across the contact surface. The values of
 $u_{ssi}$ measured from experiments and predicted by 1-D theory are
 $61.3\pm 1.1$ and
 $62.3\pm 1.5$ m s
 $^{-1}$, respectively. Subsequently, by giving the experimental velocity of SW
 $_2^{ttt}$ (
 $u_{s2}^{ttt}=478.1\pm 0.8$ m s
 $^{-1}$) and the flow parameters on both sides of the SSI, the velocities of SW
 $_2^{tttt}$ (
 $u_{s2}^{tttt}$) and DSI (
 $u_{dsi}$) can also be theoretically obtained. The theoretical and experimental values of
 $u_{s2}^{tttt}$ (
 $u_{dsi}$) are
 $232.0\pm 0.3$ and
 $229.4\pm 1.8$ m s
 $^{-1}$ (
 $108.4\pm 0.2$ and
 $106.8\pm 1.0$ m s
 $^{-1}$), respectively. The Mach numbers
 $M_{s1}$ and
 $M_{s2}^{ttt}$ in different experimental runs are measured as
 $1.173\pm 0.005$ and
 $1.121\pm 0.004$, respectively, and
 ${\rm \Delta} t$ varies within the range of
 $769\pm 42\,\mathrm {\mu }$s. The reasons for the discrepancy between theoretical and experimental results are the same as those given in § 2.3.
The  $x$–
 $t$ diagrams of shock waves and interface from experiments on the interaction of successive shock waves with planar interface (a) and single-mode interface (b).

For the SSS-RMI,  $M_{s1}$,
 $M_{s2}^{ttt}$ and
 ${\rm \Delta} t$ are three critical factors to the interface development. The analysis above does not cover all possibilities of this shock-tube facility in varying these factors. If the gas species in both driver sections and driven section are fixed, the variation of
 $M_{s1}$ is quite straightforward by changing
 $p_2/p_1$ provided that SW
 $_1$ would not be affected by waves behind before it encounters the interface. As shown in figures 4 and 8, the second shock would sequentially interact with RW
 $_1$, CS
 $_1$ and SW
 $_1^{r}$ before it encounters the interface. Therefore,
 $M_{s2}^{ttt}$ is related to
 $p_3/p_2$,
 $p_2/p_1$ and interface properties. The variation of
 ${\rm \Delta} t$ is related to many factors, such as
 $p_3/p_2$,
 $p_2/p_1$,
 $L_{{I}}$ and the interface position. In summary, the parameters of the shock-tube facility can be conveniently changed to create different initial conditions for studying the SSS-RMI.
4. The SSS-RMI on a single-mode air–SF $_6$ interface

Developments of a single-mode air–SF $_6$ interface induced by two successive shock wave are investigated experimentally. Four single-mode interfaces with different initial amplitudes (
 $a_0$) and wavenumbers (
 $k$) are adopted, and
 $k a_0$ in all cases is small enough such that the perturbation amplitude is still within the linear growth regime at the arrival of the second shock. The detailed experimental parameters for each case (denoted by
 $\lambda$-
 $k a_0$, where
 $\lambda$ is the wavelength with units of millimetres) are listed in table 2, where
 $A_1^+$ and
 $A_2^+$ are the post-first-shock and post-second-shock Atwood numbers, respectively.
Experimental parameters of interaction of successive shocks with single-mode air–SF $_6$ interfaces. Here
 $A_1^+$ and
 $A_2^+$ are the post-first-shock and post-second-shock Atwood numbers, respectively. The units of velocity, ambient temperature and time are m s
 $^{-1}$, K and
 $\mathrm {\mu }$s, respectively. The different cases are classified by
 $\lambda$-
 $ka_0$, where
 $\lambda$ is the wavelength with the unit of mm.

4.1. Flow features and $x$–$t$ diagrams


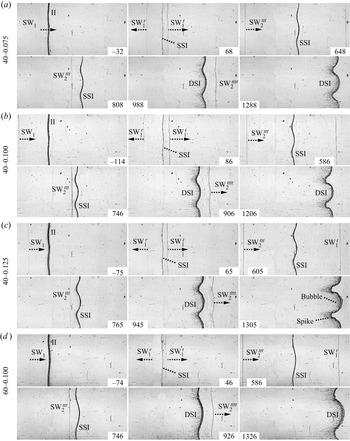
The wave configurations and the developments of the single-mode interfaces accelerated by two successive shock waves are shown in figure 11. We take the case 40-0.100 as an example to illustrate the detailed process. When the SW $_1$ encounters the initial interface, both disturbed SW
 $_1^{t}$ and SW
 $_1^{r}$ are generated. As the SSI moves downward, its amplitude continuously increases induced by baroclinic vorticity and pressure perturbation (86–746
 $\mathrm {\mu }$s). The SSI still maintains a quasi-single-mode shape at the arrival of SW
 $_2^{ttt}$ (746
 $\mathrm {\mu }$s), indicating that the perturbation growth is within the linear regime. After the second shock impact, the DSI and the disturbed SW
 $_2^{tttt}$ can be clearly observed (906
 $\mathrm {\mu }$s). For SSS-RMI on a light–heavy interface, the perturbation growth rates induced by the first and second shock waves have the same sign. Therefore, the post-second-shock interface perturbation evolves significantly faster than the pre-second-shock one. As time proceeds, the high-order modes are generated on the interface and the nonlinearity becomes prominent, causing the asymmetry of the interface (906–1206
 $\mathrm {\mu }$s). For the cases with a small
 $k a_0$ (40-0.075) or small
 $k$ (60-0.100), the asymmetry of the interface is less significant in the late stages. For the case with a large
 $k a_0$ (40-0.125), the interface becomes highly asymmetrical in the late stages, and both the spike and bubble structures are preliminarily formed (1305
 $\mathrm {\mu }$s). These high-quality experiments provide a rare opportunity to examine the linear superposition model and to explore the similarity and difference between single-shocked and double-shocked interfaces in the early nonlinear stages.
Experimental schlieren photographs of the interaction of two successive shock waves with single-mode air–SF $_6$ interfaces: (a) case 40-0.075; (b) case 40-0.100; (c) case 40-0.125; (d) case 60-0.100.

The  $x$–
 $t$ diagrams of shocked interface and shock waves including SW
 $_1$, SW
 $_1^{t}$, SW
 $_1^{r}$, SW
 $_2^{ttt}$ and SW
 $_2^{tttt}$ from different experimental runs are shown in figure 10(b), in which the results of cases 40-0.075, 40-0.100, 40-0.125 and 60-0.100 are denoted by black, red, blue and magenta symbols, respectively. The shock waves and shocked interface move almost linearly, indicating that the intensities of shock waves are stable and the interface is not heavily accelerated or decelerated by additional waves other than the SW
 $_1$ and the SW
 $_2^{ttt}$ throughout the experiment. Relative to the previous experiments (Buttler et al. Reference Buttler2014a,Reference Buttlerb), a rather ‘clean’ flow field is provided in our experiments, and the interface properties immediately preceding the second shock impact and the temporal evolution of the DSI can be obtained. This provides us an opportunity to theoretically analyse the DSI development.
4.2. Linear and nonlinear growths of single- and double-shocked interfaces
Temporal variations of the pre- and post-second-shock perturbation amplitude (a) for different cases are shown in figure 12(a) in dimensional form, since there is no proper method to simultaneously normalize the pre- and post-second-shock perturbation amplitudes. In all cases, the amplitude of the SSI grows almost linearly with only small fluctuation caused by the start-up process (Richtmyer Reference Richtmyer1960; Yang, Zhang & Sharp Reference Yang, Zhang and Sharp1994; Lombardini & Pullin Reference Lombardini and Pullin2009) and measurement errors. In addition, the pre-second-shock amplitude ( $a_2^{-}$) is smaller than 0.1
 $\lambda$, as shown in table 3. In other words, the perturbation amplitude of the SSI is within the linear growth regime at the arrival of the second shock. In order to predict the perturbation growth rate, the initial amplitude of the interface is crucial. As indicated by Wu, Liu & Xiao (Reference Wu, Liu and Xiao2021), the effective initial amplitude of soap-film interface may be slightly smaller than the initial setting value, which should be caused by the minimum-surface feature of the soap-film interface (Luo et al. Reference Luo, Wang and Si2013). For a minimum surface, the perturbation amplitude on its symmetry plane (
 $a_0^s$) is smaller than the amplitude on the upper and lower boundaries. In this work, the three-dimensionality of the interface is weak because the ratio of the interface height (6 mm) to its perturbation wavelength is small, and the average value of
 $a_0$ and
 $a_0^s$ is approximately considered as the effective initial amplitude
 $(a_0^{eff} = (a_0+a_0^s)/2)$. After the
 $a_0^{eff}$ is known, the impulsive model (Richtmyer Reference Richtmyer1960), which has been verified in predicting the linear development of single-mode light–heavy interfaces with small
 $ka_0$ (Liu et al. Reference Liu, Liang, Ding, Liu and Luo2018), is adopted to predict the linear perturbation growth rate of the SSI (
 $\dot {a}_1$),
 \begin{equation} \dot{a}_{1}^t = C_1 k a_0^{eff} A_1^+ u_{ssi}, \end{equation}
where  $C_1$ (
 $= 1 - u_{ssi}/u_{s1}$) is the first shock compression factor. The parameters of the initial interface, and the experimental and theoretical results of
 $\dot {a}_1$ are listed in table 3. The impulsive model provides a good prediction to the experimental growth rate (
 $\dot {a}_{1}^e$) because
 $k a_0^{eff}$ in experiments is small enough.
Temporal variations of pre- and post-second-shock interface perturbation amplitude (a). Comparisons between experimental and theoretical results of dimensionless amplitude of the DSI (b) and dimensionless amplitudes of bubble and spike (c).

Experimental and theoretical results of the interaction of successive shock waves with single-mode air–SF $_6$ interfaces.

After the second shock impact, the interface perturbation first grows at an increasing rate due to the start-up process (Richtmyer Reference Richtmyer1960; Yang et al. Reference Yang, Zhang and Sharp1994; Lombardini & Pullin Reference Lombardini and Pullin2009), and then enters a short linear growth period until the nonlinearity becomes pronounced. To predict the linear perturbation growth rate of the post-second-shock interface DSI ( $\dot {a}_2$), the linear superposition model proposed by Mikaelian (Reference Mikaelian1985) and Brouillette & Sturtevant (Reference Brouillette and Sturtevant1989) is adopted, which can be described as
 \begin{equation} \dot{a}_{2}^t = \dot{a}_{1}^t + C_2 k a_2^{-} A_2^{+}{\rm \Delta} u_2, \end{equation}
where  $C_2$ (
 $= 1-{\rm \Delta} u_2 / (u_{s2}^{ttt} - u_{ssi})$) is the second shock compression factor with
 ${\rm \Delta} u_2=u_{dsi} - u_{ssi}$ being the velocity jump of interface induced by the second shock. The parameters of the pre-second-shock interface, and the experimental and theoretical results of
 $\dot {a}_2$ are listed in table 3. The linear superposition model slightly overestimates the experimental values. Note that although the SSI perturbation is still within the linear growth regime when the second shock impact occurs,
 $k a_2^{-}$ is larger than 0.1. Therefore, the high-amplitude effect of pre-second-shock interface should be considered, and the linear superposition model can be modified as
 \begin{equation} \dot{a}_{2}^{mt} = \dot{a}_1^t + C_{r} C_2 k a_2^{-} A_2^{+}{\rm \Delta} u_2, \end{equation}
where superscript ‘ $mt$’ denotes modified theoretical results,
 $C_{r}$ (
 $= 1/[1+(k a_2^{-} /3)^{4/3}]$) is the reduction factor introduced by the high-amplitude effect (Dimonte & Ramaprabhu Reference Dimonte and Ramaprabhu2010). The results show that the modified linear superposition model well predicts the linear perturbation growth rate of the post-second-shock interface.
As nonlinearity becomes significant, the perturbation growth rate of the DSI starts to decrease gradually. Up to now, SSS-RMI still lacks rigorous nonlinear theory, and only a few attempts have been made on extending the nonlinear theory of single-shocked interface to double-shocked interface (Karkhanis et al. Reference Karkhanis, Ramaprabhu, Buttler, Hammerberg, Cherne and Andrews2017; Karkhanis & Ramaprabhu Reference Karkhanis and Ramaprabhu2019). These attempts provide an opportunity to explore the similarity and difference in the nonlinear evolution law between single-shocked and double-shocked interfaces. The model proposed by Zhang & Guo (Reference Zhang and Guo2016) (ZG model) has been verified to be applicable for predicting the nonlinear evolution of single-shocked single-mode light–heavy interface with small  $k a_0$ (Liu et al. Reference Liu, Liang, Ding, Liu and Luo2018). In this work, the ZG nonlinear model is adopted to predict the nonlinear perturbation growth rate of the DSI, which is written as
 \begin{equation} \dot{a}{_{b/s}^{ZG}}(t) = \frac{\dot{a}^e_{2}}{1 + \theta_{b/s} k \dot{a}^e_{2} t}, \end{equation}
where
 \begin{equation} \theta_{b/s}=\frac{3}{4}\frac{(1 \pm A^+_2)(3 \pm A^+_2)}{[3 \pm A^+_2 + \sqrt{2}(1 \pm A^+_2)^{1/2}]} \frac{[4(3 \pm A^+_2) + \sqrt{2}(9 \pm A^+_2)(1 \pm A^+_2)^{1/2}]}{[(3 \pm A^+_2)^2 + 2\sqrt{2}(3\mp A^+_2)(1\pm A^+_2)^{1/2}]}, \end{equation}
with subscripts ‘ $b$’ and ‘
 $s$’ denoting the bubble and spike, respectively. Note that although the SSI is no longer a single-mode interface strictly when the second shock impact occurs, its perturbation is still within the linear growth regime, i.e. the high-order harmonics have negligible effects on the interface development in the weakly nonlinear stages (Liang et al. Reference Liang, Zhai, Ding and Luo2019). Therefore, the ZG model is still applicable. The temporal variations of perturbation amplitude of the DSI in dimensionless form for different cases are shown in figure 12(b). The amplitude and time are normalized as
 $\alpha = k (a - a_2^*)$ and
 $\tau = k \dot {a}^e_{2} (t - t^*)$, respectively, where
 $t^*$ is the moment when the amplitude linear growth of the DSI starts, and
 $a_2^*$ is the corresponding amplitude of the DSI at
 $t=t^*$. Only one theoretical line is shown because the predictions for different cases are almost identical. It is shown that the ZG model provides an excellent prediction to the perturbation development of the DSI, i.e. the model for single-shocked interface is capable of predicting the evolution of double-shocked interface. Moreover, the temporal variations of the amplitudes of both the bubble (
 $\alpha _{b}$) and spike (
 $\alpha _{s}$) in dimensionless form obtained from experiments and predictions from ZG model are compared, as shown in figure 12(c). Still, the ZG model provides good predictions for the amplitude variations of both the bubble and spike.
4.3. Modal analysis
To further explore the similarity between single-shocked and double-shocked interfaces in the weakly nonlinear evolution stages, modal analysis is performed (Liu et al. Reference Liu, Liang, Ding, Liu and Luo2018; Liang et al. Reference Liang, Zhai, Ding and Luo2019). Firstly, the contours of pre-second-shock interface are extracted from the experiments. Since the pre-second-shock perturbation is still within the linear growth regime, the magnitudes of the third harmonic and the other high-order harmonics relative to that of the first harmonic are very small and negligible, and only the amplitudes of the first and second harmonics are provided,
 \begin{equation} \left.\begin{gathered} y_{40-0.075} = 2.081 \cos ({kx}) - 0.244 \cos ({2kx}) \cdots. \\ y_{40-0.100} = 2.219 \cos ({kx}) - 0.226 \cos ({2kx}) \cdots. \\ y_{40-0.125} = 3.476 \cos ({kx}) - 0.487 \cos ({2kx}) \cdots. \\ y_{60-0.100} = 2.894 \cos ({kx}) - 0.232 \cos ({2kx}) \cdots. \end{gathered}\right\} \end{equation}
It can be found that the amplitude of the second harmonic is much smaller than that of the first harmonic, i.e. the fundamental mode still dominates, which further proves that the pre-second-shock interface can be approximately regarded as a single-mode one. Then, the contours of the double-shocked interface before the roll-up structure appears are extracted from the schlieren photographs, and Fourier analysis of the interface contours is performed. Figure 13 shows the temporal variations of the amplitudes of the first and second harmonics. For the cases with a small  $k a_2^{-}$ (cases 40-0.075, 40-0.100 and 60-0.100), the first harmonic amplitude grows almost linearly whereas the second harmonic amplitude grows very slowly at early times, which are similar to the single-shocked interface with a small
 $k a_0$ (Liu et al. Reference Liu, Liang, Ding, Liu and Luo2018). When the nonlinearity becomes significant, the growth rate of the first (second) harmonic amplitude becomes smaller (larger). For the case with a relatively large
 $k a_2^{-}$ (case 40-0.125), the amplitude of the second harmonic grows faster than that in the cases with a small
 $k a_2^{-}$.
Temporal variations of the perturbation amplitudes of the first and second harmonics. Lines ‘ZS-Small’ denote the predictions of ZS model for the cases 40-0.075, 40-0.100 and 60-0.100, while lines ‘ZS-Large’ denote the predictions of ZS model for the case 40-0.125.

The nonlinear perturbation solutions proposed by Zhang & Sohn (Reference Zhang and Sohn1997) (ZS model) have been proved to be reliable for predicting the amplitude evolutions of the first two harmonics of single-shocked interface with a small  $k a_0$ (Liu et al. Reference Liu, Liang, Ding, Liu and Luo2018). The amplitudes of the first two harmonics in ZS model can be written as
 \begin{gather} a^{(1)} = C_2 a_2^{-} + \dot{a}^e_{2} t - \tfrac{1}{24} (k \dot{a}^e_{2})^2\left\{[4 (A^+_2)^2+1 ] \dot{a}^e_{2} t^3 + 3 C_2 a_2^{-} t^2\right\}, \end{gather}
 \begin{gather}a^{(2)} ={-} \tfrac{1}{2} A^+_2 k (\dot{a}^e_{2} t )^2 + \tfrac{1}{12} k^3 (\dot{a}^e_{2})^2 [ 4 (A^+_2)^3 (\dot{a}^e_{2})^2 t^4 + 3 A^+_2 (C_2 a_2^{-} t)^2], \end{gather}
where superscript ‘( $i$)’ denotes the
 $i$th harmonic. The predictions from the ZS model are given in figure 13 for comparison. Note that for the cases with a small
 $k a_2^{-}$, the predictions are almost identical, and only the predictions for the case 40-0.075, denoted as ‘ZS-Small’ in figure 13, are shown to avoid confusion. It can be found that the ZS model reasonably predicts the amplitude developments of the first two harmonics, especially at the early times. For the case 40-0.125 with a large
 $k a_2^{-}$, the predictions denoted as ‘ZS-Large’ deviate from the experimental counterparts throughout the experiment. As we know, the ZS model was derived based on the assumption that the postshock perturbation amplitude is small. In other words, the accuracy of the ZS model is sensitive to the postshock perturbation amplitude (Zhang & Sohn Reference Zhang and Sohn1997). The post-second-shock perturbation amplitude in the case 40-0.125 is relatively larger (
 $C_2 k a_2^{-} = 0.478$) than that in other three cases (
 $C_2 k a_2^{-}\thicksim 0.3$). As a result, the ZS model provides a worse prediction of the experimental results for the case 40-0.125 than other three cases.
In summary, for the SSS-RMI on a light–heavy interface, provided that the second shock impact occurs when the first-shocked interface perturbation is still within the linear growth regime, the linear superposition model, the ZG and ZS models are still reliable to predict the linear, nonlinear and modal evolutions of the double-shocked interface, respectively, when the pre-second-shock interface perturbation is small. When the pre-second-shock perturbation is relatively large, the linear superposition model considering the high-amplitude effect and the ZG model are still valid. However, the ZS model provides relatively poor predictions to the modal evolution. These results indicate that if the first-shocked interface perturbation is within the linear growth regime at the arrival of the second shock, the double-shocked interface behaves similarly to the single-shocked single-mode interface provided that the latter has the same postshock amplitude and the linear growth rate as the former. For double-shocked interface, the second shock provides an additional perturbation velocity field to the original perturbation velocity field introduced by the first shock impact. The validity of the linear superposition model indicates that the linear superposition of these two perturbation velocity fields is satisfied. As a result, a double-shocked interface evolves similarly to a single-shocked interface as long as their postshock amplitudes and linear growth rates are the same.
5. Conclusions
A specific shock-tube facility that can produce two successive shock waves is firstly designed. An additional driver section is placed between the driver and driven sections of the standard shock tube to produce an additional shock wave. An electronically controlled membrane rupture equipment is adopted to achieve the synchronous generation of two shock waves and to control the shock intensities. After the membranes rupture, the flows without and with an interface are theoretically solved by combining the shock relations, the isentropic wave relations with the compatibility relations across the contact surface (region). Besides, shock-tube experiments without and with a plane interface are performed. The results show that the initial intensities of two shock waves and the time interval between them can be well controlled. The plane interface moves linearly before and after the second shock impact, indicating that the interface is not heavily affected by additional waves other than two primary shock waves. In other words, the flow field is ‘clean’, which is crucial to investigate the RM instability induced by two successive shock waves.
Then shock-tube experiments on the development of a single-mode interface accelerated by two successive shock waves are performed. Four single-mode interfaces with different initial amplitudes ( $a_0$) and wavenumbers (
 $k$) are adopted, and
 $k a_0$ in all cases is small enough to ensure that the first-shocked perturbation amplitude is within the linear growth regime at the arrival of the second shock. The schlieren images obtained by the high-speed video camera clearly show the wave configurations and interface morphologies. The perturbation growth after the first and second shock impacts are obtained. When the pre-second-shock perturbation amplitude (
 $a_2^-$) is small, the linear perturbation growth rate after the second shock impact can be well predicted by the linear superposition model. If
 $a_2^-$ is relatively large, the linear perturbation growth rate of the double-shocked interface can also be predicted by the modified linear superposition model considering the high-amplitude effect. In the weakly nonlinear stages, the nonlinear growth rate can be well predicted by the model proposed by Zhang & Guo (Reference Zhang and Guo2016), no matter
 $a_2^-$ is small or large. Through the modal analysis, the model proposed by Zhang & Sohn (Reference Zhang and Sohn1997) only provides a good prediction to the modal evolution when
 $a_2^-$ is small. These results indicate that if the first-shocked perturbation amplitude is within the linear growth regime at the arrival of the second shock, the double-shocked interface behaves similarly to the single-shocked single-mode interface provided that the latter has the same postshock amplitude and the linear growth rate as the former, because the perturbation velocity fields induced by two primary shock waves can be linearly superimposed.
In following studies, we will focus on the perturbation growth when the second shock impact occurs in the nonlinear growth regime of the first-shocked single-mode interface. In addition, the development of a heavy–light perturbed interface accelerated by two successive shock waves will be investigated. Because phase inversion exists for a heavy–light arrangement after a single shock impact, diversified phenomena will be introduced, depending upon the moment of the second shock impact and the relative intensities of two shock waves. Moreover, the shock intensities are weak in the present work, and the dependence of SSS-RMI phenomenon on the shock intensities will be investigated by using electronically controlled membrane rupture equipment with a higher output current for manipulating the shock intensities.
Funding
This work was supported by the National Natural Science Foundation of China (nos. 12022201, 12102425 and 91952205) and Youth Innovation Promotion Association CAS.
Declaration of interests
The authors report no conflict of interest.
Appendix A. Effects of the cross-section truncation on the shock waves and flow
The cross-section truncation from  $140\,\textrm {mm} \times 20\,\textrm {mm}$ to
 $140\,\textrm {mm}\times 6\,\textrm {mm}$ will inevitably have some effects on the shock intensities and the time interval. In this Appendix, to explore the effects of the cross-section truncation on the shock waves and the flow, the inviscid numerical solver VAS2D (two-dimensional vectorized adaptive solver) (Sun & Takayama Reference Sun and Takayama1999), which has been well validated in shock–body interactions (Zhang et al. Reference Zhang, Si, Zhai, Luo, Yang and Lu2016; Wang et al. Reference Wang, Zhai, Luo, Yang and Lu2017; Wang, Zhai & Luo Reference Wang, Zhai and Luo2021) and shock–interface interactions (Zhai et al. Reference Zhai, Si, Luo and Yang2011, Reference Zhai, Wang, Si and Luo2014, Reference Zhai, Liang, Liu, Ding, Luo and Zou2018a; Zhai, Ou & Ding Reference Zhai, Ou and Ding2019), is adopted to simulate the shock-tube flow with the cross-section truncation. By comparing the numerical results with the 1-D theoretical results, the effects of the cross-section truncation can be highlighted. The computational domain is shown in figure 14, in which
 $z$-axis represents the direction perpendicular to the observation window. The inlet (outlet) condition is applied to the left-hand (right-hand) boundary, while the solid-wall conditions are applied to the other boundaries. The scales in the figure do not reflect the real ones. Since the complete simulation of the entire shock-tube flow is very time consuming, only part of the flow region from
 $x = 2250$ to
 $x = 3565$ mm (the end of the test section) is numerically simulated, and the numerical simulation is initialized based on the 1-D theoretical results at
 $t = 6800\,\mathrm {\mu }$s. Note that the experimental observation area ranges from
 $x = 2850$ to
 $x = 3050$ mm, and the cross-section truncation is positioned at
 $x = 2750$ mm. The initial postshock flow is regarded as uniform. According to the grid convergence validation in our previous works (Wang & Zhai Reference Wang and Zhai2020; Wang et al. Reference Wang, Zhai and Luo2021), the initial mesh size of 0.2 mm and the finest mesh size of 12.5
 $\mathrm {\mu }$m in the positions where greater density gradient exists are applied. For the shock-tube flow without interfaces, the gas in all regions is air. For the shock-tube flow with an air–SF
 $_6$ interface, the gas in the regions with
 $x < 2918$ mm (
 $x > 2918$ mm) is air (SF
 $_6$).
Computational domain for simulating the shock-tube flow with the cross-section truncation.

We first consider the shock-tube flow without interfaces. Figure 15 shows the numerical schlieren images (top half) and the corresponding pressure contours (bottom half) in the vicinity of the cross-section truncation (from  $x = 2725$ to
 $x = 2775$ mm). When the SW
 $_1$ reaches the position of the cross-section truncation, a reflected shock (RS
 $_1$) is generated. Although the wavefront of the SW
 $_1$ quickly recovers to a planar one, the pressure field behind it is non-uniform (6900–6955
 $\mathrm {\mu }$s). When the SW
 $_2^{tt}$ just enters this region (7195
 $\mathrm {\mu }$s), it is quite flat, indicating that the flow in front of it is relatively uniform. When the SW
 $_2^{tt}$ passes across the position of the cross-section truncation, a reflected shock (RS
 $_2$) is generated, and the wavefront of the SW
 $_2^{tt}$ is significantly disturbed (7230
 $\mathrm {\mu }$s) and has not recovered to a flat shape before it exits (7270
 $\mathrm {\mu }$s). Besides, the pressure field behind it appears to be rather non-uniform (7230–7270
 $\mathrm {\mu }$s). To illustrate the states of the SW
 $_1$ and the SW
 $_2^{tt}$ after they enter the experimental observation area, the numerical schlieren images (top half) and the corresponding pressure contours (bottom half) at three different positions in the experimental observation area are provided in figure 16. It can be found that both the SW
 $_1$ and the SW
 $_2^{tt}$ are quite flat. Although the pressure fields behind the SW
 $_1$ and the SW
 $_2^{tt}$ are non-uniform, the pressure variations are small relative to the mean postshock pressures.
The numerical schlieren images (top half) and the corresponding pressure contours (bottom half) in the vicinity of the cross-section truncation from  $x = 2725$ to
 $x = 2775$ mm.

The numerical schlieren images (top half) and the corresponding pressure contours (bottom half) when the shock waves SW $_1$ (a) and SW
 $_2^{tt}$ (b) reach three different positions in the experimental observation area.

Comparison of the  $x$–
 $t$ diagrams of the shock-tube flow without interfaces between the numerical simulation considering the cross-section truncation and the 1-D theory is shown in figure 17, in which the solid and dashed lines represent the numerical and 1-D theoretical results, respectively. Note that the average values at the upper boundary and the symmetry plane of the computational domain are provided in the numerical simulation. The SW
 $_1$ in the numerical simulation moves faster than that in the 1-D flow after it passes through the position of the cross-section truncation, which indicates that the intensity of the SW
 $_1$ is enhanced. The SW
 $_2^{tt}$ in the numerical simulation moves slower than that in the 1-D flow before it reaches the position of the cross-section truncation, because it is decelerated by the RS
 $_1$. Due to the mass conservation, the flow velocity at the right-hand side of the cross-section truncation is larger. As a result, the velocity of the SW
 $_2^{tt}$ in the numerical simulation suddenly increases, and becomes larger than that in the 1-D flow after it passes through the position of the cross-section truncation. In the experimental observation area, both the SW
 $_1$ and the SW
 $_2^{tt}$ in the numerical simulation move almost linearly, which is consistent with the experimental observations. Although both the SW
 $_1$ and the SW
 $_2^{tt}$ in the numerical simulation move faster than those in the 1-D flow, the time interval between two shock waves arriving at the preset interface position (
 $\delta t$) in the numerical simulation (238
 $\mathrm {\mu }$s) is only slightly longer than that in the 1-D flow (235
 $\mathrm {\mu }$s). As a result, the cross-section truncation will not induce a great disparity of
 $\delta t$ between experiments and the 1-D theory in this work.
Comparison of the  $x$–
 $t$ diagrams of the shock-tube flow without interfaces between the numerical simulation considering the cross-section truncation and the 1-D theory.

Furthermore, a parameter  $\phi = M^{trun} - M^{1\text{-}D}$ is introduced to quantify the effects of the cross-section truncation on the intensities of shock waves, where
 $M^{trun}$ and
 $M^{1\text{-}D}$ denote the shock Mach numbers in the numerical simulation and the 1-D flow, respectively. Here
 $\phi _1$ (
 $\phi _2$) corresponds to the Mach number difference of the SW
 $_1$ (SW
 $_2^{tt}$) between the numerical simulation and the 1-D flow. As shown in figure 18(a), both the SW
 $_1$ and the SW
 $_2^{tt}$ in the numerical simulation are enhanced due to the cross-section truncation, and the intensity of the SW
 $_1$ is promoted more significantly. Note that the intensities of the SW
 $_1$ and the SW
 $_2^{tt}$ in the numerical simulation are continuously varied in small magnitudes. Because the SW
 $_1$ (SW
 $_2^{tt}$) in the numerical simulation has already become quite planar when it enters the experimental observation area, the variation of its Mach number should be caused by the non-uniform pressure field behind (in front of and behind) it. To illustrate the non-uniformity of the pressure field, a parameter
 $\psi = (p - p_{ave})/p_{ave}$ is introduced to measure the variation of the pressure, where
 $p$ is the pressure in front of or behind the shock wave and
 $p_{ave}$ is the average value of the corresponding maximum and minimum pressures in the experimental observation area. Figure 18(b) provides the variations of the pressures behind the SW
 $_1$, in front of and behind the SW
 $_2^{tt}$, denoted by
 $\psi _1$,
 $\psi _2^i$ and
 $\psi _2^b$, respectively. In the numerical simulation, although the pressure field is non-uniform, the relative magnitudes of the pressure fluctuations are small (less than 2 %). Therefore, the flow fields in the vicinity of the SW
 $_1$ and the SW
 $_2^{tt}$ can be approximately regarded as uniform.
Variations of  $\phi$ (a) and
 $\psi$ (b) within the experimental observation area for the shock-tube flow without interfaces.

Comparison of the  $x$–
 $t$ diagrams of the shock-tube flow with an air–SF
 $_6$ interface within the experimental observation area between the numerical simulation considering the cross-section truncation and the 1-D theory is shown in figure 19. Although the cross-section truncation would affect the intensities of shock waves and thus affect when and where the shock–shock and shock–interface interactions occur, the main flow characteristics between the numerical simulation and the 1-D theory are consistent. The shock waves and interface in numerical simulation move almost linearly, which are consistent with the observations in experiments.
Comparison of the  $x$–
 $t$ diagrams of the shock-tube flow with an air–SF
 $_6$ interface within the experimental observation area between numerical simulation considering the cross-sectional area truncation and the 1-D theory.

Similarly,  $\phi$ is adopted to quantify the effects of the cross-section truncation on the intensities of shock waves.
 $\phi _1$ (
 $\phi _2$) corresponds to the Mach number differences of the SW
 $_1$ and the SW
 $_1^{t}$ (SW
 $_2^{tt}$, SW
 $_2^{ttt}$ and SW
 $_2^{tttt}$) between the numerical simulation and the 1-D theory. The variations of
 $\phi$ within the experimental observation area are shown in figure 20(a). The interaction of the SW
 $_2^{tt}$ with the SW
 $_1^{r}$ has limited effect on the magnitude of
 $\phi _2$. For the interaction of a shock with an air–SF
 $_6$ interface, the Mach number of the transmitted shock is higher than that of the incident shock. Therefore, the difference between shock intensities would be amplified due to the interaction of the shock with the interface. However, the magnitude of the variation is limited. Moreover,
 $\psi$ is adopted to illustrate the non-uniformity of the pressure field. The variations of
 $\psi$ within the experimental observation area are shown in figure 20(b), in which
 $\psi _1$,
 $\psi _2^i$,
 $\psi _2^b$ and
 $\psi _{in}$ denote the pressures behind the first shock (SW
 $_1$ and SW
 $_1^{t}$), in front of and behind the second shock (SW
 $_2^{tt}$, SW
 $_2^{ttt}$ and SW
 $_2^{tttt}$) and at the interface (SSI and DSI), respectively. Although the pressures in the vicinity of the shock waves and the interface vary continuously, the relative magnitudes of the pressure fluctuations are small (less than 2 %). Therefore, the flow fields in the vicinity of shock waves and interface can be approximately regarded as uniform.
Variations of  $\phi$ (a) and
 $\psi$ (b) within the experimental observation area for shock-tube flow with an air–SF
 $_6$ interface.

Appendix B. Common theories
Normal shock relations:
 \begin{gather} u_j=u_i \pm \frac {2 c_i}{\gamma_i+1} \left(M_s-\frac {1}{M_s}\right), \end{gather}
 \begin{gather}p_j=p_i\left(\frac {2\gamma_i}{\gamma_i+1}M_s^2-\frac {\gamma_i-1}{\gamma_i+1}\right), \end{gather}
 \begin{gather}\rho_j=\rho_i\frac {(\gamma_i+1)M_s^2}{(\gamma_i-1)M_s^2+2}, \end{gather}
 \begin{gather}T_j=T_i\frac {[2\gamma_i M_s^2-(\gamma_i-1)][(\gamma_i-1)M_s^2+2]} {(\gamma_i+1)^2M_s^2}, \end{gather}
 \begin{gather}c_j=c_i\left(\frac {T_j}{T_i}\right)^{{1}/{2}}, \end{gather}
where subscript ‘ $j$’ (‘
 $i$’) denotes the flow region behind (in front of) the shock wave.
Shock-tube theory:
 \begin{gather} p'=p_h\left(1+\frac {\gamma_h-1}{2} M'\right)^{{({-}2\gamma_h)}/{(\gamma_h-1)}}, \end{gather}
 \begin{gather}\rho'=\rho_h\left(1+\frac {\gamma_h-1}{2} M'\right)^{{({-}2)}/{(\gamma_h-1)}}, \end{gather}
 \begin{gather}T'=T_h\left(1+\frac {\gamma_h-1}{2} M'\right)^{{-}2}, \end{gather}
 \begin{gather}c'=c_h\left(1+\frac {\gamma_h-1}{2} M'\right)^{{-}1}, \end{gather}
 \begin{gather}u'=M'c'. \end{gather}
Isentropic wave relations:
 \begin{gather} \frac{u_{J}-u_I}{c_I}={\pm}\frac{1}{\gamma\beta} \left[\left(\frac{p_{J}}{p_I}\right)^{\beta}-1\right], \end{gather}
 \begin{gather}\frac{c_J}{c_I}=\left(\frac{p_{J}}{p_I}\right)^{\beta}, \end{gather}
where subscript ‘ $J$’ (‘
 $I$’) denotes the flow region behind (in front of) the isentropic wave.
 $\beta =(\gamma -1)/2\gamma$.