Introduction
A large literature in the sociology of culture focuses on cultural taste as an important ingredient in social life (e.g. Lopez-Sintas and Katz-Gerro Reference Lopez-Sintas and Katz-Gerro2005). Following Bourdieu's (Reference Bourdieu1984: 169) conceptualisation of taste as ‘cultural capital’, it is seen as inherently linked to the reproduction of class-based stratification. Related lines of research view cultural taste as an important factor in identity formation (Côté Reference Côté1996; Howard Reference Howard2000), group boundary maintenance (Lamont and Molnar Reference Lamont and Molnar2002), and the creation of social networks (Lizardo Reference Lizardo2006), but with the exception of studies of youth culture (e.g. Bennett Reference Bennett1999), the literature has largely ignored the influence of lifecourse stage and age on cultural taste. Yet lifecourse should be important given that tastes are influenced by family socialisation, social networks, education, the media and social roles. Moreover, like consumption practices in general, tastes are likely to change over a lifetime (Alderson, Junisbai and Heacock Reference Alderson, Junisbai and Heacock2007; Boden Reference Boden2006; Zukin and Maguire Reference Zukin and Maguire2004). For example, the taste acquisitions and consumptive practices of a teenager trying to fit into a particular high-school clique or suburban scene are likely to be narrowly oriented toward the taste of that group (Gaines Reference Gaines and Epstein1994), and quite different in character and intent from the consumptive practices and tastes of a middle-aged adult whose concerns may be more variously attuned to work, parenting, church, community and other interests and associations.
Similarly, the tastes of older adults may be driven by circumstances specific to old age. A comparison can be drawn with consumption practices in general. While older people remain active consumers, for some old age is a time for shedding the material accumulations of a lifetime. Whether the motivation is to distribute cherished items to family and friends, or the need to scale back when moving to a smaller or shared residence, possessions carry a materiality that must be dealt with in some way (Adloff Reference Adloff2009; Ekerdt and Sergeant Reference Ekerdt and Sergeant2006; Ekerdt et al. Reference Ekerdt, Sergeant, Dingel and Bowen2004; Hurd Reference Hurd2009). At the same time, many possessions have value beyond their manifest functionality. Some are intricately bound up with identity (Giddens Reference Giddens1990: 112) and memory (Csikszentmihalyi and Rochberg-Halton Reference Csikszentmihalyi and Rochberg-Halton1981: 121), which can make their disposal an emotionally charged and delicate process (Price and Arnould Reference Price and Arnould2000; Sherman and Newman Reference Sherman and Newman1977). In the same way, we expect that the creation and maintenance of cultural tastes are influenced by lifecourse circumstances. Tastes, often embodied in material possessions, also carry both practical and more deeply rooted identity functions (Fine and Fields Reference Fine and Fields2008).
An exploration of tastes in old age is particularly important in light of the evidence of both a positive link between cultural taste and social networks (Lizardo Reference Lizardo2006; Relish Reference Relish1997; Witte and Ryan Reference Witte, Ryan, Consalvo, Baym, Hunsinger, Jensen, Logie, Murero and Shade2004), as well as the evidence that social networks are a critical resource for older adults (Uhlenberg and de Jong Gierveld Reference Uhlenberg and de Jong Gierveld2004). This paper presents our exploration of cultural taste among older adults and addresses two specific questions. First, are cultural tastes influenced by old age in a way analogous to the shedding or storing of material possessions? Put another way, is there a concurrent narrowing of tastes among old people or is taste stable across the lifecourse? Second, if there is a narrowing of tastes in old age, what predicts variations in the process?
We examine musical taste specifically because it exemplifies the complex mix of symbolism, materiality and embodiment in cultural taste (Bourdieu Reference Bourdieu1984: 257) and has been seen as a robust indicator of cultural tastes in general (Peterson Reference Peterson2005). To address the research questions, we analysed United States (US) data from the 1982, 1992 and 2002 national Surveys of Public Participation in the Arts (SPPA), a repeated cross-sectional survey. For the interpretation, we draw on cultural-capital theory in the sociology of culture. As shown below, this theory leads to two general expectations: that tastes narrow in later life and are most limited among the oldest-old in each survey cohort; and that education and arts socialisation when young moderates this effect.Footnote 1 The next section examines previous relevant research and presents the hypotheses regarding cultural taste during the final stages of the lifecourse. The data and methods are then described, after which the findings are summarised and their limitations and implications discussed.
Previous research
Musical taste and cultural capital
A wide array of studies in sociology has examined musical taste as a form of cultural capital. Following Bourdieu (Reference Bourdieu1984), the two central premises are that: musical taste (as an indicator of taste in general) is the outcome of one's location in the stratified social system, and that musical taste reinforces that position. The first premise is based on evidence that tastes are learned through family socialisation, friendship-network contacts and educational experiences, all of which have class and/or status-based influences (seeBourdieu Reference Bourdieu1984; Bryson Reference Bryson1996; Coulangeon and Lemel Reference Coulageon and Lemel2007; DiMaggio and Mukhtar Reference DiMaggio and Mukhtar2004).Footnote 2 For example, research has shown that an appreciation of ‘high culture’, either singularly or alongside a wider range of cultural likes, is predicted by higher levels of education and socialisation into those tastes through childhood lessons (e.g. DiMaggio and Mukhtar Reference DiMaggio and Mukhtar2004). The second premise is that taste manifests and reinforces an individual's social position (Bourdieu Reference Bourdieu1984; DiMaggio Reference DiMaggio and Grusky2001: 542), by indicating to others and to individuals self-reflexively whether or not she or he fits in with particular groups and social environments. This latter point relates directly with the larger discussion in sociology and anthropology of ‘symbolic boundaries’ (Lamont and Molnar Reference Lamont and Molnar2002).
When cultural capital is conceptualised as a series of strategies that can be used to negotiate social situations and interpersonal exchanges, tastes become a component of an individual's relational toolkit (DiMaggio Reference DiMaggio1987; Fiske Reference Fiske1987: 62; Swidler Reference Swidler1986). Thus, tastes act as both portable knowledge and a signifier of a person's cultural preferences and experiences, are used in identity shaping and the presentation of the self, and enable individuals to differentiate themselves symbolically and to align with selected others (Fiske Reference Fiske1987: 62; Peterson Reference Peterson2005).Footnote 3
As noted earlier, the literature has little to say about how these processes operate for older adults. Many relationships can be envisaged, for example, the cultural taste patterns of older adults may be important for maintaining health and sociability (Agahi and Parker Reference Agahi and Parker2005). In studies of ageing and the body, health promotion through activity is thought to be one strategy for keeping in good shape, looking and feeling younger, and maintaining good health. In other words, ‘busy bodies’ are less likely to be considered old bodies (Ekerdt Reference Ekerdt1986; Katz Reference Katz2000). Activity, both physical and social, is integral to conceptions of ‘successful ageing’; that is, efforts to avoid the label ‘old’ and the associated exclusion and stigmas (Calasanti Reference Calasanti2005; Chung and Park Reference Chung and Park2008; Hurd and Griffin Reference Hurd and Griffin2007; Katz Reference Katz2000). Because some cultural tastes are embodied, in the sense that attending or participating in public events requires physicality and agency, there may be a relationship between cultural participation and perceptions of worth. Of course, in old age as at other stages of the lifecourse, the luxuries of leisure time, activities and being ‘active’ vary by race, class and gender, as well as health status and whether the individual is in paid work or retired (Calasanti Reference Calasanti2005).
Taste patterns in old age may also be important because of their relationship to social interaction, the mechanism through which tastes are shaped and maintained (Erickson Reference Erickson1996; Mark Reference Mark1998; Witte and Ryan Reference Witte, Ryan, Consalvo, Baym, Hunsinger, Jensen, Logie, Murero and Shade2004). Tastes can prompt interactions in several ways depending on the context. First, some like to meet people with similar tastes because it promotes sociability (Lizardo Reference Lizardo2006). As DiMaggio (Reference DiMaggio1987: 443) put it, ‘culture provides fodder for least-common denominator talk and gives strangers something to talk about, facilitating the sociable intercourse necessary for acquaintances to ripen into friendships’. Because functional, physical and structural limitations, such as institutionalisation, lack of transport and disability may prevent actual cultural participation in old age, the degree to which older adults are familiar with and conversant about various tastes may be an important resource. In later life, the need to interact and talk with others may be heightened in certain settings, such as assisted-living housing, where residents often encounter the same people repeatedly and spend time in common spaces. If the residents of such communities tend to be relatively unchanging, the coming and going of volunteers, staff and visitors brings new faces. Cultural-capital theory predicts that individuals who have relational tools with which they can negotiate both fluid and static relationships are likely to have higher levels of social integration within the community and greater wellbeing, and are better able to transcend the symbolic boundaries of ‘otherness’ associated with old age (Harrison-Rexrode Reference Harrison-Rexrode2009).
A second way in which tastes promote sociability is by prompting engagement with others through organised activities. It has been argued that older adults residing in organised communities are more likely to have better access to leisure and social activities than older adults living in non-organised residential settings (Agahi and Parker Reference Agahi and Parker2005; Walters and Bartlett Reference Walters and Bartlett2009). In this way, participation in activities may be driven by tastes, by the desire to interact with others, or both. Activities organised around tastes provide a time and place for socialising with others who have similar interests, and enable older adults to form replacement relationships as their networks shrink. ‘Cultural tastes are neutral, but their uses are social’ argued DiMaggio (Reference DiMaggio1987: 442). It has been theorised that with increasing age and perceived limitations on time, people begin to disengage from peripheral or weak-tie relationships to focus on emotionally meaningful ones (Carstensen Reference Carstensen1992). So while cultural capital may offer a basis on which to form and maintain relationships, it may also be the case that cultural capital, as a relational tool to negotiate peripheral or weak-tie relationships, may become less important with increasing age. We know very little about the role of cultural capital in social life as it varies by stage of life (but seeGray Reference Gray2009). This latter point is important because networks are dynamic and relatively unstable across the lifecourse, especially in old age (Lizardo Reference Lizardo2006). Loss of ties in old age is a material reality, particularly for women. Older women are more likely than older men to live alone, without a spouse or in an institution. Further, Mark (Reference Mark1998) argued that if a person does not reinforce a taste through social interaction, it will be lost over time. The dynamics of interactions between tastes and social networks in old age are largely unexplored, but it seems that tastes are rooted not only in individual cognitive schema but also have performative and sociability components.
In summary, cultural tastes, depending on the individual's circumstances (e.g. the living arrangement and relationship status), may be important in old age for several reasons, including identity maintenance, sustaining friendship networks, creating new networks and encouraging physical and social activity levels. At the same time, cultural-capital theory leads us to expect some narrowing of tastes in old age. Following Mark (Reference Mark1998), Witte and Ryan (Reference Witte, Ryan, Consalvo, Baym, Hunsinger, Jensen, Logie, Murero and Shade2004) and Lizardo (Reference Lizardo2006), we know that tastes are created and sustained within social networks. Given the evidence of declining networks in old age (Uhlenberg and de Jong Gierveld Reference Uhlenberg and de Jong Gierveld2004) and of declining workforce participation, which limits some types of interactional opportunities, and given increasing physical and financial limitations, cultural tastes may narrow in old age. At the same time, there is considerable evidence that more education and early childhood socialisation into the arts correlate with having a wide array of tastes (DiMaggio and Mukhtar Reference DiMaggio and Mukhtar2004; Lopez-Sintas and Katz-Gerro Reference Lopez-Sintas and Katz-Gerro2005; Peterson Reference Peterson2005). Thus, we expect these characteristics to mitigate the narrowing of tastes with increasing age. Taken together, previous research has documented well the critical relationships between consumption, identity, social networks and ageing. On the one hand, consumptive practices are marketed as tools to delay or ameliorate the effects of ageing, while on the other hand, a lifetime's material and psychological accumulation must sooner or later be dealt with. Tying these insights to those indicating that tastes are created and sustained through social networks, we expect that tastes will narrow in later life. In the next section we explore those dynamics using repeated cross-sectional data.
Methods
The source data and the sample
The data for this paper are from the 1982, 1992, and 2002 SPPA, a repeated cross-sectional survey (National Endowment for the Arts 2003). To emphasise, the respondents are independently sampled each year and not the same as with a panel. In each survey year, people living in the United States of America (USA) aged 18 or more years were eligible to participate, excluding those residing in institutions. In all three years, the samples were compiled using a stratified, multi-stage, cluster design from Census Bureau population counts. Weights were calculated for each year to enable estimates for the US population composition. Here the weights are used in all prevalence estimates but not in the analyses of variance and regressions. The sample sizes were different in each year: 5,608 in 1982, 5,704 in 1992, and 16,724 in 2002. In the successive years, 1,632, 1,731 and 5,298 respondents aged 55 or more years answered questions about their musical tastes.Footnote 4 The response rates varied by year, as well as the proportion of interviews conducted by telephone and by face-to-face interviews.Footnote 5
The respondents were asked about their participation and attendance rates at art events and at musical, dance and play performances, and about the frequency of visits to historical sites, parks and arts-and-crafts events. Questions about art exposure through mass media, arts socialisation and barriers to participation in the arts were also asked in some years. Of particular interest to this study were questions on the musical genres that were liked – those that were specified at the various years are listed in Table 1. For example, respondents were asked, ‘Do you like to listen to classical music?’ All responses were coded ‘yes’ or ‘no’. From these variables, an integer variable was created for the number of likes reported by the respondents. As can be seen by the empty cells in Table 1, there were inconsistencies in the lists of musical genres presented to the respondents in the successive years, but a core set was offered in all three (classical/chamber, opera, jazz, blues/R&B, big band, rock, mood easy, operetta/musicals, country, bluegrass, ethnic, folk and hymns/gospel). Soul music, barbershop, dance and heavy metal appeared in only one year, and the remaining genres (reggae, rap, new age, choral, Latin, and parade) appeared in two surveys. The varying number and mix of genres at the three years was taken into account by examining the relative rather than absolute number of genres chosen in each year.Footnote 6
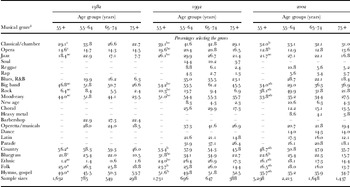
Musical likes by older age groups, USA, 1982, 1992 and 2002

Notes: 1. The respondents selected multiple genres. –: not specified in that year. R&B: rhythm and blues. Significant differences (p<0.05) in the preference prevalence between years (shown only for 55+ years): a 1982 versus 2002; b 1992 versus 2002; c 1982 versus 1992.
Source: US national Surveys of Public Participation in the Arts. For details see text and http://www.cpanda.org/data/profiles/sppa.html (authors' analysis).
Measures of education and of ever having had lessons were also variables in the analysis. Education measures were originally scaled as 19 categories ranging from ‘never attended school’ to ‘six years of college’. We recoded these scores into five categories with a range from ‘1’ for ‘some elementary school education’ to ‘5’ for ‘more than four years of college’. Having lessons was defined as ‘yes’ responses to a family of questions: ‘At any time in your life, have you ever taken (music, visual art, dance) classes?’ ‘Yes’ responses to items for each type of previous art classes were coded as ‘1’ and a new composite variable ‘ever had lessons’ was created.
Analysis
To test for significant differences in the group means for liking each musical genre among the respondents aged 55 or more years in each survey year, one-way analyses of variance were performed. The results are presented in Table 1.Footnote 7 Since the groups were ordered by age, a trend analysis was also performed separately for each survey year to test for significant differences in the mean number of likes among the three older age groups. Multiple comparisons were evaluated using a Scheffe test to determine if there was a statistically significant difference in the mean scores of the various age groups (Elliott and Woodward Reference Elliott and Woodward2007). Finally, we turned our attention to factors other than age that might predict the relative number of tastes. The independent variables included in the regression were education, age, and having ever had lessons.
Results
Musical taste
Table 1 shows the actual likes by each age group in each survey year. The superscripts and accompanying notes specify the significant differences in the prevalence of the preferences for the various genres among all those aged 55 or more when comparing survey years (p<0.05). While changes over time in people's musical preferences are not the primary focus of this study, some are of great interest. First, the prevalence of the preferences for specific genres varied considerably from year to year. For example, in 1982 among the respondents aged 55 or more years, 46.8 per cent said they liked big-band music, significantly less than in 1992, but significantly more than in 2002. Likewise in 1982, 29.1 per cent liked classical or chamber music, significantly less than in 1992, but not significantly different from 2002.
While the prevalence of liking the various genres varied from year to year, there was a remarkable consistency across the genres in the age-related variation. The focus of this paper is on variations among the older age groups, but first we briefly discuss the patterns for all adult age groups (figures not tabled).Footnote 8 The number of genres liked increased from the youngest age groups to the middle-aged, and then declined through the oldest age groups. So, for example, in all three survey years, the liking of classical/chamber music increased steadily with age until a peak among those aged 55–64 or 65–74 years, and then declined for the oldest age group (75+ years). A similar pattern held for operetta/musicals, big band (except in 2002), country, mood/easy listening and choral. Jazz followed a similar pattern but peaked in 1982 among those aged 25–34 years, in 1992 among those aged 35–44 years, and in 2002 among those aged 45–54 years. Blues music also peaked among comparatively young adults (aged 25–34 years) in 1982, but in later years, like jazz, the peak shifted to older ages (35–44 years in 1992 and 45–54 years in 2002). This pattern may reflect a resurgence of this genre among young people in blues-rock form during the 1960s and 1970s (McStravick and Roos Reference McStravick and Roos2001). The jazz pattern may be explained by the fact that during these decades jazz combined with rock into jazz-fusion, and gained popularity among the young (Cooke Reference Cooke1997).
Rock's patterns of variations in preference by age and period were more complex. In 1982, the genre was most liked by those aged 18–24 years (75.2%), although it was also popular among 25–34-year-olds (56.1%) and 35–44-year-olds (33.4%). There was a similar pattern in 1992, with the greatest popularity among those aged 18–24 years (70.1%), but much increased popularity among the subsequent 10-year age groups (59.4, 56.5 and 38.6%, respectively). By 2002, the ‘standard’ age-related pattern was evident, with the percentage liking the genre increasing from the youngest adults to middle-age, peaking among those aged 45–54 years, and declining at older ages. This appears to be characteristic of emerging genres, which tend to be popular mainly among the youngest adults. For example, rap was included for the first time in the 1992 survey. Not surprisingly, given its recent emergence, its popularity was greatest among those aged 18–24 years (30.7%), and fell away sharply with each 10-year increment of age, so that only 4.3 per cent of 55–64 year-olds, 2.7 per cent of 65–74 year-olds, and 1.3 per cent of 75+ year-olds liked the genre. A similar but less marked pattern held for the ‘new age’ genre in 1992 and for ‘metal’ in 2002.
The most consistent finding is that, for almost every genre in every survey year, liking was much reduced at the oldest ages, even for long-established genres that had been popular among young adults in earlier years. For example, big-band music was very popular from the early 1930s until the late 1940s (Simon Reference Simon1967), but in 1982 had much less appeal among older people than among the late middle-aged: 50 per cent of 55–64 and 65–74 year-olds expressed a preference for big band, compared to only 26.6 per cent of 75+ year-olds. In 1992, a higher percentage (45.5) of the oldest age group expressed a preference for big band but still less than among either 55–64 or 65–74 year-olds. By 2002, however, there was essentially no difference in the relative preference between 65–74 year-olds (36.3%) and 75+ year-olds (36.9%).
Other long-established genres fared no better. The liking for classical/chamber music was less among 65–74 and 75+ year-olds compared to the middle-aged in two of the three survey years. Looking just at the genres that were included in all three survey years, the same applied to musicals, jazz, blues, country, bluegrass, rock, folk and mood/easy listening, although for opera in 2002 when there was slightly higher liking among 75+ year-olds than 65–74 year-olds. The only genre that was most popular among the oldest age group was hymns/gospel music, which applied in two of the three survey years. This suggests that the narrowing of tastes after middle age is not simply an artefact of new genres competing with old, but rather that there may be a general disengagement from music in advanced old age.
A second important finding is the remarkably consistent preferences among the three oldest groups (55–64, 65–74 and 75+ years). While there were minor variations in their ranking, the same five genres were the most preferred genres in 1982 and 1992, namely hymns/gospel, country, mood/easy listening, big band, and classical/chamber. In 2002 among those aged 55–64 years, rock replaced big band, and had become more popular among those aged 65–74 years, being in sixth place just behind classical/chamber music (31.8% versus 32.1%). This was the first year in which rock had a sizeable following among the three older age groups. To detail this remarkable consistency, in 1982 the top five preferred genres for those aged 75+ years were in rank order: hymns/gospel (53.7%), country (46.0%), big band (26.6%), mood/easy listening (23.5%), and classical/chamber (22.7%). For the same age group in 1992, the top five were: hymns/gospel (52.5%), country (45.8%), big band (45.5%), mood/easy listening (35.7%), and classical/chamber (29.1%), and in 2002 the rank order was: big band (36.9%), country (35.7%), hymns/gospel (34.7%), classical/chamber (31.0%) and mood/easy listening (27.5%).
While more study is needed of the interactions between temporal changes in musical genres and lifecourse stage, these findings suggest that despite having liked various new genres when they were young, as people reach older age their musical preferences settle on long-established and perhaps conservative genres. The one exception is the popularity of rock in 2002, although by then certain forms of rock had been around for 50 years and were undoubtedly well established. By comparison, the top five musical preferences of the youngest adults changed markedly with time and had little congruence with those of the older age groups (not shown in tables). For 18–24 year-olds, in 1982 the top five genres were in rank order: rock, country, mood/easy listening, blues and jazz; in 1992 they were: rock, blues, country, mood/easy listening and reggae; and in 2002 they were: rap, metal, rock, country and blues.
Number of likes
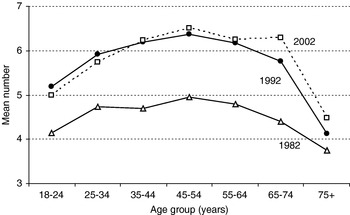
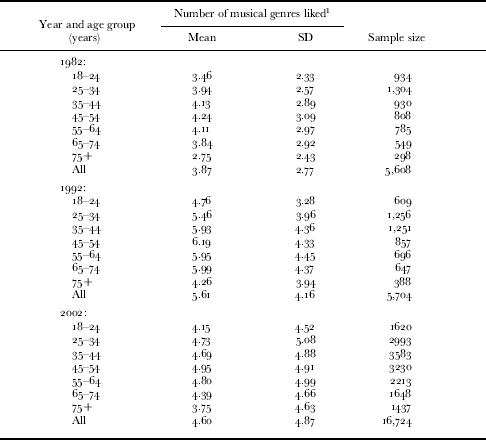
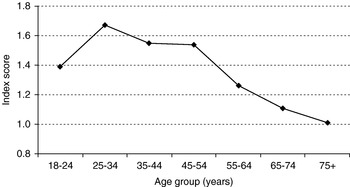
We turn to the main topic of the paper, the mean number of musical genres liked by age group and year. In 1982, the means differed markedly by age group (see Table 2).Footnote 9 Scheffe multiple comparisons found that the score for those aged 75+ years was significantly lower than for all other age groups (p<0.05), and similarly in 1992 there were significant differences by age group in the number of liked musical genres.Footnote 10 Those aged 75+ years had significantly fewer musical tastes than all other age groups except those aged 18–24 years. A similar result was found in 2002 (see Table 2).Footnote 11 Results from the trend analysis suggest that in all three years the number of liked musical genres rose from youth to middle age, and began to fall around age 55 years. As predicted, examination of the means plots for each year revealed that tastes decreased sharply for the oldest age group (see Figure 1).
Mean number of musical likes by age group and year.

Number of musical genres liked by age group, USA, 1982, 1992 and 2002
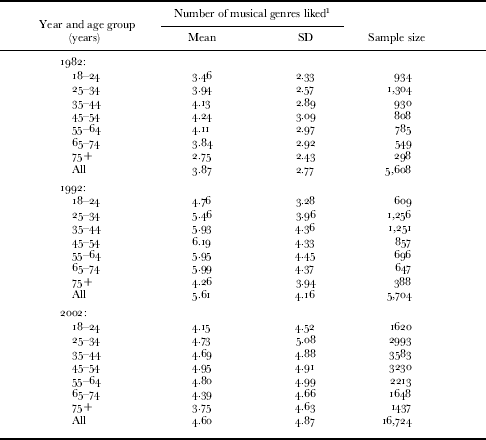
Notes: 1. Number of musical genres that the respondents stated they enjoyed listening to. In 1982, 1992 and 2002, the respondents were asked specifically about 14, 20 and 21 genres, respectively. SD: standard deviation.
Source: US Survey of Public Participation in the Arts for the stated years. For details see text and http://www.cpanda.org/data/profiles/sppa.html (authors' analysis).
Predicting taste
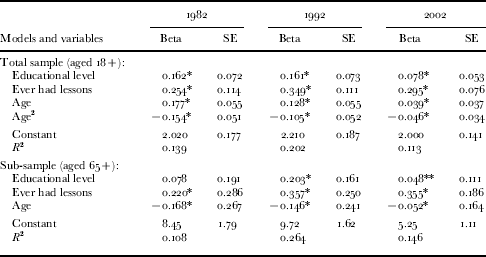
The regressions revealed a significant curvilinear relationship between musical tastes and age in each survey year (see Table 3). There was a significant positive relationship between age and tastes from the youngest adults until around age 55 years, after which a negative association with age (modelled by the square of age) reversed the trend. For the sub-sample aged 65+ years, a negative relationship between number of tastes and age was found in all three years (p<0.05). Education was a significant predictor of the number of tastes in the all-age models, but not among the older sub-sample in 1982 (p=0.14). Having ever had lessons was an important predictor of tastes in each survey year, even among the sub-sample of 65+ year-olds. This suggests that arts socialisation remains important throughout the lifecourse. As predicted, education and arts socialisation reduced the narrowing of tastes in old age. It is not understood why the explanation achieved by the 1992 models was exceptionally high, with an R 2 of 0.26 and around seven per cent of the variance explained for the older sub-sample. The design and contents of the survey questionnaire, or differences in detail in its mode of administration or in the sample composition could be involved.
Multiple regressions of mean number of musical tastes by education, lessons and age, USA, 1982, 1992 and 2002
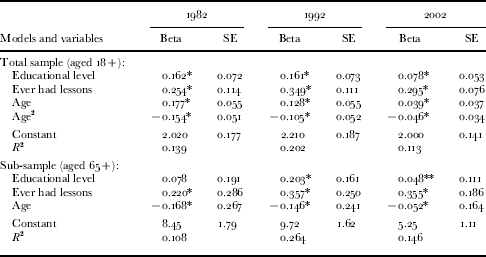
Notes: Standardised coefficients are reported. In regressions of the total sample, a standardised z score for age was used. SE: standard error.
Significance levels: * p<0.05, ** p<0.01, *** p<0.001, one-tailed tests.
Discussion
Musical tastes
The results indicate that musical tastes narrow in old age. This finding is important because, as noted by DiMaggio (Reference DiMaggio1987) and Lizardo (Reference Lizardo2006), people use culture to make connections with one another. They argue that the accessibility and wide appeal of popular or mass-produced tastes, such as music, provides a common cultural thread among members of society. This type of cultural capital, they argue, may be particularly valuable for maintaining social interaction given the current high levels of geographical mobility in the USA and other highly developed countries. This mobility has decreased the localisation of people's kin networks and made it more necessary to make new connections with strangers, which a shared cultural inventory or stock enables (DiMaggio Reference DiMaggio1987). Further, Lizardo (Reference Lizardo2006) argued that a strategy of revealing popular tastes when socialising with strangers for a short period may help mediate the social and emotional transaction costs of such interactions, because of the pervasiveness of their appeal and the low risks of asserting difference. Thus, if tastes narrow in old age, this could have important implications for the social connectedness of older adults.
While we are unable to determine from the data what dynamics lay behind the choice of genres by those aged 65–74 and 75+ years, the findings demonstrate a substantial difference in popular-culture preferences and consumption between the oldest and youngest adults. If taste facilitates interaction, we see here an indicator of both a cause and a consequence of age stratification in society. This evidence from the SPPA suggests that by middle age, the cultural tastes and experiences of people separate from those of younger adults. For the oldest groups, even though the musical genres that they prefer are similar to those among the late-middle-aged, the prevalence of their expressed likes were greatly reduced. This may reflect a general withdrawal from popular-culture consumption and, in effect, a form of distancing from mass society.
As noted in the theoretical discussion, tastes may narrow for reasons of socio-emotional disengagement (Carstensen Reference Carstensen1992) or as a result of declining social networks, but one could also argue that the narrowing of tastes arises from declining physical abilities or reduced opportunities to participate in cultural activities with increased age. A question asked in only the 1982 and 2002 surveys throws light on these issues. It was, ‘few people can do everything they would like to do. But if you could, would you choose to go to classical music performances (jazz, opera, musical theatre, theatre, ballet, art museums) more often than you have during the last 12 months?’ An analysis of the responses revealed that, on average, older adults reported that they would not engage in more activities even if they could, in contrast to the middle-aged respondents – the difference was significant in both survey years (see Figure 2 for 1982).Footnote 12 This finding implies that opportunities for cultural participation are not blocked to older adults, but selectively chosen by them. The finding merits further investigation.
Desires more cultural participation by age group, USA, 1982.

Limitations of the study
A limitation of this study is that without longitudinal panel data, it was not possible to control for age-cohort effects. In addition, the variation in the number of genres asked about in the different survey years has confounded the analysis and the interpretation of the numerical trends. For that reason, we have concentrated on the relative distribution of preferences across age groups in each survey year and not emphasised changes in the mean number of likes. In doing so, it has been shown that the relative number of musical tastes varied strongly by age and with a similar pattern in each survey year (cf. Figure 1). An analysis of only the musical genres that were included in all three survey years found that the relative patterns of musical likes by age group across survey cohorts stayed the same.
Another limitation of this study is characteristic of studies of musical tastes, as Bryson (Reference Bryson1996) noted. It is the ambiguity and instability of the names of musical genres. It is impossible to know, for example, what type of music a respondent was thinking of when asked if he or she liked ‘new age’ music. There will have been considerable variability in the respondents' knowledge and interpretation of the types of music and artists associated with each genre. It would also have been helpful to have had information about the respondents' social networks, for our ability to understand the relational usefulness of tastes for maintaining social networks in old age has been limited. Empirical research suggests that networks do shrink with age, but whether having more or particular cultural preferences mediates that relationship is not known. A final limitation is that there was no measure of the ‘strength’ of musical tastes, so we have not been able to comment on the relationship between the narrowing of tastes and degrees of liking. For example, we cannot say whether the narrowing of tastes in old age is a result of older adults dropping tastes that have become less engaging and concentrating on musical genres that are more meaningful. Applying Carstensen's (Reference Carstensen1992) theory to this cultural realm would suggest that this may be the case, but the data clearly indicate reduced appreciation for nearly all musical genres among the oldest respondents.
Summary and conclusions
Albeit from repeated cross-sectional data, this study has provided strong evidence of a lifecourse trajectory of musical taste, which begins with fairly narrow tastes in young adulthood, expands into middle age, and then narrows in later life. This pattern was found consistently in three separate surveys spanning 20 years. It has also been shown that having more education and having had arts-related lessons reduced the narrowing of tastes after middle age. Finally, we found a remarkable consistency across survey years in what the middle-aged and oldest groups said they liked. Not surprisingly, with the exception of country music in all survey years, and rock music in 2002, their likes did not include genres that appeal to younger people.
Although more research is needed to further our understanding of these phenomena, theory indicates there are at least two complementary reasons for the narrowing of musical tastes in older age. First, there is the possibility that older adults' tastes are selectively pruned as a response to declines in social network size. A varied taste pattern becomes relationally less necessary as a strategy for interaction with the people in one's network. At the same time, given that new tastes are encouraged by wider, diverse and expanding social networks, the tendency for older people's networks to contract and to become homogeneous in age is unlikely to foster exposure to new musical forms. Second, if taste is a form of cultural capital that is used to signal or improve one's social position, then lifecourse events such as retirement, widowhood and relocation to relatively homogeneous residential settings may make this form of cultural capital less relevant. For example, research by Harrison-Rexrode (Reference Harrison-Rexrode2009) has suggested that in an assisted-living environment, the primary form of cultural capital is being perceived as ageing ‘successfully’. While, the residents that were studied continued to say they liked music, it was often to invoke memories and emotions rather than to promote interaction. Consistent with the themes of meaning, social networks and end-of-life in Carstensen's (Reference Carstensen1992) socio-emotional selectivity theory, it may be that the taste patterns that are retained in older adults' ‘cultural-relational toolkits’ are the most meaningful in those ways.
At the same time, we should consider the effects of ageing and stigma on musical participation. For those adults whose connection with music is through performance (e.g. playing an instrument, singing and dancing), declining physical ability may inhibit participation in terms of both proficiency and the ability to gather with others to perform. Moreover, perceived or real age-based stigma may make older adults reluctant to perform or even to attend and listen to public performances of certain genres of music. At the extreme, an affinity for certain genres can become in essence anti-cultural capital because it conflicts with normative expectations of ‘age-appropriate’ behaviour.
We suggest a third explanation. While there is more recorded music of a greater variety of genres than ever before, new technologies have radically changed the way that music is distributed and accessed (Peterson and Ryan Reference Peterson, Ryan, Howard and Jones2004). To the extent that older adults either cannot afford and/or are unfamiliar with these technologies, the less they are likely to sustain and particularly to refresh their interests in music through consumption. At the same time, ‘hi-fi’ equipment for playing vinyl records and cassette tapes is increasingly unavailable and some older adults may be unable to sustain or develop former interests. Whatever the cause of the narrowing of musical tastes in old age, the overall impression is of a separation. A pattern of disengagement or at least entrenchment is present by middle age and dominant in old age. To the extent that cultural tastes serve as bridges to others, as commentators and theoreticians suggest, comparatively few link the tastes of the oldest and youngest respondents. At the same time, while the late middle-aged adults in our study had tastes similar to the oldest respondents, the latter were less likely to care about any particular genre, with the exception of hymns/gospel music.
The finding that this narrowing effect is less for those with more education and arts socialisation points to the continuing returns to early privilege or ‘a good start’. The effects of more education on social and economic success are well understood, as are the effects of arts socialisation on taste and arts participation. The finding is consistent with the notion that advanced old aged brings a constriction of the skills needed to negotiate weak-tie relationships. If tastes are the foundations of people's associations with others, what happens to people who have few? Although older adults are not homogeneous and taste patterns vary by education, income and degree of social integration, knowing more about taste patterns of older adults will allow us to develop age-based interventions for adults at higher risk of being isolated. Unlike material possessions that often need to be downsized in late-life residential changes, tastes are embodied and portable. Communities designed for older adults can capitalise on the cultural investments made by their residents earlier in their lives to promote sociability and social integration. Cultural-capital theory argues that taste is both produced by and reinforces privilege (cf. Bourdieu Reference Bourdieu1984). This study of musical preferences provokes the thought that if cultural tastes are related to the ability to sustain and renew social networks, they could mitigate cultural and social isolation in later life over and above the advantages derived from increased income. This possibility should be examined in future research.
Acknowledgements
We thank Michelle Rogers of Brown University, Richard Peterson of Vanderbilt University, James Hawdon of Virginia Tech and the anonymous reviewers for their helpful feedback on earlier versions of this paper.