Magneto-plasmonic (MP) nanoparticles (NPs) are a kind of bifunctional nanoalloy or core–shell system that can be used to simultaneously enhance catalytic, magnetic, and optical properties in nanostructured systems. The core–shell NPs with magnetic cores and plasmonic shells can be used as model systems for targeted drug delivery applications, and MP NPs are currently used in biomedicine, wastewater management, magnetic resonance imaging, magnetic particle imaging, and environmental remediation.[Reference Lu, Schmidt, Matoussevitch, Bönnemann, Spliethoff, Tesche, Bill, Kiefer and Schüth1–Reference Kobayashi, Horie, Konno, Rodríguez-González and Liz-Marzán7] They can also be used in protein purification, bacterial detection,[Reference Gao, Gu and Xu8] hyperthermia treatment, and cell separation.[Reference Dobson6, Reference Bao and Krishnan9–Reference Lu, Prouty, Guo, Golub, Kumar and Lvov11] In biological applications, the use of noble-metal coatings reduces the toxicity of Co to negligible levels. When the magnetic NPs are smaller than the size of magnetic domains, the particles act as fully magnetized nanomagnets with the spins mostly in the surface, affecting both lattice constant and band structure.[Reference Lu, Salabas and Schüth12] The absence of movement of domain walls in those smaller NPs is responsible for very high coercivity.[Reference Iwaki, Kakihara, Toda, Abdullah and Okuyama13] These particles are promising materials for the construction of data storage media and high performance permanent magnetic nanocomposites,[Reference Chen, Kim, Liu, Fan and Sun14, Reference Sun, Murray, Weller, Folks and Moser15] with high density capacity up to 1 Tb/inReference Reiss and Hutten2.[Reference Weller and Moser16]
There exist several studies on the synthesis and properties of Au–Ni and Au–Co NPs.[Reference Rapallo, Olmos-Asar, Oviedo, Ludueña, Ferrando and Mariscal17–Reference Auten, Hahn, Vijayaraghavan, Stevenson and Chandler23] However, thiolate protected Au/Co NPs have not been reported so far. In general terms, segregation of Au toward the surface is predicted, considering only the metal–metal interaction, i.e., neglecting the effect of the surfactant molecules. Controlled synthesis is difficult, but it is known that both agglomeration and dispersion in size can be fairly controlled with an appropriate choice of capping ligands and reaction environment.[Reference Mariscal, Olmos-Asar, Gutierrez-Wing, Mayoral and Yacaman24] Using phase transfer processes, it is possible to control the size of small NPs protected by specific thiols.[Reference Frenkel, Nemzer, Pister, Soussan, Harris, Sun and Rafailovich25, Reference Brust, Schiffrin, Bethell and Kiely26] The use of an inert gas atmosphere avoids the oxidation of Co. The detailed experimental section is presented in the supporting information (SI).
In this letter, we report ferromagnetic behavior in nanoalloyed Au/Co NPs with sizes less than 5 nm. Imaging and chemical characterization were made using aberration corrected scanning transmission electron microscopy (STEM), which has proven to be a great technique in the characterization of metallic nanostructures.[Reference Bhattarai, Casillas, Khanal, Salazar, Ponce and Jose-Yacaman27] The magnetic behavior is studied using superconducting quantum interference device (SQUID) magnetometer. The STEM images are compared against simulated micrographs, calculated from the configurations obtained from grand canonical Monte Carlo (GCMC) simulations. This combination of experimental and theoretical techniques is used to study alloying and segregation at the atomic scale.
Results and discussion
The plasmonic behavior of dodecanethiolate (DT) capped Au/Co NP is presented in Fig. S1, where a single surface plasmon resonance peak at 507 nm is observed. The interaction between the incident electron beam and the thiolates present in the specimen makes the high-resolution imaging of thiolated NPs very challenging, and only in few cases they are able to resolve atomically.[Reference Bahena, Bhattarai, Santiago, Tlahuice, Ponce, Bach, Yoon, Whetten, Landman and Jose-Yacaman28] The high-voltage electron beam and long exposure of electron beam, even at reduced voltage might change the shape and orientation of the particles by destroying the thiols present. Those challenges were overcome by using the accelerating voltage of the electrons (in STEM) reducing to 80 kV and heating the sample in vacuum at 60 °C (inside the microscope) overnight prior to imaging. The reduced accelerating voltage helped to reduce damage to the sample and by heating the sample in vacuum, contamination in the sample was avoided. A low magnification STEM micrograph of the Au/Co NPs is presented in Fig. 1(a) showing the uniform distribution of DT capped NPs. A representative STEM micrograph of the selected region in Fig. 1(a) is presented in Fig. 1(b), where one can clearly see the size and distribution of particles. The particles are highly monodispersed with the size ranging from 3 to 5 (4 ± 1) nm. The histogram of size distribution is presented in Fig. 1(c). The size of the NPs depends on metal (Au and Co) to thiol (sulphur) ratio during synthesis.
Low magnification STEM images of Au/Co NPs in amorphous carbon. (a) Large coverage particle distribution in amorphous carbon grid. (b) Magnified portion of selected area [red dotted square in (a)] showing the uniform monolayer film of NPs. (c) Particle size histogram, showing a narrow distribution around 2.5–5 nm.

The morphologies mainly observed were decahedra and icosahedra (Fig. S2, SI). However, irrespective of the shape, high angle annular dark field (HAADF) STEM images, whose signal intensity depends on the atomic number,[Reference Pennycook29] showed that the particles were nanoalloyed. Structural defects were expected since the nominal lattice mismatch between Au and Co is 13.8%, but it appears that the small size of the particles and the presence of thiols contribute to keep the lattice relatively free of defects. In Fig. 2 left frame, the Z-contrast image shows an archetypal decahedral particle, where some of the atomic columns appear brighter than others, evidencing a relatively high presence of gold. This trend can be traced in all of the tetrahedra in the particle. The twinning angles between (111) planes varied from 69.8° to 75.5° as presented in Fig. 2, where a high discrepancy (±5°) in region R2 and R3 is observed. The deviation of those values with the average angle 70.53° between {111} twin planes (for symmetrical monometallic decahedral nanocrystal) provides distortion and makes the particles strained. It is also possible to note shifting in some atomic columns, which provokes the elongation of bond length causing internal lattice strain; however, the small size of the nanostructure avoids the appearance of partial dislocations. Gold atoms are persistently present in the adjacent columns of twin boundary planes and this presence decreases far from the twinning plane. The intensity line profile in the Z-contrast image is measured along the dotted black arrow as represented by 1, 2, and 3 and is presented in the right frame in Fig. 2. The stronger intensity in the profile corresponds to the Au-rich atomic columns and the weaker intensity corresponds to the Co-rich atomic columns. Profiles 1 and 3 show the diffusion and intermixing of Au and Co forming an alloyed structure. Similar patterns can be observed in other atomic planes, which indicate some segregation.
Left, a magnified HAADF–STEM image of decahedral shaped Au/Co NPs along [110] zone axis. Each tetrahedron (R1, R2, R3, R4, and R5) is identified by white arrow and the angles measured between the {111} twinning plane are 71.8°, 69.8°, 75.5°, 72.1°, and 70.8° as indicated. The intensity profile is measured along different lattice planes in the decahedral structure. The profile is drawn from the center to outwards as indicated by dotted arrows 1, 2, and 3. Each profile is represented as 1, 2, and 3 and presented in the plot in the frame in right. The stronger intensity in the profile corresponds to Au-rich atomic columns and the weaker intensity corresponds to Co-rich atomic columns. Profiles 1 and 3 show the diffusion and intermixing of Au and Co forming an alloyed structure.
The elemental distribution between Au and Co atoms was confirmed using energy dispersive x-ray spectroscopy (EDS). Representative EDS line profile and mapping are presented in Fig. 3. The EDS line spectra of [Fig. 3(b)] were measured over the line drawn in Fig. 3(a); the red and green line in the plot correspond to the contribution from Au-L (9.71 keV) and Au-M (2.12 keV), while the blue line is the contribution from Co-L (0.77 keV). Area EDS maps taken over a whole particle are presented in Figs. 3(c)–3(g). Both line profile and map spectra confirmed the mixing of Au and Co forming an alloyed structure.
EDS line profile and mapping of single Au/Co nanocluster. (a) Dark field images with the spatial drift and spectrum image during recording EDS spectra. (b) The line profile spectrum (number of counts in arbitrary unit versus position in nm) obtained during EDS line scanning for the spectrum image in figure a. (c) Au/Co sample for EDS mapping and (d) Au/Co mapping from L-shell. (e) and (f) Co and Au mapping from L-shell and (g) Line spectrum of different elements present in the sample. The signal contributions from Au-M, Au-L, and Co-L are represented by red, green, and blue spectra as inset in figure (b). The intensity recorded at different positions of Au and Co gives intermixing and confirms the alloyed structure.
In order to understand the growing sequence of Co/Au NPs, we implemented a set of GCMC simulations,[Reference Mariscal, Velázquez-Salazar and Yacaman30–Reference Frankel and Smith33] using decahedra gold clusters as seeds, as Au nuclei may be formed earlier than Co.[Reference Lide34] For each simulation run, 1′105 MC steps were used to equilibrate the structures at 300 K, and Co atoms were added to the system at fixed chemical potential. Fig. S3 in SI represents several structures at several growth stages. In Fig. S2(a), the initial AuDh seed after relaxation is shown. Figures S2(b)–S2(d) show the Co nucleation at different coverage degrees q. It is worth noting that the deposition of Co atoms starts with the formation of surface alloy (i.e., Co–Au intermixing) instead of a layer-by-layer fashion. This can be understood in terms of the surface energy (γ) of both metals. The surface energy of Co  $\gamma _{{\rm hcp}\lpar 0001\rpar }^{{\rm Co}}= 2. 11\, {\rm J}/{\rm m}^ 2 $,[Reference Punkkinen, Hu, Kwon, Johansson, Kollár and Vitos35] whereas for Au,
 $\gamma _{{\rm fcc}\lpar 111\rpar }^{{\rm Au}}=\; 0. 70 7\, {\rm J}/{\rm m}^ 2 $,[Reference Zólyomi, Vitos, Kwon and Kollár36] from pure energetic considerations, Co will exchange with Au atoms. The activation energies for these exchange processes is of the order of 0.11 eV.[Reference Oviedo, Leiva and Mariscal18] Therefore, from the kinetic considerations the exchange between Co and Au is also favorable. Since
 $E_{{\rm bind}}^{{\rm Co} - {\rm Co}}\gt E_{{\rm bind}}^{{\rm Au} - {\rm Co}} $, 3D phase formation takes place regardless of the Co–Au misfit according to the Volmer–Weber growth mechanism in the over-potential range.[Reference Lorenz and Staikov37] A closer inspection of the atomic distribution of each element reveals the diffusion of Co atoms to intermediate layers, which is in excellent agreement with previous reports on Co deposition on Au(111) surfaces,[Reference Guo, Li and Liu38] and with predictions in bimetallic AuCo particles, where the tendency of Co is to populate sites close but not on the surface of the particle.[Reference Bochicchio and Ferrando39]
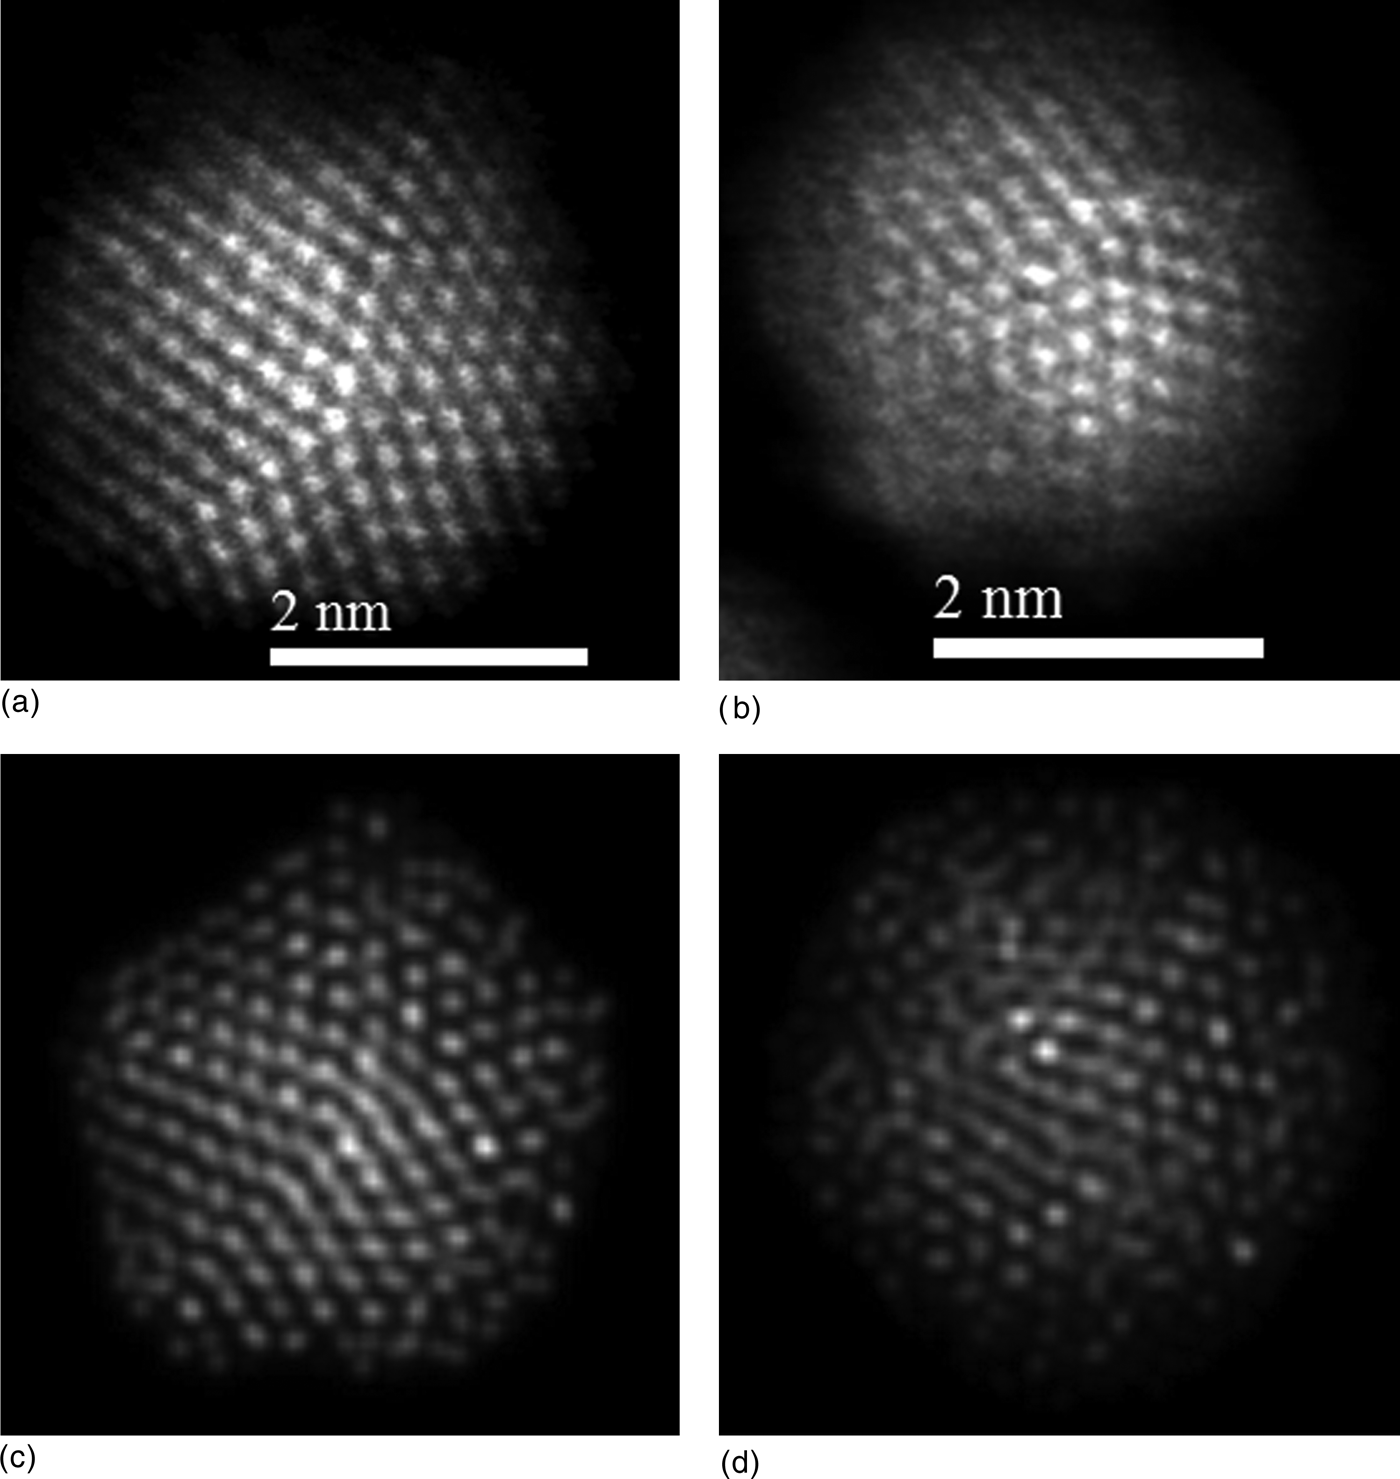
The atomic configurations shown in Figs. S2(b) and S2(c) (decahedra with q = 0.25 ML and q = 1.03 ML, respectively) were used as input to simulate HAADF–STEM images.[Reference Ishizuka40] The simulated micrographs are presented in Figs. 4(c) and 4(d) and compared against the experimental images in Figs. 4(a) and 4(b). Remarkably, all of the simulated micrographs resemble to those obtained experimentally, even at the smallest sizes. This is particularly interesting considering that the GCMC simulations included metal–metal interactions. With respect to the effect of the surfactant molecules (i.e., RS, R = alkyl group) on the composition of the AuCo NCs, theoretical calculations, using density functional theory, predict an adsorption energy of alkylthiolates on the Au(111) surface ranging from −1.14 to −2.22 eV depending on the adsorption site,[Reference Olmos-Asar, Rapallo and Mariscal41] whereas the adsorption energy of RS on Co(0001) surface was reported as −3.0 eV,[Reference Caruso, Wang, Jaswal, Tsymbal and Dowben42] which means that the interaction between the thiolate molecules with Co is much stronger than with Au. Therefore, Co segregation toward the surface of the NP is favored.
The magnetic property of Au/Co NP (powder sample) was investigated by SQUID magnetometry. The hysteresis loops recorded at 300 and 10 K are presented in Fig. 5(a), where the change in magnetization is observed by changing the strength of the magnetizing field from −2 to 2 Tesla. The coercive field was 346 Oe at 300 K and 796 Oe at 10 K, while the retentive magnetizations were 0.257 and 0.638 emu/g. The saturation magnetization value was 0.472 emu/g at 300 K. The effective magnetic moment was obtained by fitting a Langevin function in units of Bohr's magneton (μB) at low temperature, and found to be 2.8 × 10² µB. Taking the case of low magnetic field (200 gauss), the magnetic moment at room temperature can be estimated to be 1.1429 × 10⁴ µB. The hysteresis loop for monometallic 1–3 nm sized Co NPs synthesized in the same way as Au/Co NP is presented in the inset of Fig. 5a, where both coercive and retentive values are found to be higher than bimetallic (Au/Co) case. Figure 5b shows the temperature dependent magnetization measurements for field cooled and zero field cooled of Au/Co NPs. Despite very small particles as reported by Kechrakos[Reference Kechrakos and Trohidou43]et al. and Dormann[Reference Dormann, Fiorani and Tronc44]et al. Au/Co NPs present ferromagnetic behavior with coercive field and retentive magnetization.
Magnetic properties measurement for Au/Co NPs by using SQUID magnetometer. (a) Hysteresis loop for magnetization (emu/g) versus magnetizing field (T, tesla) measurements at room temperature (red) and low temperature 10 K (blue). The inset represents the magnified portion in the center of the histogram at room temperature for 1–3 nm sized Co NPs. (b) Magnetization (emu/g) as a function of temperature (K). Upper curve: FC, field cooled; lower curve: ZFC, zero field cooled.
In a 2008 study, Auten et al. [Reference Auten, Hahn, Vijayaraghavan, Stevenson and Chandler23] have reported ~“3-nm magnetic NiAu nanoparticles” using decane-thiolate monolayer protection, which “had essentially the same Au:Ni ratio as was set in the synthesis (Au:Ni = 2.1).” The evidence indicated the surfaces are enriched in gold. The saturation magnetization was ~10 emu/g-Ni, as compared ~0.5 emu/g-total in the present case.
Summary
In summary, this study reveals the formation of magnetic nanoalloy in Au/Co NPs within the magnetic domain size. Atomically resolved HAADF–STEM images obtained from aberration-corrected STEM are allowed to investigate the elemental distribution in individual atomic columns in the NPs, revealing the diffusion of Co atoms into the Au lattice site. This segregation and the nanoalloy of Au and Co were unequivocally supported by EDS mapping and line profile measurements. The experimental results were also supported and interpreted by the GCMC simulations; in particular, the atomistic simulations predict Au–Co mixing at the early stages of the growth process and the so-called bridging phenomenon (Au–Co Au–Au) at coverage degrees close to unity. The magnetic properties obtained from the SQUID magnetometer showed that the particles have a ferromagnetic behavior, that will be very promising applications in high-density information storage, possible permanent magnetic nanocomposites. Moreover, MP 3–5 nm sized Au/Co NPs are below the magnetic domain size range and behaves as the fully magnetized nanomagnet with a large number of spins in the surface, which is responsible for important magnetic contribution and also a possible candidate for biomedical applications where the toxicity can be reduced by reducing the concentration of Co in the Au/Co system.
Supplementary materials
For supplementary material for this article, please visit http://dx.doi.org/10.1557/mrc.2013.30
Acknowledgments
This project was supported by grants from the National Center for Research Resources (5 G12RR013646-12) and the National Institute on Minority Health and Health Disparities (G12MD007591) from the National Institutes of Health. The authors would like to acknowledge the NSF for support with grants DMR-1103730, “Alloys at the Nanoscale: The Case of Nanoparticles Second Phase and PREM: NSF PREM Grant # DMR 0934218; “Oxide and Metal Nanoparticles- The Interface Between Life Sciences and Physical Sciences”. NB acknowledges G. Ajithkumar for discussion about magnetic behavior. Support from the Mexican Council for Science and Technology (CONACYT, Mexico), through project CIAM 148967, is also acknowledged. MMM wish to thank CONICET, SeCyT UNC, ANPCyT Program BID (PICT 2010-123), and PIP: 112-200801-000983 “Nanotechnology in-silico” for financial support.