1 Introduction
The endothelial glycocalyx layer (EGL) is an hydrated brush-like layer coating the endothelial cells that lines the interior of blood vessels. The EGL is found throughout the circulatory system, although we concentrate here on the microcirculation, where most prior studies of the EGL have been focused (Weinbaum, Tarbell & Damiano Reference Weinbaum, Tarbell and Damiano2007). The blood vessels of the microcirculation have diameters ranging between 5 and  $20~\unicode[STIX]{x03BC}\text{m}$, and on these scales the presence of blood cells is generally modelled explicitly, rather than through a non-Newtonian fluid rheology (Hariprasad & Secomb Reference Hariprasad and Secomb2012).
The EGL is thought to fulfil a number of important physiological functions, including in the immune response (Vink, Constantinescu & Spaan Reference Vink, Constantinescu and Spaan2000; Becker et al. Reference Becker, Jacob, Leipert, Salmon and Chappell2015), and as a molecular filter (Levick & Michel Reference Levick and Michel2010; Curry & Adamson Reference Curry and Adamson2012). We focus here on its role in transmitting fluid loading to the vessel wall (Secomb, Hsu & Pries Reference Secomb, Hsu and Pries2001; Tarbell & Pahakis Reference Tarbell and Pahakis2006), which can lead to endothelial cells becoming aligned in the direction of the flow (Barbee, Davies & Lal Reference Barbee, Davies and Lal1994). The experiments of Florian et al. (Reference Florian, Kosky, Ainslie, Pang, Dull and Tarbell2003) demonstrated a drop in the production of nitrogen oxides by the endothelial cells when the heparan sulphate component of the EGL was degraded by the enzyme heparanase. Since these oxides are associated with endothelial cell response to applied stresses, this was interpreted as evidence of the EGL’s role in mechanotransduction. Thi et al. (Reference Thi, Tarbell, Weinbaum and Spray2004) subsequently demonstrated that disruption of the dense peripheral actin band within a cell, which is linked to unzipping of the adherens junctions joining adjacent cells, no longer occurs once the EGL has been degraded by heparanase. Yao, Rabodzey & Dewey (Reference Yao, Rabodzey and Dewey2007) then later confirmed that endothelial cells do indeed cease to align with flow direction following EGL degradation by heparanase.
However, its fragile nature makes the EGL difficult to examine experimentally, and modelling has been seen as a valuable tool for better understanding its role and behaviour. A theoretical framework commonly used for this purpose is biphasic mixture theory, which considers the EGL to be a linearly poroelastic material (Damiano et al. Reference Damiano, Duling, Ley and Skalak1996; Wei et al. Reference Wei, Waters, Liu and Grotberg2003; Damiano & Stace Reference Damiano and Stace2005; Sumets et al. Reference Sumets, Cater, Long and Clarke2015; Lee, Long & Clarke Reference Lee, Long and Clarke2016). The negatively charged glycocalyx can also interact with the dissolved ions in blood to generate electrokinetic effects, and these effects can be incorporated using triphasic mixture theory (Stace & Damiano Reference Stace and Damiano2001; Damiano & Stace Reference Damiano and Stace2002; Liu & Yang Reference Liu and Yang2009; Sumets et al. Reference Sumets, Cater, Long and Clarke2018). Such models have been used to predict how mechanical loads are transmitted from the flow, through the EGL, to the underlying endothelial cells.
However, conventional mixture theory treats the EGL as being homogeneous and isotropic, yet there is reason to believe that the EGL has some degree of microstructural organisation. The electron-microscopy studies of Squire et al. (Reference Squire, Chew, Nneji, Barry and Michel2002) suggest a quasi-periodic matrix of scattering centres or fibres. Subsequently, Weinbaum et al. (Reference Weinbaum, Zhang, Han, Vink and Cowin2003) adapted this ultrastructural model for their work, and proposed that the membrane-bound proteins that form the backbone of the EGL are located in a hexagonally periodic arrangement over the surface of the endothelial cells. Each hexagon corresponds to a brush that consists of multiple core proteins originating from a common focal point, with these focal points found to be spaced approximately 100 nm apart. A diameter of 12 nm has been inferred for the core proteins based on the size of molecules that can filter through the EGL (Curry & Michel Reference Curry and Michel1980; Squire et al. Reference Squire, Chew, Nneji, Neal, Barry and Michel2001; Weinbaum et al. Reference Weinbaum, Zhang, Han, Vink and Cowin2003), as well as the EGL’s contribution to the resistance to transmural fluid leakage (Hu & Weinbaum Reference Hu and Weinbaum1999). This geometry is depicted in figure 2. The brush focal point is believed to anchor to the underlying actin network within the endothelial cell, allowing a mechanism for fluid forces to be transmitted to the cell cytoskeleton. The core proteins within each brush were found to be spaced approximately 20 nm apart, and at approximately 20 nm intervals along the length of these core proteins were observed scattering centres of approximate radii 6 nm. It is suggested that these scattering centres correspond to aggregated Glycosaminoglycan (GAG) chains that are bound to the core proteins. The 20 nm core protein spacing was also found in the more recent studies (Arkill et al. Reference Arkill, Knupp, Michel, Neal, Qvortrup, Rostgaard and Squire2011; Arkill Reference Arkill, Neal, Mantell, Michel, Qvortrup, Rostgaard, Bates, Knupp and Squire2012) although these studies point more to a rectangular-periodic arrangement.
Molecular dynamics simulation is one approach that has been used to model the detailed EGL microstructure (Jiang et al. Reference Jiang, Gong, Luo and Ventikos2017), although such computations are extremely expensive and typically limited to areas and time durations in the nanoscale regime. To assess the importance of EGL microstructure on the macroscale, we here instead employ homogenisation theory to incorporate the layer’s small-scale geometry into the continuum-level bulk dynamics. Consideration of the microstructure in this way also allows us to explicitly compute the torque transmitted through the EGL, which is believed to be material to endothelial cell remodelling (Weinbaum et al. Reference Weinbaum, Tarbell and Damiano2007). By contrast, a biphasic mixture theory approach is only able to provide an effective solid shear stress exerted on the endothelial surface.
Homogenisation is a well-established multiscale asymptotic method for incorporating microstructure into the equations that govern the bulk macroscopic dynamics. The approach has enjoyed great success in a great number of physical settings (Papanicolau, Bensoussan & Lions Reference Papanicolau, Bensoussan and Lions1979; Pavliotis & Stuart Reference Pavliotis and Stuart2008), and in the context of viscous flows leads to the familiar volume-averaged porous flow equations (Hornung Reference Hornung1997; Fowler Reference Fowler1998). Whereas standard homogenisation exploits three-dimensional periodicity in a material’s microstructure, in this case the EGL is only periodic in the two directions tangential to the vessel wall, which itself can be considered a two-dimensional surface embedded in three-dimensional space. In directions normal to the vessel surface it is necessary to satisfy wall conditions on the vessel surface, and to match to the flow in the vessel lumen at the outer boundary of the EGL. This requires us to adapt the standard homogenisation approach, and leads to a number of additional macroscopic forcing terms in the bulk-averaged equations, in addition to the forcing by bulk pressure gradients usually encountered. Moreover, we find that the Poisson equation determining bulk pressure in the EGL is itself also subject to additional forcing from the interfacial traction.
In § 2 we introduce the modelling assumptions and governing equations, including a modified form of the homogenisation method that allows us to consider a two-dimensional surface endowed with periodic microstructure, embedded in three-dimensional space. In § 3 we then describe how the resulting unit cell and pressure equations are solved numerically, before considering a number of different scenarios for the EGL microstructure in § 4. Our results will focus on the degree to which transmission of mechanical load through the EGL is a function of its microstructural geometry. We conclude by discussing the implications of our main findings in § 5.
2 Formulation
We first introduce a coordinate system which conforms to the vessel geometry, and write down the full governing equations for the microvessel expressed in terms of this coordinate system. In the EGL, we re-express these in terms of both a moderate length scale and small spatial scale which reflects the EGL microstructure and its periodicity in directions tangential to the vessel well. This leads to a novel homogenisation problem, producing a number of unit cell problems connecting macroscopic interfacial tractions and pressures within the EGL to stresses and torques applied at the vessel wall.
There are a number of assumptions that we make in this study, which are similar to those seen in earlier models of the EGL. We focus on microvessels that are sufficiently small that the fluid can be considered to be plasma, which is mostly water and behaves as a Newtonian fluid, i.e. components of the haematocrit pass through the vessel intermittently and must be considered explicitly (although we do not do so here). Furthermore, for simplicity we do not consider here the effect of the dissolved ions in the blood. Also, we assume that the microstructure of the EGL and the vessel wall are rigid.
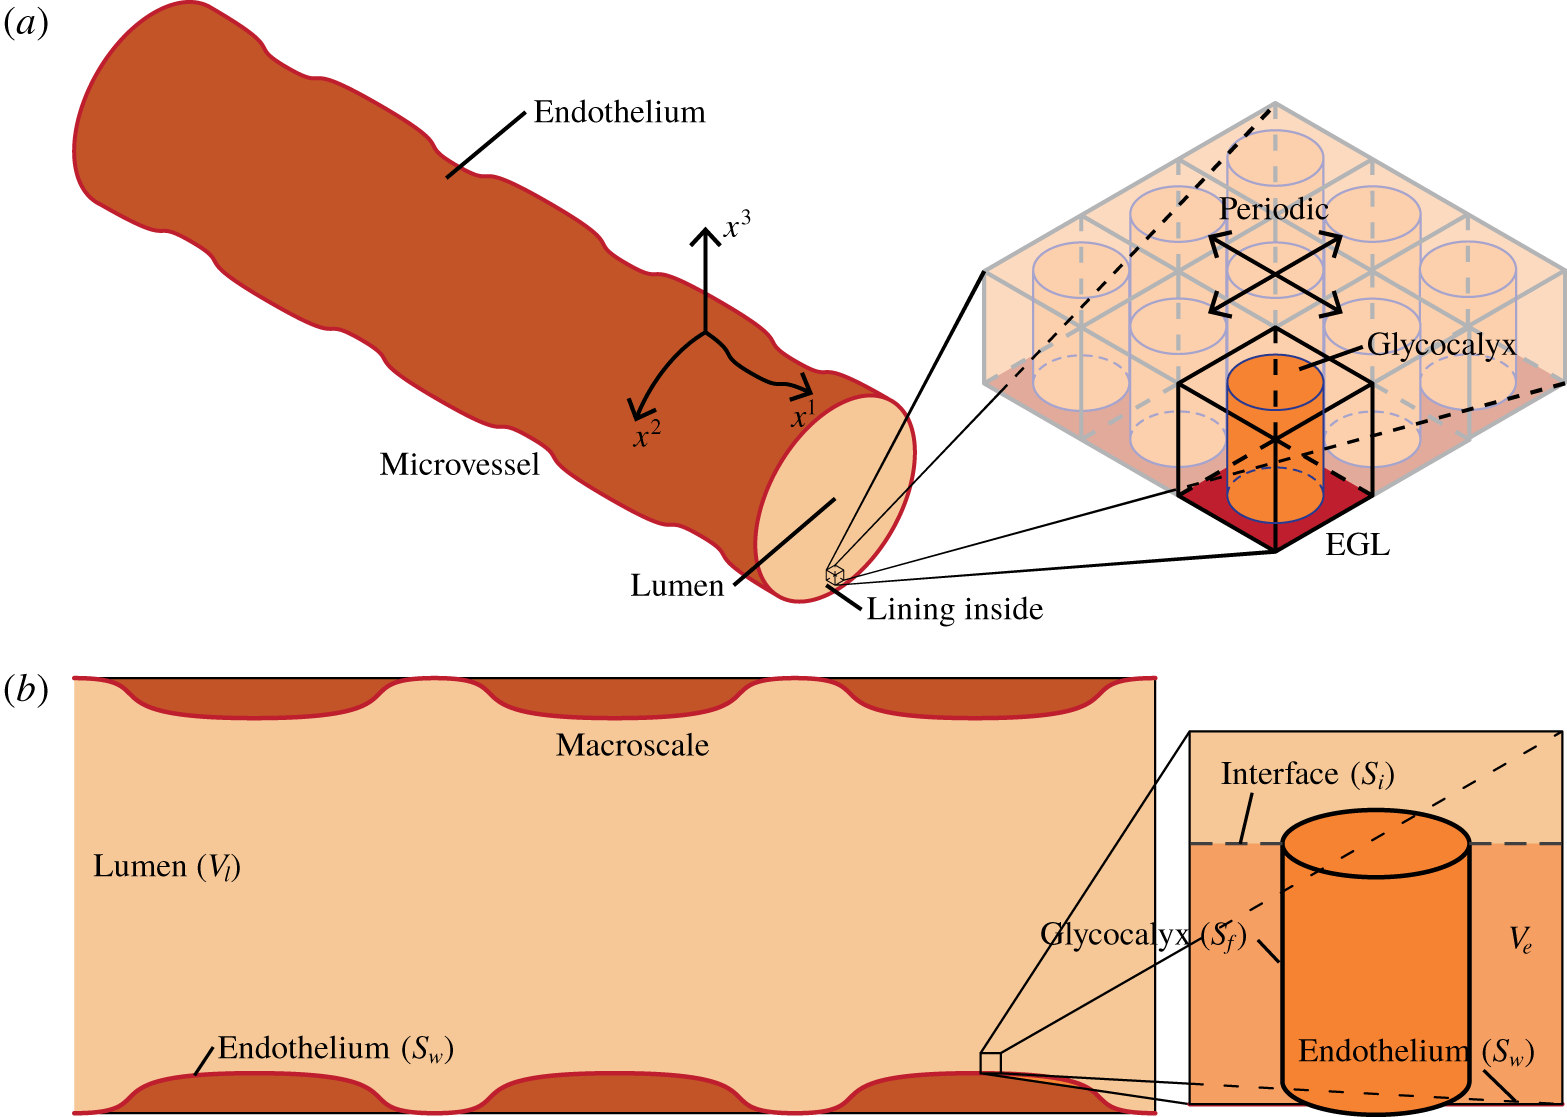
Illustration of an EGL-lined microvessel, showing a vessel surface that undulates due to the presence of endothelial cells on its inner surface. A magnified section of the EGL reveals a periodic microstructure. We define a coordinate system  $\boldsymbol{x}$ that conforms to the microvessel surface, taking our coordinates
 $x^{1}$ and
 $x^{2}$ to be tangential to the surface of the vessel and
 $x^{3}$ to be always normal to the surface (note that the use of superscripts rather the subscripts is in acknowledgment that the position vector is contravariant). (b) Longitudinal slice through the model geometry. On the left we have a microvessel viewed at the macroscale and on the right, a small section of the microvessel is magnified to view a single (idealised) EGL brush at the microscale.

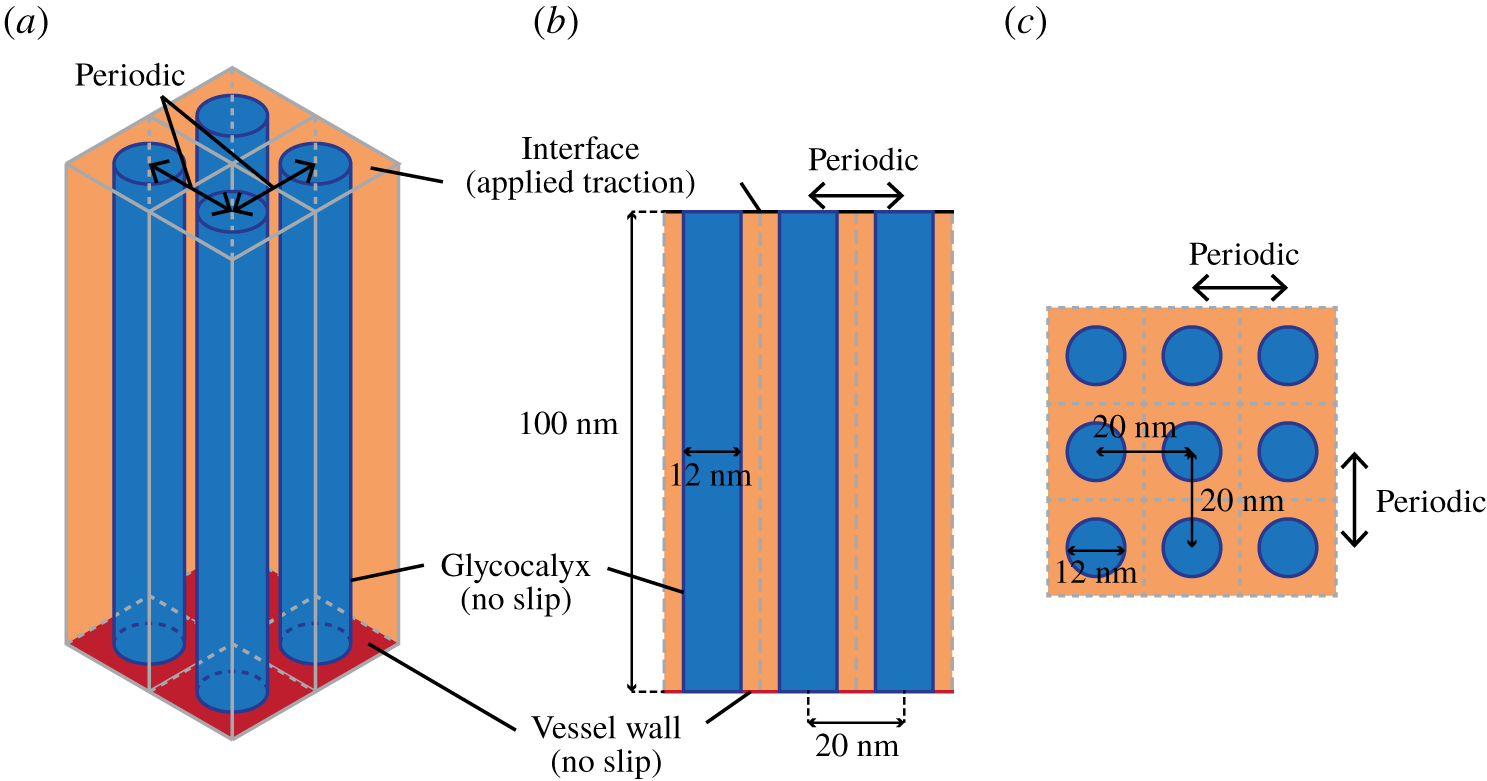
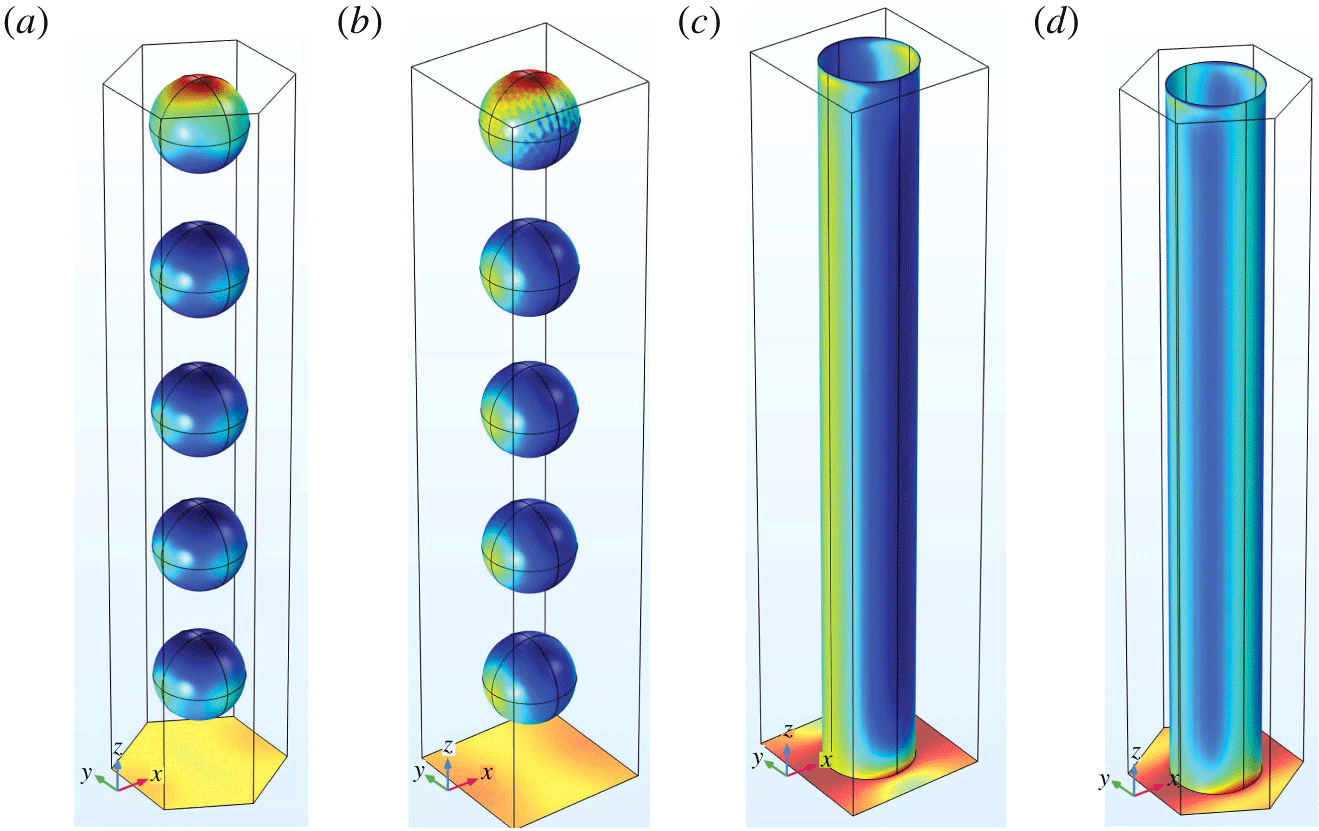
Diagram illustrating the core protein model for the glycocalyx for a (a) isometric, (b) side and (c) top–down view. In this, we take the glycocalyx to be composed of a periodic array of core proteins that are modelled as cylinders with radius 6 nm that extend through the whole EGL (taken to be 100 nm thick). As discussed in § 2.3, the boundary conditions for the glycocalyx and vessel wall are taken to be no slip, while the interface has continuity conditions.

2.1 Geometry
2.1.1 Macroscopic vessel geometry
Figure 1 illustrates our macroscale geometry, which consists of a two-dimensional surface that represents the bare vessel wall (endothelium). We introduce a surface conforming coordinate system,  $\boldsymbol{x}$, that follows the underlying shape of the microvessel, with
 $x^{1}$ and
 $x^{2}$ taken to be tangential to the microvessel wall and
 $x^{3}$ to be normal to it, so that
 $x^{3}=0$ defines the surface of the microvessel wall. (The use of superscripts rather than the more usual subscripts is in acknowledgment of the fact that the position vector is contravariant.)
The advantage of this conforming coordinate system is that  $x^{1}$ and
 $x^{2}$ are always the directions in which the EGL is periodic, irrespective of location on the vessel surface. However, it does require us formulating our governing equations in tensor form and paying particular attention to whether quantities are covariant or contravariant. We denote covariant components of tensors using subscripts (
 $a_{i}$) and contravariant components as (
 $a^{i}$).
If we assume that the surface of our microvessel is defined parametrically by
 $$\begin{eqnarray}x_{s}={\mathcal{F}}^{1}(x^{1},x^{2}),\quad y_{s}={\mathcal{F}}^{2}(x^{1},x^{2}),\quad z_{s}={\mathcal{F}}^{3}(x^{1},x^{2}),\end{eqnarray}$$
then a point close to the endothelium can be parameterised as
 $$\begin{eqnarray}(x,y,z)=({\mathcal{S}}^{1}(x^{1},x^{2},x^{3}),{\mathcal{S}}^{2}(x^{1},x^{2},x^{3}),{\mathcal{S}}^{3}(x^{1},x^{2},x^{3})),\end{eqnarray}$$
with
 $$\begin{eqnarray}{\mathcal{S}}^{i}(x^{1},x^{2},x^{3})={\mathcal{F}}^{i}(x^{1},x^{2})+n^{i}(x^{1},x^{2})x^{3},\end{eqnarray}$$
where  $\boldsymbol{n}(x^{1},x^{2})$ is the unit normal to the surface. This parameterisation, in turn, defines a metric tensor
 $g_{ij}$ on the surface (see appendix A), and corresponding first and second covariant derivatives which we will define respectively using comma index notation
 $a_{,j}^{i}$ and
 $a_{,jk}^{i}$ (see appendix B for full definitions).
2.1.2 Microscopic EGL geometry
On the surface of the endothelium we assume a periodic structure which represents the microstructure of the EGL. An example involving a rectangularly periodic array of cylinders is illustrated in figure 1, although we will consider the effect of different configurations (see § 2.2 below). The surface of the structures will be denoted by  $S_{f}$, with the surrounding endothelium denoted
 $S_{w}$. The volume of the vessel interior containing these structures will be denoted
 $V_{e}$, with the remainder of the interior being the vessel lumen and denoted
 $V_{l}$. The interface between the EGL and the lumen is
 $S_{i}$, and mirrors the shape of the endothelium at height of 100 nm above it. The inlet and outlet of the lumen are
 $S_{l}^{-\infty }$ and
 $S_{l}^{\infty }$ represents the inlet and outlet surfaces for the lumen, whereas
 $S_{e}^{-\infty }$ and
 $S_{e}^{\infty }$ represents the inlet and outlet surfaces for the EGL.
2.2 Microstructural organisation
We now explore the two distinct and idealised EGL microstructures, which qualitatively capture the different structures suggested by the physiological literature.
In the core protein model, we adopt a geometry similar to Weinbaum et al. (Reference Weinbaum, Zhang, Han, Vink and Cowin2003), who computed flow past a two-dimensional array of circular cylinders to model the glycocalyx. The core protein (cylinder) has a radius of 6 nm and a height that spans the full 100 nm thickness of the EGL.
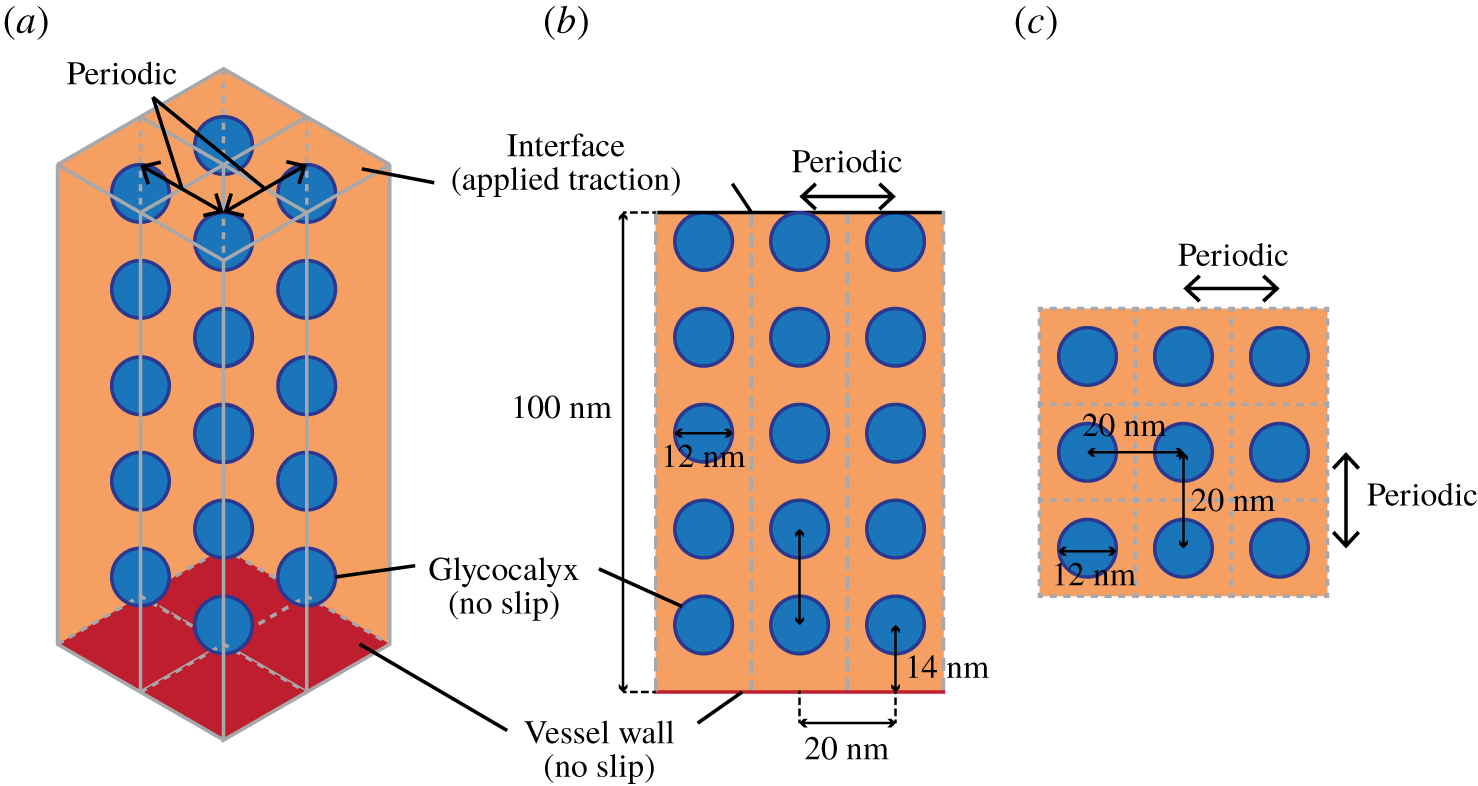
Diagram illustrating the aggregated GAG model for the glycocalyx for a (a) isometric, (b) side and (c) top–down view. We take the glycocalyx to be composed of a periodic array of stacks of spherical particles with radius 6 nm that occur at 20 nm intervals above the vessel wall. These extend through the whole EGL which is taken to be 100 nm thick. As discussed in § 2.3, the boundary conditions for the glycocalyx and vessel wall are taken to be no slip, while the interface observes continuity conditions.

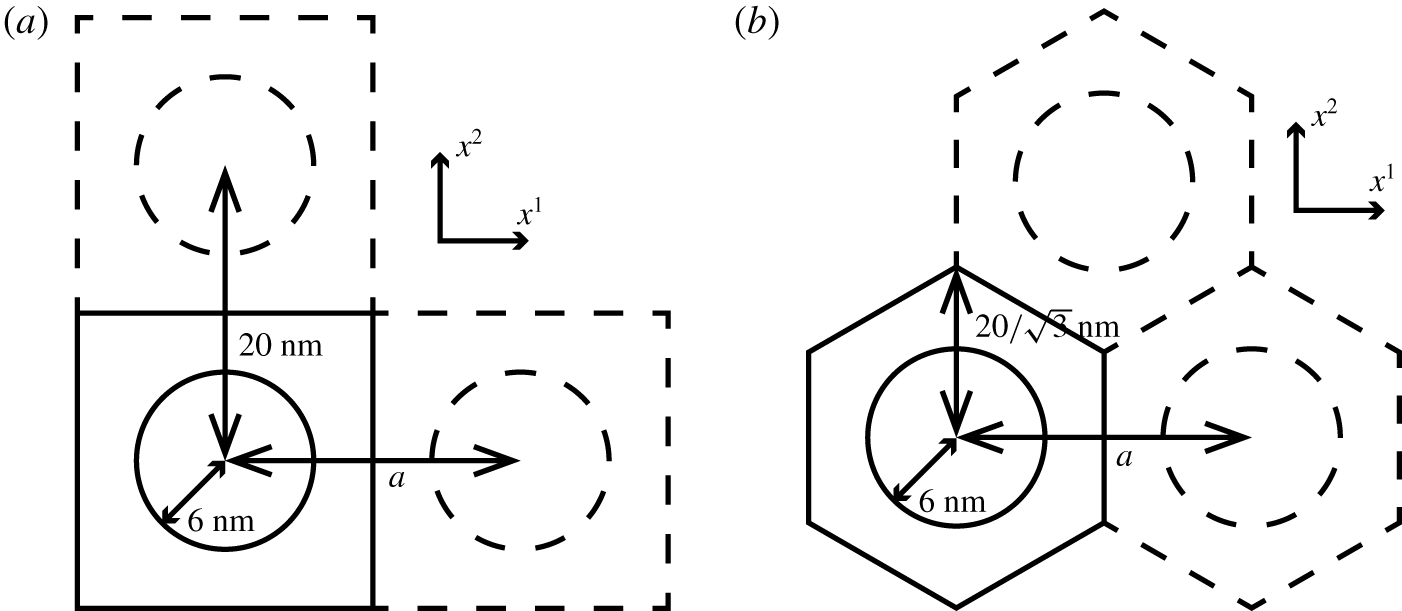
Plan view of (a) rectangularly and (b) hexagonally periodic unit cell. In both cases, we leave the  $x^{2}$ spacing constant and vary the
 $x^{1}$ spacing,
 $a$, between the glycocalyx filaments to study the effect of different EGL microstructural organisations.

By contrast, in the aggregated GAG model we adopt the scattering centre structure suggested by Squire et al. (Reference Squire, Chew, Nneji, Barry and Michel2002) and later used by Weinbaum et al. (Reference Weinbaum, Zhang, Han, Vink and Cowin2003). This geometry is depicted in figure 3 and we again take the EGL to be 100 nm thick, with a vertical spacing of 20 nm between particles (scattering centres).
In addition, for both types of EGL microstructure we are also interested in the possible microstructural organisations discussed in the experimental literature. Specifically, rectangular and hexagonal periodicities, as illustrated in figure 4. Moreover, we also consider the effect of microstructural anisotropy on mechanotransduction, by varying the spacing in the  $x^{1}$ direction,
 $a$, while leaving the spacing in the
 $x^{2}$ direction fixed, as also illustrated in figure 4 (although of course we acknowledge that more spatially complex variations in EGL spacings are possible). In keeping with standard homogenisation terminology, each periodic unit is referred to as the unit cell.
2.3 Governing equations
Since we are principally focussed in this study on the relative amount of mechanical loading that is transmitted through the EGL as a function of its microstructure, it is not necessary for us to actually solve for the macroscopic flow to determine the absolute applied loading, although we will write down the appropriate governing equations and boundary conditions.
Distances are non-dimensionalised on the radius of the microvessel, i.e.  $\boldsymbol{x}=\boldsymbol{x}^{\ast }/R$, where
 $R$ is the vessel radius. Velocities are non-dimensionalised by
 $\boldsymbol{u}=\boldsymbol{u}^{\ast }\unicode[STIX]{x1D707}L/\unicode[STIX]{x0394}PR^{2}$ where
 $\unicode[STIX]{x1D707}$ is the dynamic viscosity of the blood plasma,
 $L$ is the length of the vessel and
 $\unicode[STIX]{x0394}P$ is the average pressure drop between the inlet and outlet of the vessel. Pressures and stresses are non-dimensionalised according to
 $P=P^{\ast }L/\unicode[STIX]{x0394}PR$,
 $\unicode[STIX]{x1D748}=\unicode[STIX]{x1D748}^{\ast }L/\unicode[STIX]{x0394}PR$.
Under this non-dimensionalisation, the governing Stokes flow equation for fluid flow, expressed in covariant form, in both the EGL and lumen are given by
 $$\begin{eqnarray}\displaystyle & g^{jk}w^{i},_{jk}=g^{ij}{\mathcal{P}}_{,j}, & \displaystyle\end{eqnarray}$$
 $$\begin{eqnarray}\displaystyle & w_{,i}^{i}=0, & \displaystyle\end{eqnarray}$$
where  $\boldsymbol{w}$ is either
 $\boldsymbol{u}$ or
 $\boldsymbol{v}$, the fluid velocities in the lumen and EGL regions respectively, and
 ${\mathcal{P}}$ is either the pressure in the lumen
 $P$ or EGL
 $p$, correspondingly. (Note that we are using subscripted comma notations for derivatives.)
The boundary conditions for this problem are continuity of traction and fluid velocity on the lumen–EGL interface,  $S_{i}$, and no slip on the vessel wall and EGL filament surface,
 $S_{w}\cup S_{f}$, i.e.
 $$\begin{eqnarray}\boldsymbol{u}=\boldsymbol{v},\quad \boldsymbol{h}=\boldsymbol{f}\quad \text{on }S_{i},\end{eqnarray}$$
 $$\begin{eqnarray}\boldsymbol{v}=\mathbf{0}\quad \text{on }S_{w}\cup S_{f},\end{eqnarray}$$
where  $h^{i}=\unicode[STIX]{x1D70E}^{ij}n_{j}$ and
 $f^{i}=\unicode[STIX]{x1D70F}^{ij}n_{j}$ are the tractions on the interface from the flow in the lumen and EGL, respectively, with
 $\unicode[STIX]{x1D748}$ and
 $\unicode[STIX]{x1D749}$ being the stress tensors for the lumen and EGL respectively and
 $\boldsymbol{n}$ denoting the unit normal vector to the interface.
Furthermore, we are also required to match inlet and outlet conditions at the entrance and exit of the microvessel
 $$\begin{eqnarray}\displaystyle & p=P_{-\infty }\quad \text{on }S_{e}^{-\infty }\cup S_{l}^{-\infty }, & \displaystyle\end{eqnarray}$$
 $$\begin{eqnarray}\displaystyle & p=P_{\infty }\quad \text{on }S_{e}^{\infty }\cup S_{l}^{\infty }, & \displaystyle\end{eqnarray}$$
 $P_{-\infty }$ and
 $P_{\infty }$ denote prescribed inlet and outlet pressure conditions for the EGL.
While the flow in the lumen is  $O(1)$, the flow in the EGL is an order of magnitude smaller due to its low permeability (see the next section for more details). As such the leading-order flow in the lumen comes to rest at the lumen–EGL interface, the location of which can be identified with the vessel wall at leading order due to the asymptotic thinness of the EGL. Consequently, the leading-order flow in the lumen is found by solving the flow through the bare vessel (e.g. with no EGL present).
However, leading-order tractions in the EGL are comparable with those in the lumen, and so it is the continuity of traction in (2.6) that drives the leading-order flow in the EGL. Nonetheless, we shall see in the next section that the flow in the EGL is separable in terms of its dependence upon the micro- and macro-scales. As a result, applied traction (as well as pressure and the bulk geometry, e.g. metric tensors) simply acts as a modulating amplitude factor for the flow in the EGL. Combined with the fact that flow in the EGL is linear, the response of EGL flow to changes in the local macroscopic environment is therefore also linear. Consequently, if we are only interested in how the percentage of loading transferred through the EGL varies as a function of its microstructure (as we are here), we need not find the absolute traction applied to the EGL–lumen interface and hence need not explicitly solve for the flow in the lumen. For the purposes of finding the coefficients that determine mechanotransduction of any given applied traction through the EGL, it is sufficient to simply solve the EGL flow subject to local unit forcing.
2.4 Homogenisation in the EGL
In the EGL we exploit the difference in magnitude between the length scale of the periodically repeating EGL components, and the much larger size of the overall vessel. Specifically, the EGL components are spaced approximately  $\unicode[STIX]{x1D706}\sim 20~\text{nm}$ apart, a similar order of magnitude to the EGL thickness, whereas the diameter of the vessel is up to
 $R\sim 30~\unicode[STIX]{x03BC}\text{m}$. We denote this ratio by
 $\unicode[STIX]{x1D716}=\unicode[STIX]{x1D706}/R\approx 10^{-3}$, and introduce a short length scale
 $$\begin{eqnarray}\boldsymbol{x}=\unicode[STIX]{x1D716}\boldsymbol{y}.\end{eqnarray}$$
The first and second covariant derivatives can then be expressed in terms of both moderate and small scales (see appendix B).
Also, recognising that we must match  $O(1)$ tractions at the EGL–lumen interface, we expand velocities and pressures as follows
 $$\begin{eqnarray}\boldsymbol{v}=\unicode[STIX]{x1D716}\boldsymbol{v}^{\left(0\right)}+\unicode[STIX]{x1D716}^{2}\boldsymbol{v}^{\left(1\right)}+O(\unicode[STIX]{x1D716}^{3}),\quad p=p^{\left(0\right)}+O(\unicode[STIX]{x1D716}).\end{eqnarray}$$
(Hence, the leading-order flow in the EGL is an order of magnitude larger than the  $O(\unicode[STIX]{x1D716}^{2})$ flows under standard homogenisation in a triply periodic geometry (Fowler Reference Fowler1998)). Since distances scale like
 $\unicode[STIX]{x1D716}$ in the unit cell (2.9), the corresponding tractions are
 $$\begin{eqnarray}\boldsymbol{h}=\boldsymbol{h}^{\left(0\right)}+\unicode[STIX]{x1D716}\boldsymbol{h}^{\left(1\right)}+O(\unicode[STIX]{x1D716}^{2}).\end{eqnarray}$$
Substituting these asymptotic expansions into the momentum equation (2.4), and replacing derivatives by expanded covariant derivatives (B 1) and (B 2), and then collecting powers of  $\unicode[STIX]{x1D716}$ we obtain
 $$\begin{eqnarray}\unicode[STIX]{x1D716}^{-1}\left[-g^{ij}\frac{\unicode[STIX]{x2202}p^{\left(0\right)}}{\unicode[STIX]{x2202}y^{j}}+g^{jk}\frac{\unicode[STIX]{x2202}^{2}(v^{\left(0\right)})^{i}}{\unicode[STIX]{x2202}y^{j}\unicode[STIX]{x2202}y^{k}}\right]+\left[-g^{ij}\frac{\unicode[STIX]{x2202}p^{\left(1\right)}}{\unicode[STIX]{x2202}y^{j}}-g^{ij}\frac{\unicode[STIX]{x2202}p^{\left(0\right)}}{\unicode[STIX]{x2202}x^{j}}+g^{jk}\frac{\unicode[STIX]{x2202}^{2}(v^{\left(1\right)})^{i}}{\unicode[STIX]{x2202}y^{j}\unicode[STIX]{x2202}y^{k}}+{\mathcal{L}}^{i}\right]=0\end{eqnarray}$$
up to  $O(\unicode[STIX]{x1D716}^{1})$ corrections, where
 $$\begin{eqnarray}{\mathcal{L}}^{i}=g^{jk}\left[\frac{\unicode[STIX]{x2202}^{2}(v^{\left(0\right)})^{i}}{\unicode[STIX]{x2202}x^{j}\unicode[STIX]{x2202}y^{k}}+\frac{\unicode[STIX]{x2202}^{2}(v^{\left(0\right)})^{i}}{\unicode[STIX]{x2202}x^{k}\unicode[STIX]{x2202}y^{j}}+\unicode[STIX]{x1D6E4}_{jl}^{i}\frac{\unicode[STIX]{x2202}(v^{\left(0\right)})^{l}}{\unicode[STIX]{x2202}y^{k}}+\unicode[STIX]{x1D6E4}_{km}^{i}\frac{\unicode[STIX]{x2202}(v^{\left(0\right)})^{m}}{\unicode[STIX]{x2202}y^{j}}-\unicode[STIX]{x1D6E4}_{jk}^{m}\frac{\unicode[STIX]{x2202}(v^{\left(0\right)})^{i}}{\unicode[STIX]{x2202}y^{m}}\right].\end{eqnarray}$$
Similarly, the continuity equation (2.5) under both micro- and macroscales, takes the form
 $$\begin{eqnarray}\frac{\unicode[STIX]{x2202}(v^{\left(0\right)})^{i}}{\unicode[STIX]{x2202}y^{i}}+\unicode[STIX]{x1D716}\left(\frac{\unicode[STIX]{x2202}(v^{\left(1\right)})^{i}}{\unicode[STIX]{x2202}y^{i}}+\frac{\unicode[STIX]{x2202}(v^{\left(0\right)})^{i}}{\unicode[STIX]{x2202}x^{i}}+\unicode[STIX]{x1D6E4}_{ik}^{i}(v^{\left(0\right)})^{k}\right)+\unicode[STIX]{x1D716}^{2}\left(\frac{\unicode[STIX]{x2202}(v^{\left(2\right)})^{i}}{\unicode[STIX]{x2202}y^{i}}+\frac{\unicode[STIX]{x2202}(v^{\left(1\right)})^{i}}{\unicode[STIX]{x2202}x^{i}}+\unicode[STIX]{x1D6E4}_{ik}^{i}(v^{\left(1\right)})^{k}\right)=0\end{eqnarray}$$
up to  $O(\unicode[STIX]{x1D716}^{3})$ corrections.
2.4.1 Leading-order flow in the EGL
Substituting (2.10) into the momentum equation (2.12) and continuity equation (2.13), at  $O(\unicode[STIX]{x1D716}^{-1})$ and
 $O(1)$ we respectively obtain
 $$\begin{eqnarray}-g^{ij}(\boldsymbol{x})\frac{\unicode[STIX]{x2202}p^{\left(0\right)}}{\unicode[STIX]{x2202}y^{j}}+g^{jk}(\boldsymbol{x})\frac{\unicode[STIX]{x2202}^{2}(v^{\left(0\right)})^{i}}{\unicode[STIX]{x2202}y^{j}\unicode[STIX]{x2202}y^{k}}=0,\quad \frac{\unicode[STIX]{x2202}(v^{\left(0\right)})^{i}}{\unicode[STIX]{x2202}y^{i}}=0.\end{eqnarray}$$
The flow is subject to the traction matching condition, equation (2.6), which at leading order is
 $$\begin{eqnarray}\boldsymbol{h}^{(0)}=\boldsymbol{f}^{(0)}\quad \text{on }S_{i},\end{eqnarray}$$
where  $\boldsymbol{f}^{(0)}$ denotes the
 $O(1)$ traction applied at the lumen–EGL interface.
Given the linearity of the flow equations, we can consider, in turn, flows driven by each component of the imposed traction vector  $\boldsymbol{f}^{(0)}$. Also, since the governing equations (2.12) and (2.13) contain derivatives on the microscale only, we seek solutions that are separable in terms of their dependence upon the two different length scales
 $$\begin{eqnarray}v^{\left(0\right)}(\boldsymbol{x},\boldsymbol{y})=\unicode[STIX]{x1D736}_{l}(\boldsymbol{y})(f^{(0)})^{l}(\boldsymbol{x})+\boldsymbol{w}(\boldsymbol{y})Q(\boldsymbol{x}),\quad p^{\left(0\right)}(\boldsymbol{x},\boldsymbol{y})=p_{l}(\boldsymbol{y})(f^{(0)})^{l}(\boldsymbol{x})+q(\boldsymbol{y})Q(\boldsymbol{x})\end{eqnarray}$$
( $l=1,2,3$). The first terms allow us to satisfy continuity of traction at the EGL–lumen interface (2.6), while the second term allows us to satisfy pressure conditions at the inlet and outlet (2.8).
Substituting into (2.12) and (2.13), and exploiting linearity, we see that  $\unicode[STIX]{x1D736}_{l}$ and
 $p_{l}$ satisfy
 $$\begin{eqnarray}-g^{ij}(\boldsymbol{x})\frac{\unicode[STIX]{x2202}p_{l}}{\unicode[STIX]{x2202}y^{j}}+g^{jk}(\boldsymbol{x})\frac{\unicode[STIX]{x2202}^{2}\unicode[STIX]{x1D6FC}_{l}^{i}}{\unicode[STIX]{x2202}y^{j}\unicode[STIX]{x2202}y^{k}}=0,\quad \frac{\unicode[STIX]{x2202}\unicode[STIX]{x1D6FC}_{l}^{i}}{\unicode[STIX]{x2202}y^{i}}=0,\end{eqnarray}$$
subject to no flow on the solid surfaces in the unit cell (2.7), periodicity on the vertical surfaces, and unit traction in the  $y^{l}$ direction on the lumen–EGL interface.
The pressure-driven flow is governed by
 $$\begin{eqnarray}-g^{ij}(\boldsymbol{x})\frac{\unicode[STIX]{x2202}q}{\unicode[STIX]{x2202}y^{j}}+g^{jk}(\boldsymbol{x})\frac{\unicode[STIX]{x2202}^{2}w^{i}}{\unicode[STIX]{x2202}y^{j}\unicode[STIX]{x2202}y^{k}}=0,\quad \frac{\unicode[STIX]{x2202}w^{i}}{\unicode[STIX]{x2202}y^{i}}=0,\end{eqnarray}$$
subject to homogeneous boundary conditions on the interface and solid surface ( $S_{i}$ and
 $S_{w}$, respectively) and periodicity on the microscale. This is satisfied by the trivial solution
 $$\begin{eqnarray}\boldsymbol{w}=\mathbf{0},\quad q=q_{0},\end{eqnarray}$$
where  $q_{0}$ is some arbitrary constant.
In order to find  $Q$ it is necessary to go to higher order in
 $\unicode[STIX]{x1D716}$ (see § 2.4.3). We shall also find that, although the surface tractions from the flows at next order are formally an order of magnitude smaller than those at this order, they can make a significant contribution in terms of mechanotransduction through the EGL.
2.4.2 Next-order flow corrections in the EGL
Equating  $O(1)$ terms in (2.12), we obtain
 $$\begin{eqnarray}-g^{ij}\frac{\unicode[STIX]{x2202}p^{\left(1\right)}}{\unicode[STIX]{x2202}y^{j}}+g^{jk}\frac{\unicode[STIX]{x2202}^{2}(v^{\left(1\right)})^{i}}{\unicode[STIX]{x2202}y^{j}\unicode[STIX]{x2202}y^{k}}=g^{ij}\frac{\unicode[STIX]{x2202}p^{\left(0\right)}}{\unicode[STIX]{x2202}x^{j}}-{\mathcal{L}}v^{\left(0\right)},\end{eqnarray}$$
which, recalling (2.16) and (2.19), gives
 $$\begin{eqnarray}\displaystyle -g^{ij}\frac{\unicode[STIX]{x2202}p^{\left(1\right)}}{\unicode[STIX]{x2202}y^{j}}+g^{jk}\frac{\unicode[STIX]{x2202}^{2}(v^{\left(1\right)})^{i}}{\unicode[STIX]{x2202}y^{j}\unicode[STIX]{x2202}y^{k}} & = & \displaystyle A(\boldsymbol{x})+B^{in}(\boldsymbol{x})p_{n}(\boldsymbol{y})\nonumber\\ \displaystyle & & \displaystyle +\,C^{ln}(\boldsymbol{x})\frac{\unicode[STIX]{x2202}\unicode[STIX]{x1D6FC}_{n}^{i}}{\unicode[STIX]{x2202}y^{l}}(\boldsymbol{y})+D_{m}^{inl}(\boldsymbol{x})\frac{\unicode[STIX]{x2202}\unicode[STIX]{x1D6FC}_{n}^{m}}{\unicode[STIX]{x2202}y^{l}}(\boldsymbol{y})+E^{nl}(\boldsymbol{x})\frac{\unicode[STIX]{x2202}\unicode[STIX]{x1D6FC}_{n}^{i}}{\unicode[STIX]{x2202}y^{l}}(\boldsymbol{y}),\qquad\end{eqnarray}$$
where
 $$\begin{eqnarray}\displaystyle & & \displaystyle A^{i}(\boldsymbol{x})=g^{ij}\frac{\unicode[STIX]{x2202}Q}{\unicode[STIX]{x2202}x^{j}},\quad B^{in}(\boldsymbol{x})=g^{ij}\frac{\unicode[STIX]{x2202}(f^{(0)})^{n}}{\unicode[STIX]{x2202}x^{j}},\quad C^{ln}(\boldsymbol{x})=-2g^{jl}\frac{\unicode[STIX]{x2202}(f^{(0)})^{n}}{\unicode[STIX]{x2202}x^{j}},\nonumber\\ \displaystyle & & \displaystyle \quad D_{m}^{inl}(\boldsymbol{x})=-2g^{jl}\unicode[STIX]{x1D6E4}_{jm}^{i}(f^{(0)})^{n},\quad E^{nl}(\boldsymbol{x})=g^{jk}\unicode[STIX]{x1D6E4}_{jk}^{l}(f^{(0)})^{n}\end{eqnarray}$$
recalling that  $g^{kj}=g^{jk}$. From the
 $O(\unicode[STIX]{x1D716})$ terms in the continuity equation (2.13) and (2.16), we also have
 $$\begin{eqnarray}\frac{\unicode[STIX]{x2202}(v^{\left(1\right)})^{i}}{\unicode[STIX]{x2202}y^{i}}=-\unicode[STIX]{x1D6FC}_{n}^{m}(\boldsymbol{y})J_{m}^{n}(\boldsymbol{x}),\end{eqnarray}$$
where
 $$\begin{eqnarray}J_{m}^{n}(\boldsymbol{x})=\left(\frac{\unicode[STIX]{x2202}(f^{(0)})^{n}}{\unicode[STIX]{x2202}x^{m}}+\unicode[STIX]{x1D6E4}_{im}^{i}(f^{(0)})^{n}\right).\end{eqnarray}$$
These all satisfy no flow on the solid surfaces in the unit cell, and periodicity on the vertical surfaces. Note, however, that the  $O(\unicode[STIX]{x1D716})$ flow in the EGL,
 $\boldsymbol{v}^{\left(0\right)}$, will drive an
 $O(\unicode[STIX]{x1D716})$ flow in the lumen due to continuity of flow velocity at the lumen–EGL interface. This flow in the lumen will, in turn, exert an
 $O(\unicode[STIX]{x1D716})$ traction on the interface,
 $\boldsymbol{f}^{(1)}(\boldsymbol{x})$, which must be matched by the
 $\boldsymbol{v}^{\left(1\right)}$ flow.
This suggests seeking a flow decomposition of the form
 $$\begin{eqnarray}\boldsymbol{v}^{\left(1\right)}=\boldsymbol{v}_{1}^{^{\left(1\right)}}+\boldsymbol{v}_{2}^{^{\left(1\right)}}+\boldsymbol{v}_{3}^{^{\left(1\right)}}+\boldsymbol{v}_{4}^{^{\left(1\right)}}+\boldsymbol{v}_{5}^{^{\left(1\right)}}+\boldsymbol{v}_{6}^{^{\left(1\right)}}+\boldsymbol{v}_{7}^{^{\left(1\right)}},\end{eqnarray}$$
where
 $$\begin{eqnarray}\displaystyle \boldsymbol{v}_{1}^{^{\left(1\right)}} & = & \displaystyle A^{l}(\boldsymbol{x})(\unicode[STIX]{x1D737}_{1}(\boldsymbol{y}))_{l},\quad \boldsymbol{v}_{2}^{^{\left(1\right)}}=B^{ln}(\boldsymbol{x})(\unicode[STIX]{x1D737}_{2}(\boldsymbol{y}))_{ln},\nonumber\\ \displaystyle \quad \boldsymbol{v}_{3}^{^{\left(1\right)}} & = & \displaystyle C^{ln}(\boldsymbol{x})(\unicode[STIX]{x1D737}_{3}(\boldsymbol{y}))_{ln},\quad \boldsymbol{v}_{4}^{^{\left(1\right)}}=D(\boldsymbol{x})_{m}^{enl}(\unicode[STIX]{x1D737}_{4}(\boldsymbol{y}))_{enl}^{m},\nonumber\\ \displaystyle \boldsymbol{v}_{5}^{^{\left(1\right)}} & = & \displaystyle E(\boldsymbol{x})^{nl}(\unicode[STIX]{x1D737}_{5}(\boldsymbol{y}))_{nl},\quad \boldsymbol{v}_{6}^{^{\left(1\right)}}=J(\boldsymbol{x})_{m}^{n}(\unicode[STIX]{x1D737}_{6}(\boldsymbol{y}))_{n}^{m},\quad \boldsymbol{v}_{7}^{^{\left(1\right)}}=(f^{(1)}(\boldsymbol{x}))^{n}\unicode[STIX]{x1D736}_{n}(\boldsymbol{y}),\qquad\end{eqnarray}$$
where the  $\unicode[STIX]{x1D736}_{n}$ are the same unit cell problems as in (2.16), that satisfy unit traction on the lumen–EGL interface.
This suggests the following unit cell problems
 $$\begin{eqnarray}-g^{ij}\frac{\unicode[STIX]{x2202}(\unicode[STIX]{x03C0}_{1})_{l}}{\unicode[STIX]{x2202}y^{j}}+g^{jk}\frac{\unicode[STIX]{x2202}^{2}(\unicode[STIX]{x1D6FD}_{1})_{l}^{i}}{\unicode[STIX]{x2202}y^{j}\unicode[STIX]{x2202}y^{k}}=\unicode[STIX]{x1D6FF}_{l}^{i},\quad \frac{\unicode[STIX]{x2202}(\unicode[STIX]{x1D6FD}_{1})_{l}^{i}}{\unicode[STIX]{x2202}y^{i}}=0\end{eqnarray}$$
 $$\begin{eqnarray}-g^{ij}\frac{\unicode[STIX]{x2202}(\unicode[STIX]{x03C0}_{2})_{ln}}{\unicode[STIX]{x2202}y^{j}}+g^{jk}\frac{\unicode[STIX]{x2202}^{2}(\unicode[STIX]{x1D6FD}_{2})_{ln}^{i}}{\unicode[STIX]{x2202}y^{j}\unicode[STIX]{x2202}y^{k}}=\unicode[STIX]{x1D6FF}_{l}^{i}p_{n}(\boldsymbol{y}),\quad \frac{\unicode[STIX]{x2202}(\unicode[STIX]{x1D6FD}_{2})_{ln}^{i}}{\unicode[STIX]{x2202}y^{i}}=0\end{eqnarray}$$
 $$\begin{eqnarray}-g^{ij}\frac{\unicode[STIX]{x2202}(\unicode[STIX]{x03C0}_{4})_{enl}^{m}}{\unicode[STIX]{x2202}y^{j}}+g^{jk}\frac{\unicode[STIX]{x2202}^{2}(\unicode[STIX]{x1D6FD}_{4})_{enl}^{mi}}{\unicode[STIX]{x2202}y^{j}\unicode[STIX]{x2202}y^{k}}=\unicode[STIX]{x1D6FF}_{e}^{i}\frac{\unicode[STIX]{x2202}\unicode[STIX]{x1D6FC}_{n}^{m}}{\unicode[STIX]{x2202}y^{l}}(\boldsymbol{y}),\quad \frac{\unicode[STIX]{x2202}(\unicode[STIX]{x1D6FD}_{4})_{enl}^{mi}}{\unicode[STIX]{x2202}y^{i}}=0\end{eqnarray}$$
 $$\begin{eqnarray}-g^{ij}\frac{\unicode[STIX]{x2202}(\unicode[STIX]{x03C0}_{6})_{n}^{m}}{\unicode[STIX]{x2202}y^{j}}+g^{jk}\frac{\unicode[STIX]{x2202}^{2}(\unicode[STIX]{x1D6FD}_{6})_{n}^{mi}}{\unicode[STIX]{x2202}y^{j}\unicode[STIX]{x2202}y^{k}}=0,\quad \frac{\unicode[STIX]{x2202}(\unicode[STIX]{x1D6FD}_{6})_{n}^{mi}}{\unicode[STIX]{x2202}y^{i}}=-\unicode[STIX]{x1D6FC}_{n}^{m}(\boldsymbol{y}).\end{eqnarray}$$
Note that  $(\unicode[STIX]{x1D6FD}_{5})_{nl}^{i}=(\unicode[STIX]{x1D6FD}_{3})_{ln}^{i}=(\unicode[STIX]{x1D6FD}_{4})_{inl}^{ii}$ (no summation implied). These all satisfy zero traction on the EGL–lumen interface, no flow on the solid surfaces in the unit cell and periodicity on the vertical surfaces.
2.4.3 Leading-order pressure in the EGL
We can obtain an equation for  $Q$ from the
 $O(\unicode[STIX]{x1D716}^{2})$ terms in the continuity equation by taking the
 $O(\unicode[STIX]{x1D716}^{3})$ flow to be incompressible and integrating over the periodic microscopic unit cell
 $$\begin{eqnarray}\frac{\unicode[STIX]{x2202}(v^{\left(1\right)})^{i}}{\unicode[STIX]{x2202}x^{i}}+\unicode[STIX]{x1D6E4}_{ji}^{j}(v^{\left(1\right)})^{i}=0.\end{eqnarray}$$
Upon substitution of (2.23)
 $$\begin{eqnarray}\displaystyle & & \displaystyle \left(\frac{\unicode[STIX]{x2202}}{\unicode[STIX]{x2202}x^{i}}+\unicode[STIX]{x1D6E4}_{ji}^{j}\right)\left[(\unicode[STIX]{x1D6F1}_{1}^{(1)})_{l}^{i}g^{lj}\frac{\unicode[STIX]{x2202}Q}{\unicode[STIX]{x2202}x^{j}}\right]=\left(\frac{\unicode[STIX]{x2202}}{\unicode[STIX]{x2202}x^{i}}+\unicode[STIX]{x1D6E4}_{ji}^{j}\right)\left(-[(\unicode[STIX]{x1D6F1}_{8}^{(1)})_{ln}^{i}g^{lj}+(\unicode[STIX]{x1D6F1}_{6}^{(1)})_{n}^{ji}]\frac{\unicode[STIX]{x2202}(f^{(0)})^{n}}{\unicode[STIX]{x2202}x^{j}}\right.\nonumber\\ \displaystyle & & \displaystyle \quad +\left.[2(\unicode[STIX]{x1D6F1}_{4}^{(1)})_{enl}^{mi}g^{jl}\unicode[STIX]{x1D6E4}_{jm}^{e}-(\unicode[STIX]{x1D6F1}_{5}^{(1)})_{ln}^{i}g^{jk}\unicode[STIX]{x1D6E4}_{jk}^{l}-(\unicode[STIX]{x1D6F1}_{6})_{n}^{im}\unicode[STIX]{x1D6E4}_{im}^{i}](f^{(0)})^{n}-(\unicode[STIX]{x1D6F1}^{(0)})_{n}^{i}(f^{(1)})^{n}\right),\qquad\end{eqnarray}$$
where
 $$\begin{eqnarray}(\unicode[STIX]{x1D6F1}^{(0)})_{l}^{i}=(\bar{\unicode[STIX]{x1D6FC}})_{l}^{i},\quad (\unicode[STIX]{x1D6F1}_{1}^{(1)})_{l}^{i}=(\bar{\unicode[STIX]{x1D6FD}}_{1})_{l}^{i},\quad (\unicode[STIX]{x1D6F1}_{2}^{(1)})_{ln}^{i}=(\bar{\unicode[STIX]{x1D6FD}}_{2})_{ln}^{i},\quad (\unicode[STIX]{x1D6F1}_{3}^{(1)})_{ln}^{i}=(\bar{\unicode[STIX]{x1D6FD}}_{3})_{ln}^{i},\end{eqnarray}$$
 $$\begin{eqnarray}(\unicode[STIX]{x1D6F1}_{4}^{(1)})_{enl}^{mi}=(\bar{\unicode[STIX]{x1D6FD}}_{4})_{enl}^{mi},\quad (\unicode[STIX]{x1D6F1}_{5}^{(1)})_{ln}^{i}=(\bar{\unicode[STIX]{x1D6FD}}_{5})_{nl}^{i},\quad (\unicode[STIX]{x1D6F1}_{6}^{(1)})_{n}^{mi}=(\bar{\unicode[STIX]{x1D6FD}}_{6})_{n}^{mi},\end{eqnarray}$$
 $$\begin{eqnarray}(\unicode[STIX]{x1D6F1}_{7}^{(1)})_{n}^{i}=(\bar{\unicode[STIX]{x1D6FD}}_{7})_{n}^{i},\quad (\unicode[STIX]{x1D6F1}_{8}^{(1)})_{ln}^{i}=(\bar{\unicode[STIX]{x1D6FD}}_{2})_{ln}^{i}-2(\bar{\unicode[STIX]{x1D6FD}}_{3})_{ln}^{i}\end{eqnarray}$$
(no summation implied by repeating indices in the expression for  $\unicode[STIX]{x1D6F1}_{4}$) with
 $$\begin{eqnarray}\bar{(\cdot )}=\frac{1}{{\mathcal{V}}}\int (\cdot )\,\text{d}\boldsymbol{y}.\end{eqnarray}$$
This is subject to boundary conditions
 $$\begin{eqnarray}Q(S_{e}^{-\infty })=(P_{-\infty }-p_{l}(\,\boldsymbol{f}^{(0)})^{l})|_{S_{e}^{-\infty }},\quad Q(S_{e}^{\infty })=(P_{\infty }-p_{l}(\,\boldsymbol{f}^{(0)})^{l})|_{S_{e}^{\infty }}.\end{eqnarray}$$
However, we do not actually go to the trouble of solving for pressure, as we are interested in this study in the relative amount of pressure that is converted to loading on the vessel wall.
2.5 EGL mechanotransduction tensors
Integrating over the unit cell volumes, from (2.16) and (2.23) we can derive the macroscopic EGL flow velocity
 $$\begin{eqnarray}(\overline{v^{(0)}}(\boldsymbol{x}))^{i}=(\unicode[STIX]{x1D6F1}^{(0)})_{n}^{i}(f^{(0)})^{n},\end{eqnarray}$$
 $$\begin{eqnarray}\displaystyle & & \displaystyle (\overline{v^{(1)}}(\boldsymbol{x}))^{i}=(\unicode[STIX]{x1D6F1}_{1}^{(1)})_{l}^{i}\left(g^{lj}\frac{\unicode[STIX]{x2202}Q}{\unicode[STIX]{x2202}x^{j}}\right)+((\unicode[STIX]{x1D6F1}_{8}^{(1)})_{ln}^{i}g^{lj}+(\unicode[STIX]{x1D6F1}_{6}^{(1)})_{n}^{ji})\left(\frac{\unicode[STIX]{x2202}(f^{(0)})^{n}}{\unicode[STIX]{x2202}x_{j}}\right)\nonumber\\ \displaystyle & & \displaystyle \quad \times \,(-2(\unicode[STIX]{x1D6F1}_{4}^{(1)})_{enl}^{mi}(g^{jl}\unicode[STIX]{x1D6E4}_{jm}^{e})+(\unicode[STIX]{x1D6F1}_{5}^{(1)})_{nl}^{i}g^{jk}\unicode[STIX]{x1D6E4}_{jk}^{l}+(\unicode[STIX]{x1D6F1}_{6}^{(1)})_{n}^{mi}\unicode[STIX]{x1D6E4}_{im}^{i})(f^{(0)})^{n}+(\unicode[STIX]{x1D6F1}^{(0)})_{n}^{i}(f^{(1)})^{n}.\nonumber\\ \displaystyle & & \displaystyle\end{eqnarray}$$
 $O(\unicode[STIX]{x1D6FF})$ thickness (see appendix D).
From (2.35a) we can obtain the following tractions
 $$\begin{eqnarray}\displaystyle \overline{h}^{i}(\boldsymbol{x}) & = & \displaystyle (\unicode[STIX]{x1D6FA}^{(0)})_{n}^{i}(f^{(0)})^{n}+\unicode[STIX]{x1D716}\left[(\unicode[STIX]{x1D6FA}_{1}^{(1)})_{l}^{i}\left(g^{lj}\frac{\unicode[STIX]{x2202}Q}{\unicode[STIX]{x2202}x^{j}}\right)+((\unicode[STIX]{x1D6FA}_{8}^{(1)})_{ln}^{i}g^{lj}+(\unicode[STIX]{x1D6FA}_{6}^{(1)})_{n}^{ji})\left(\frac{\unicode[STIX]{x2202}(f^{(0)})^{n}}{\unicode[STIX]{x2202}x_{j}}\right)\right.\nonumber\\ \displaystyle & & \displaystyle \times \left.(-2(\unicode[STIX]{x1D6FA}_{4}^{(1)})_{enl}^{mi}(g^{jl}\unicode[STIX]{x1D6E4}_{jm}^{e})+(\unicode[STIX]{x1D6FA}_{5}^{(1)})_{nl}^{i}g^{jk}\unicode[STIX]{x1D6E4}_{jk}^{l}+(\unicode[STIX]{x1D6FA}_{6}^{(1)})_{n}^{mi}\unicode[STIX]{x1D6E4}_{im}^{i})(f^{(0)})^{n}+(\unicode[STIX]{x1D6FA}^{(0)})_{n}^{i}(f^{(1)})^{n}\right]\nonumber\\ \displaystyle & & \displaystyle\end{eqnarray}$$
 $\boldsymbol{x}\in S_{w}$, with
 $$\begin{eqnarray}(\unicode[STIX]{x1D6FA}^{(0)})_{n}^{i}=\frac{1}{{\mathcal{S}}_{p}}\int _{{\mathcal{A}}}(\unicode[STIX]{x1D714}_{0}(\boldsymbol{y}))_{l}^{i}\,\text{d}\boldsymbol{y},\quad (\unicode[STIX]{x1D6FA}_{1}^{(1)})_{n}^{i}=\frac{1}{{\mathcal{S}}_{p}}\int _{{\mathcal{A}}}(\unicode[STIX]{x1D714}_{1}(\boldsymbol{y}))_{l}^{i}\,\text{d}\boldsymbol{y},\quad \ldots\end{eqnarray}$$
etc., where  ${\mathcal{A}}$ denotes the surface of the vessel wall in a unit cell, which has total area
 ${\mathcal{S}}_{p}$, and with
 $(\unicode[STIX]{x1D74E}_{0})_{l}=(-p_{l}\boldsymbol{\cdot }\hat{\boldsymbol{n}}+\unicode[STIX]{x1D735}\unicode[STIX]{x1D736}_{l}+(\unicode[STIX]{x1D735}\unicode[STIX]{x1D736}_{l})^{\text{T}})\boldsymbol{\cdot }\hat{\boldsymbol{n}}|_{\boldsymbol{x}\in {\mathcal{S}}_{p}}$,
 $(\unicode[STIX]{x1D74E}_{1})_{l}=(-\unicode[STIX]{x03C0}_{l}\hat{\boldsymbol{n}}+\unicode[STIX]{x1D735}(\unicode[STIX]{x1D737}_{1})_{l}+(\unicode[STIX]{x1D735}(\unicode[STIX]{x1D737}_{1})_{l})^{\text{T}})\boldsymbol{\cdot }\hat{\boldsymbol{n}}|_{\boldsymbol{x}\in {\mathcal{S}}_{p}}$. The surface tractions associated with the other unit cell problems are defined analogously. Hence, we can see that the shear stresses on the endothelium are modulated not only by the applied interfacial tractions, but also the gradients of the tractions and the gradients of the pressures.
The transmission of loading through the solid components of the EGL can be quantified by the torque, given as
 $$\begin{eqnarray}\overline{\unicode[STIX]{x1D749}}^{(0)}(\boldsymbol{x})=\unicode[STIX]{x1D723}_{l}^{(0)}(f^{(0)}(\boldsymbol{x}))^{l}+O(\unicode[STIX]{x1D716}),\end{eqnarray}$$
where
 $$\begin{eqnarray}\unicode[STIX]{x1D723}_{l}^{(0)}=\int _{h_{min}}^{h_{max}}h\int _{S_{f}(y^{3}=h)}(\unicode[STIX]{x1D74E}_{0}(\boldsymbol{y}))_{l}\,\,\text{d}C(y^{1},y^{2})\,\,\text{d}h,\end{eqnarray}$$
where the contour integral is around the perimeter of the EGL structure at height  $h$, i.e.
 $S_{f}(y^{3}=h)$ (although in the idealised aggregated GAG model the particles are not physically in contact, we are supposing that the torque is transmitted by intermolecular attractions or some much smaller backbone molecule).
3 Numerical implementation
Four unit cell microstructures considered: (a) aggregated GAGs with hexagonal periodicity, (b) aggregated GAGs with rectangular periodicity, (c) core protein with hexagonal periodicity, (d) core protein with rectangular periodicity.

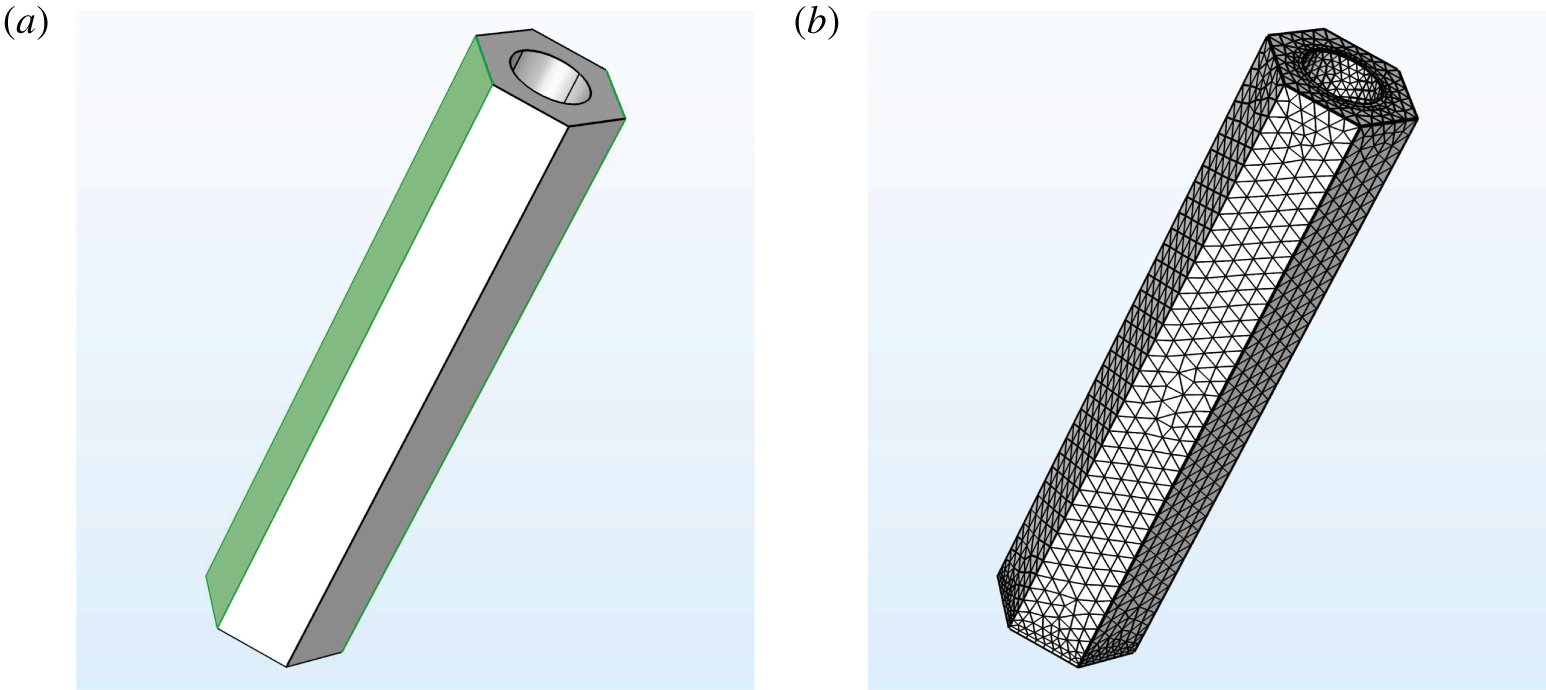
(a) An example unit cell geometry for a hexagonally periodic EGL microstructure. The volume illustrated is the flow domain where the fluid flows around the cylindrically shaped EGL brush in the centre. Due to periodicity, opposite faces take the same values. (b) An example mesh for the same geometry.

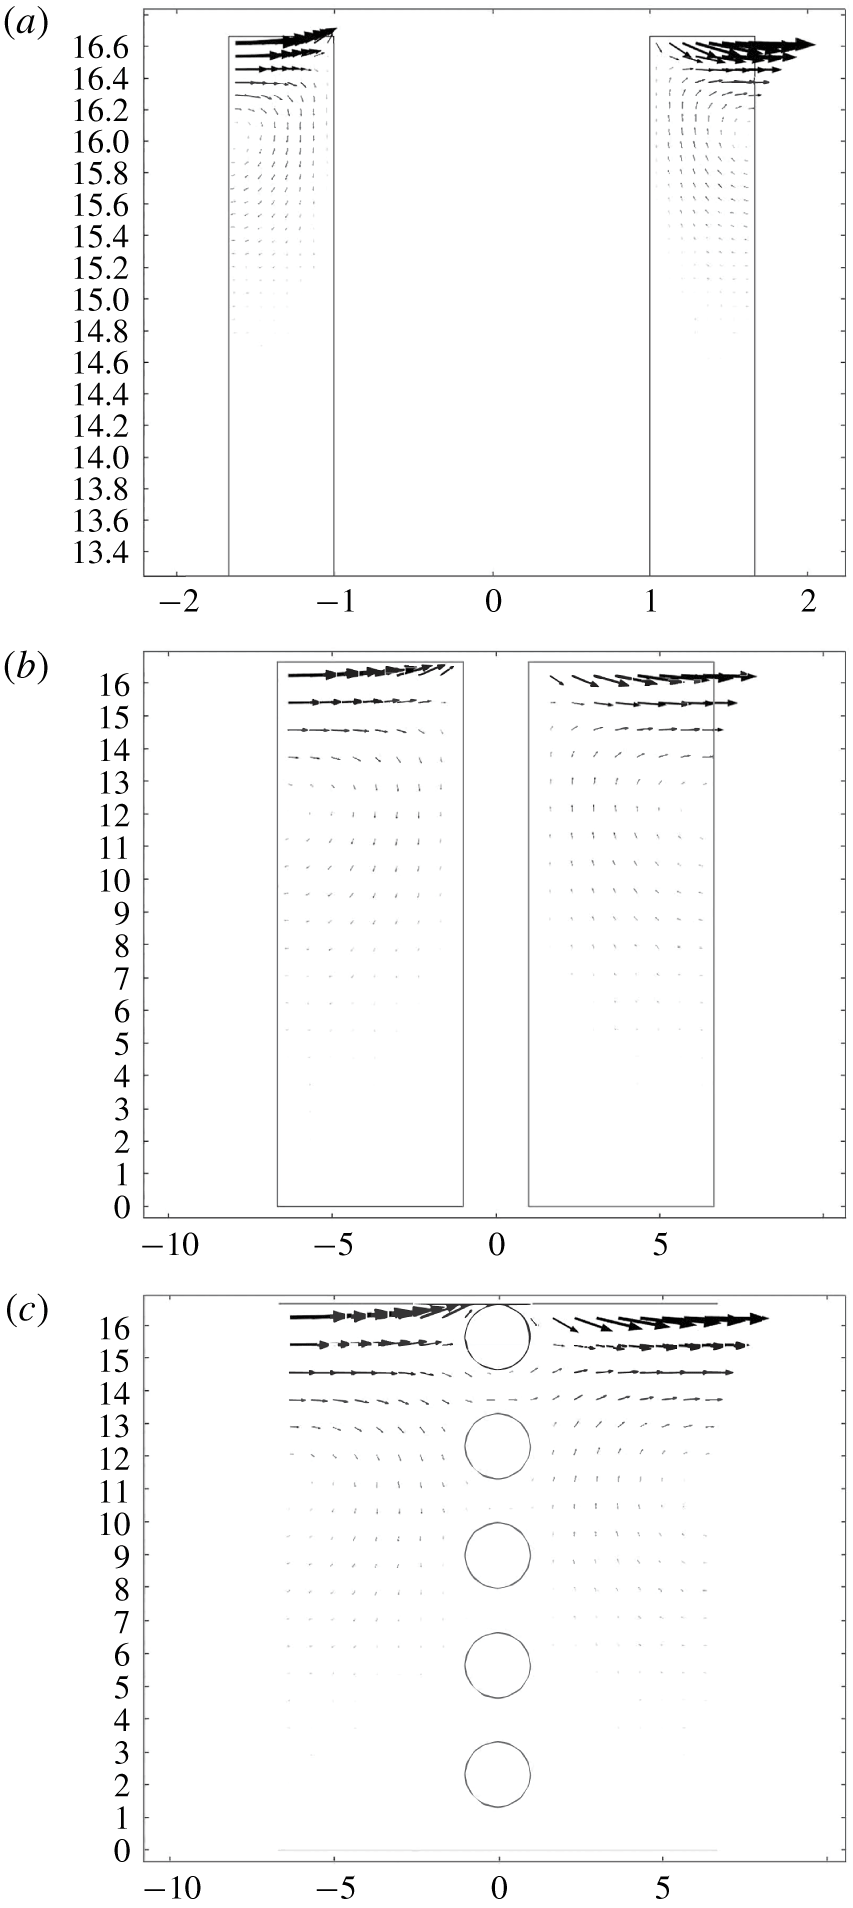
Velocity fields in the  $y_{1}{-}y_{3}$ plane of symmetry, for flows generated by unit traction forcing in the
 $y_{1}$ direction at the EGL–lumen interface, for the (a,b) core protein model and (c) aggregated GAG model with rectangular periodicity and
 $x$ spacings of (a)
 $a=20~\text{nm}$ (square unit cell) and (b,c)
 $a=80~\text{nm}$. (Note that the flow vectors in (a) have been increased by a scale factor of 2, to make them more visible, and plots flow in the top 20 % of the unit cell.) Axes are in non-dimensional units.

The unit cell problems (2.17), (2.24)–(2.27) were solved using the creeping flow interface in COMSOL Multiphysics (see figure 5). Note that these depend upon the value of the local metric tensor, however, we can apply a transformation to solve these unit cell problems in a Cartesian coordinate system (see appendix B for more details). The geometry of the EGL was created using the in-built design tools, and then discretised directly using a physics-controlled mesh, and with greater resolution near no-slip surfaces (see figure 6 for an example). This produced meshes with approximately 50 000–3 000 000 elements, depending upon the mesh convergence requirements. Each unit cell problem takes approximately 8 min to solve for the coarsest mesh, 15 min for the intermediate mesh and 8 h for the finest mesh on a standard four core desktop computer. The computational scheme was verified by considering a unit cell without any geometry present other than the lower boundary, for which an analytical expression can be derived (see appendix C for details).
4 Results
Our primary interest is the extent to which traction applied to the EGL–lumen interface, and pressure through the bulk EGL, are transmitted to the vessel wall, both in the form of stresses through the fluid phase, and torque through the EGL solid structure. This is quantified by the tensors  $\unicode[STIX]{x1D734}$ and
 $\unicode[STIX]{x1D723}$, respectively, as defined in § 2.5. In total there are 66 tensor components for each unit cell geometry, and in the supplementary materials (available at https://doi.org/10.1017/jfm.2020.249) we include full sets of components for some microstructural cases. However, only a handful of tensor components are non-negligible in magnitude, and it is these that we shall focus on in these results. (Note that the values of the tensor components presented here are those computed in a Cartesian space. Their values under a specific macroscopic vessel geometry would be modified according to the coordinate transformation described in § B.1, although it is not expected that the transformation would significantly change the order-of-magnitude trends reported here.)
Diagonal components of  $\unicode[STIX]{x1D734}^{(0)}$ and
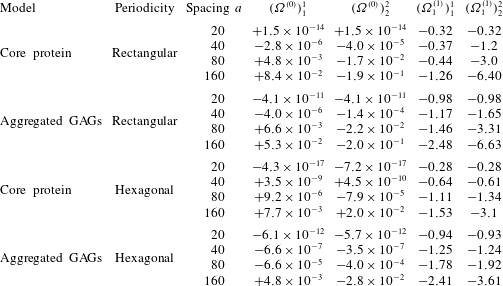
 $\unicode[STIX]{x1D734}_{1}^{(1)}$, which respectively convert interfacial stress to zeroth-order endothelial traction (columns 4–5) and pressure gradients to first-order endothelial traction (columns 6–7). Note that off-diagonal elements in both tensors are formally zero due to the EGL solid component lying on the
 $y^{1}$ and
 $y^{2}$ lines of symmetry in the unit cell.

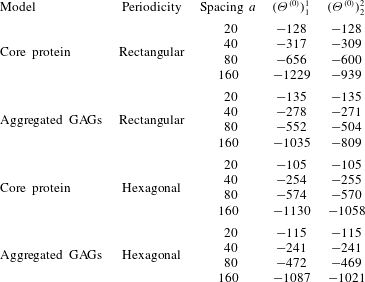
Table of values for diagonal components of  $\unicode[STIX]{x1D723}^{(0)}$, the zeroth-order torque induced by the interfacial traction (note that off-diagonal elements in both tensors are formally zero due to the EGL solid component lying on the
 $y^{1}$ and
 $y^{2}$ lines of symmetry in the unit cell).

The components of  $\unicode[STIX]{x1D734}^{(0)}$ detailed in table 1 give the proportion of
 $O(1)$ fluid traction applied at the EGL–lumen interface that is converted to
 $O(\unicode[STIX]{x1D716})$ fluid traction at the vessel wall (only diagonal components of the tensor are given since off-diagonal elements are formally zero by geometric symmetry). It is immediately obvious that, under all unit cell configurations, these coefficients are of very small magnitude. This is a reflection of the fact that the flows driven by interfacial traction do not penetrate deeply into the EGL, especially at the closer spacings, as illustrated in figure 7. Even in the case of aggregated GAGs, which provide less of an obstruction to fluid movement, the flow driven by interfacial traction is unable to penetrate much farther into the EGL than is observed for the core protein model, leading to comparable wall shears at similar spacings. (We also see evidence of the flux through the EGL–lumen interface, which drives an
 $O(\unicode[STIX]{x1D716})$ flow in the lumen, as discussed in § 2.4.2.)
By contrast, from the same table we see that the diagonal elements of  $\unicode[STIX]{x1D734}_{1}^{(1)}$ are larger in magnitude, and significantly so for the less elongated unit cell geometries. Recall that this tensor relates the
 $O(1)$ pressure gradients within the EGL to the
 $O(\unicode[STIX]{x1D716}^{2})$ tractions at the vessel wall. Given that
 $\unicode[STIX]{x1D716}=O(10^{-3}{-}10^{-2})$, whereas for
 $a=20$, 40 nm the elements of
 $\unicode[STIX]{x1D734}^{(0)}$ are seen to be
 $o(10^{-3})$ times smaller than those of
 $\unicode[STIX]{x1D734}^{(0)}$. This combined with the fact that the other
 $O(\unicode[STIX]{x1D716})$ tensors (
 $\unicode[STIX]{x1D734}_{j}$,
 $j=2,\ldots ,6$) are also much smaller than
 $\unicode[STIX]{x1D734}_{1}$ implies that the dominant contribution to vessel wall stress actually comes from mechanotransduction of applied pressure gradients within the EGL, rather than applied tractions at the lumen–EGL interface, in spite of the fact that the latter are formally an order of magnitude larger.
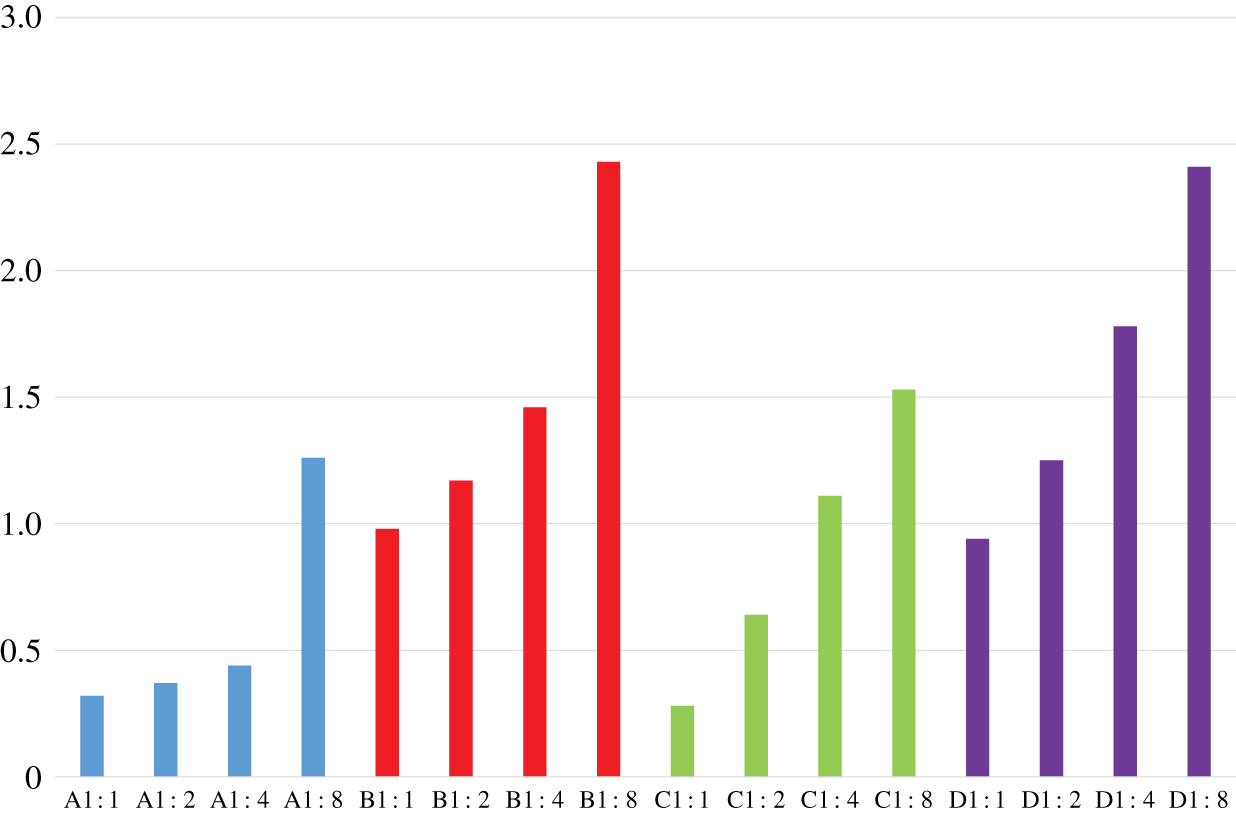
Transmission of loading through fluid phase of EGL: magnitude of  $(\unicode[STIX]{x1D6FA}^{(1)})_{1}^{1}$ assuming different microstructural organisations. Bar colours denote: core protein with rectangular periodicity (blue), aggregated GAGs with rectangular periodicity (red), core protein with hexagonal periodicity (green) and aggregated GAGs with hexagonal periodicity (purple). For each case we consider four different aspect ratios:
 $a=20~\text{nm}$ (1 : 1),
 $a=40~\text{nm}$ (2 : 1),
 $a=80~\text{nm}$ (4 : 1) and
 $a=160~\text{nm}$ (8 : 1).

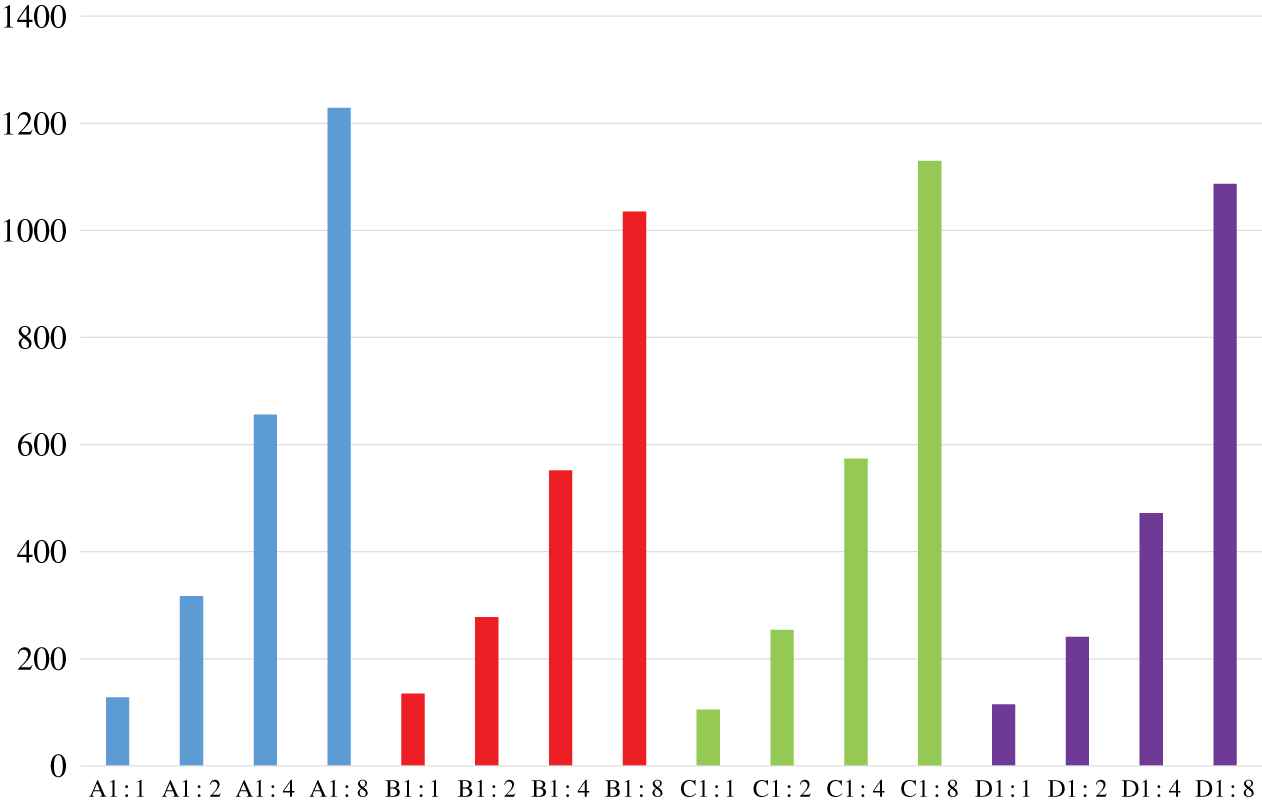
Transmission of loading through solid EGL components: magnitude of  $(\unicode[STIX]{x1D6E9}^{(0)})_{1}^{1}$ assuming different microstructural organisations. Bar colours denote: core protein with rectangular periodicity (blue), aggregated GAGs with rectangular periodicity (red), core protein with hexagonal periodicity (green) and aggregated GAGs with hexagonal periodicity (purple). For each case we consider four different aspect ratios:
 $a=20~\text{nm}$ (1 : 1),
 $a=40~\text{nm}$ (2 : 1),
 $a=80~\text{nm}$ (4 : 1) and
 $a=160~\text{nm}$ (8 : 1).

In figure 8 we explore the influence of microstructure geometry on conversion of pressures in the EGL to fluid tractions on the endothelium, by plotting the magnitude of  $(\unicode[STIX]{x1D6FA}^{(1)})_{1}^{1}$ under different unit cell configurations. What is immediately obvious is that the aggregated GAG configurations lead to significantly higher conversion of pressure gradients into applied tractions than seen for core protein configurations. Depending upon the spacing, there can be a 1.5–4-fold difference. We also see that EGL spacing has a marked effect on the mechanotransduction, with the largest spacings perhaps understandably seeing the largest conversions to fluid tractions on the wall. However, we do also observe that the sensitivity to the spacing does also depend upon the microstructure. In the case of rectangularly periodic core proteins, the spacing does not appear to have an appreciable impact until the most extreme case of
 $a=160~\text{nm}$. In terms of the effect of microstructural organisation, we observe a difference between core proteins and aggregated GAGs. For the case of the former, we see that for all but the smallest spacings, hexagonal periodicity leads to greater mechanotransduction. By contrast, however, in the case of aggregated GAGs we observe that rectangular periodicity leads to the greatest conversion of pressure gradients to wall tractions.
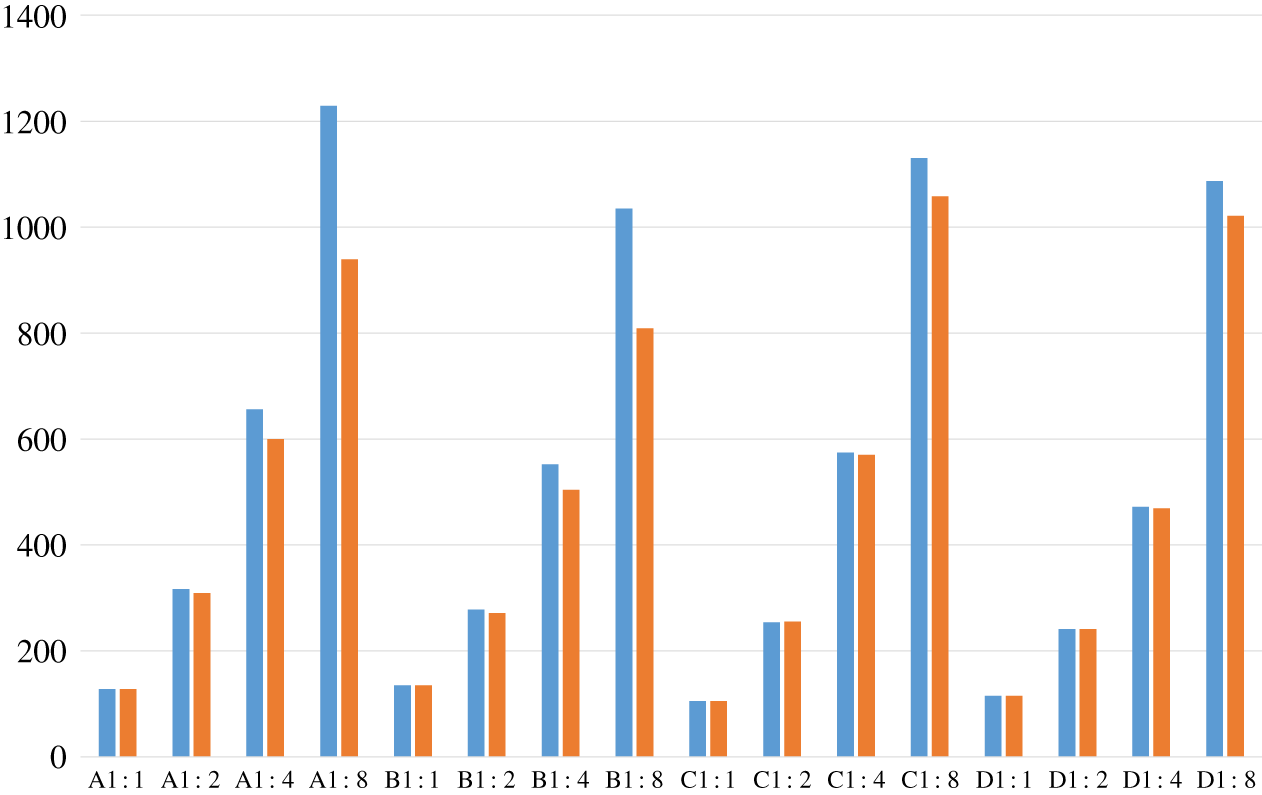
An analogous plot is provided in figure 9 for the conversion of applied interfacial tractions to torques on the vessel wall, as quantified by the magnitude of  $(\unicode[STIX]{x1D6E9}^{(0)})_{1}^{1}$ under different unit cell microstructures (see also Table 2). We first observe the previously known fact that the magnitude of the torques is several orders of magnitudes larger than the magnitude of the fluid traction, which fits with the notion of the EGL playing a role in converting fluid loading to solid loading in the EGL, thereby protecting the endothelium from damaging levels of fluid stress (Lee et al. Reference Lee, Long and Clarke2016). As was the case with the conversion of pressure gradients to surface tractions, we see that as the spacings between EGL components increase, so too does the mechanotransduction. We do, however, observe that the mechanotransduction of torques appears to be less sensitive than surface tractions to nature of the EGL components (e.g. core protein versus aggregated GAGs) and periodic arrangement.
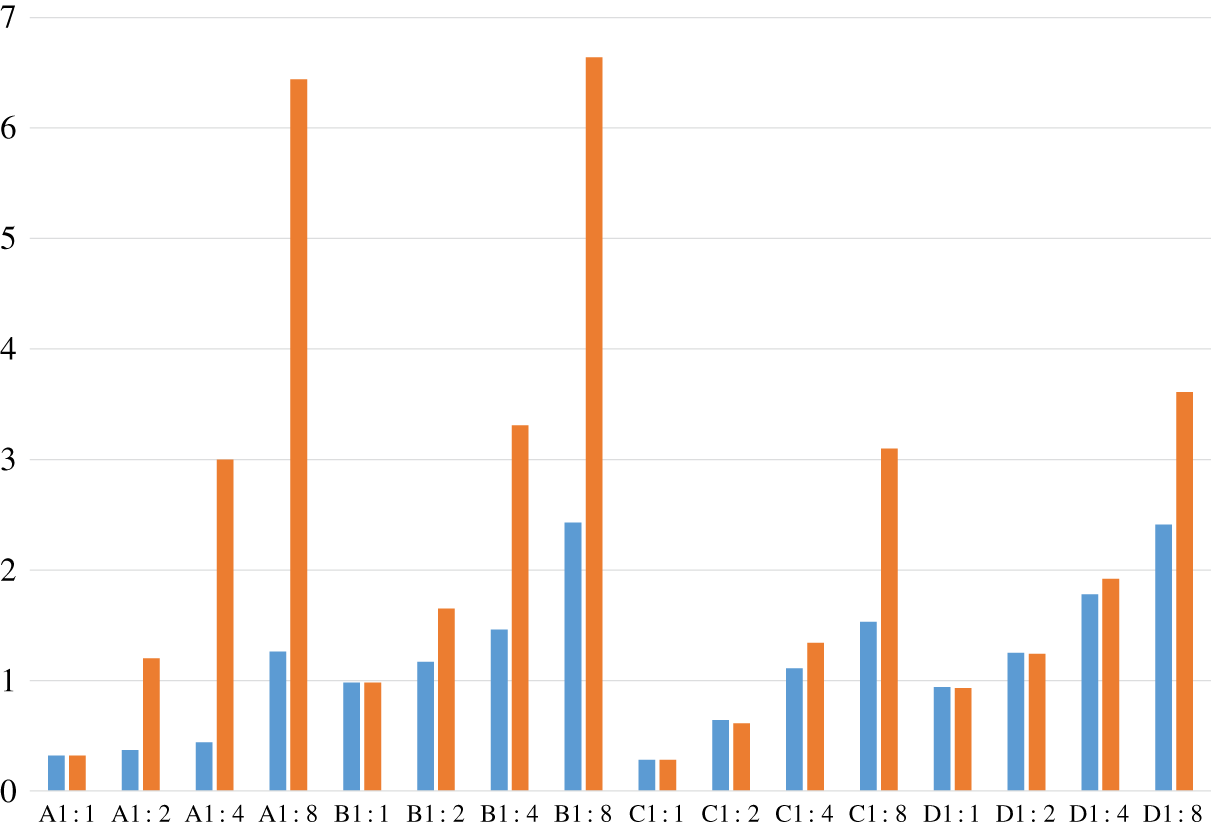
Transmission of loading through fluid phase of EGL: magnitudes of  $(\unicode[STIX]{x1D6FA}^{(1)})_{1}^{1}$ (blue) and
 $(\unicode[STIX]{x1D6FA}^{(1)})_{2}^{2}$ (orange) under both the core protein (A,C) and aggregated GAG models (B,D), arranged with both rectangular (A,B) and hexagonal periodicity (C,D) and at spacings
 $a=20$, 40, 80 and 160.

Transmission of loading through solid EGL components: magnitudes of  $(\unicode[STIX]{x1D6E9}^{(0)})_{1}^{1}$ (blue) and
 $(\unicode[STIX]{x1D6E9}^{(0)})_{2}^{2}$ (orange) under both the core protein (A,C) and aggregated GAG models (B,D), arranged with both rectangular (A,B) and hexagonal periodicity (C,D) and at spacings
 $a=20$, 40, 80 and 160.

In figures 10 and 11 we explore the influence of EGL microstructure on mechanotransductive anisotropy. In terms of the conversion of pressure to surface traction, by plotting  $(\unicode[STIX]{x1D6FA}^{(1)})_{1}^{1}$ alongside
 $(\unicode[STIX]{x1D6FA}^{(1)})_{2}^{2}$ for each configuration, we observe that the rectangular arrangements are most sensitive to geometric anisotropy. By contrast, under hexagonal periodicity, anisotropy in the mechanotransduction only really becomes evident at the largest spacings of
 $a=160~\text{nm}$. However, with regards the conversion of applied interfacial traction to torque, figure 11 suggests relatively little sensitivity to the specifics of the EGL microstructure, e.g. core protein or aggregated GAGs. Also, to the form of the periodic arrangement of the EGL components, except at the largest separations where we see some anisotropy in torque under rectangular periodicity.
5 Discussion
In this study we have examined how the form of the EGL microstructure affects its ability to convert fluid loading to mechanical forces on the underlying vessel wall. In the immediate context this has important implications for biomechanical processes such as vascular remodelling, but the approach developed here could also be used to analyse other situations where fluid flows adjacent to surfaces coated with a thin porous layer of well-defined periodic microstructure.
Our analysis exploits the difference in scale between the EGL microstructure and the vessel dimensions, and by modifying the standard homogenisation approach for Stokes flow, we were able to consider a microstructure that is periodic in two directions only. The fact that these periodic directions conform to an arbitrary two-dimensional surface embedded in three-dimensional space did require us to formulate the problem in general tensorial form. This also allowed us to isolate the tensors which describe the transmission of loading through an EGL of particular microstructure, independently of the bulk vessel geometry. In the direction perpendicular to the vessel wall we enforced no-slip at the cell wall, and continuity of fluid tractions and velocities at the lumen–EGL interface. This means that the flow around the EGL microstructure is modulated by the macroscopic applied interfacial traction and its gradients. This is in addition to the macroscopic pressure gradients that are usually the sole bulk modulators under three-dimensional homogenisation.
We find that in terms of its basic structure, on one level our homogenised flow velocities resembles what is obtained when Brinkman flow is written in an asymptotically thin layer that conforms to the vessel wall geometry (see appendix D). There is a D’Arcy relationship connecting velocity to pressure gradients, as well as additional viscous terms which contain the applied traction and its gradients. The principal difference between what is obtained from Brinkman, as compared with our homogenised model, is in terms of the information that is carried about the EGL microstructure. In our homogenised model, the values of the coefficients are informed by the EGL microstructure, and change as this microstructure changes. By contrast, in the case of Brinkman flow all of the microstructural information (e.g. porosity, tortuosity) is carried in the hydraulic resistivity coefficient, and for moderate permeability we see that this does not appear in the thin-layer equations. Under very low permeabilities it does influence the EGL flow, but in a more limited manner than in our homogenised model, where microstructural coefficients multiply all terms in the expression for flow velocity. This therefore illustrates the pitfalls of using standard porous flow models that have been obtained using three-dimensional homogenisation to describe porous flows in very thin regions, such as the EGL, that only exhibit two-dimensional microstructural organisation with characteristic length scale comparable to the layer thickness.
The different idealised EGL microstructural geometries we have considered here have been inspired by the current experimental literature. When exploring the impact of these microstructures upon mechanotransduction, we observe that the aggregated GAG configuration leads to noticeably greater conversion of pressure gradients to wall shear. In terms of the conversion of applied loading to torques though, there was less sensitivity to EGL microstructure and organisation, perhaps suggesting that the efficacy of cell remodelling does not depend particularly strongly on the precise details of the EGL microstructure. However, greater spacing of the EGL microstructure was seen to produce significantly increased mechanotransduction, both in terms of wall traction and torques, which is potentially relevant since it is known that EGL density can vary as a function of local flow conditions (Lee et al. Reference Lee, Long and Clarke2016). We also observed that anisotropy of the EGL microstructure was mirrored to some extent in the conversion of EGL pressure gradients to wall tractions, but less so in terms of the torques.
The distinction between transmitted torques and fluid shears is important, since it is known that these two types of loadings trigger different responses in the endothelial cells. Fluid shear is sensed directly by shear receptors embedded in the cell wall, and transmitted to the cell basal surface through stress fibres, where it leads to redistribution of proteins which play a role in extracellular matrix adhesion (such as vinculin and paxillin). By contrast, the torques are transmitted to the peripheral actin band within the cell, and are implicated in the unzipping of the adherens junctions during endothelial remodelling (Weinbaum et al. Reference Weinbaum, Tarbell and Damiano2007).
At leading order we found that both the wall traction and torques are formally driven by applied interfacial traction, although when we actually evaluate the coefficients we find that wall traction is dominated by macroscopic pressure gradients, in spite of these being asymptotically at an higher order. The torques, however, remain dominated by applied interfacial tractions. This has potentially physiological importance, since the pressure gradients in the EGL depend primarily upon the EGL microstructure and upstream and downstream pressure conditions, whereas the applied interfacial tractions can be expected to depend upon the details of the luminal flow, for example the passage of blood cells. The implication being that transmission of loading through the solid component of the EGL may be more sensitive to the details of the flow through the vessel lumen than is the wall traction.
It is natural to wonder whether the predicted relationship between mechanotransduction and EGL microstructures might be measurable in experiments. Whereas experiments have been able to infer information regarding EGL microstructural organisation, direct measurements of the transmitted forces and torques on a cell membrane would be extremely challenging. Cell mechanobiology experiments instead focus on the effects of the applied membrane loadings on cell response. For example, by fluorescently labelling key cytoskeletal cell components, such as the stress fibres and dense peripheral actin band, Thi et al. (Reference Thi, Tarbell, Weinbaum and Spray2004) were able to examine how these components reorganise when the cell is subjected to prescribed fluid shear stresses in a flow control chamber. Other experiments have examined the extent to which certain cell adhesion proteins, such as vinculin, are activated in the cell under mechanical loading (Jansen, Atherton & Ballestrem Reference Jansen, Atherton and Ballestrem2017). These different experimental approaches are useful since, as discussed above, applied fluid shear stresses and torques trigger different cell responses, and so may also provide a means of differentiating between transmitted torques and shears. Of course, our model predicts only transmitted loadings, not the effect of those upon the cell. In order to compare with the above kinds of experimental data, our predictions would need to be fed into cell cytoskeleton reorganisation models, of the kind developed by Debagh et al. (Reference Debagh, Jalali, Butler and Tarbell2014). This would also give an indication as to whether the changes to the transmitted loadings reported here under the different EGL microstructures would translate into experimentally observable differences in cell response.
Of course we have made a number of idealisations in order to make progress in understanding the influence of EGL microstructure upon its role as a mechanotransducer. Whereas we have only considered the static backbone of the EGL, there is a much more dynamic and less organised upper layer that consists of weakly bound long-chain molecules and components that come in-and-out of solution with the blood. It may be possible and useful to incorporate this outer layer into the model by treating it as a non-Newtonian polymer solution. We have also considered the EGL components to be rigid, whereas in practise they can deform when sufficiently loaded. Incorporating some form of elasticity into the core protein and aggregated GAG models may be appropriate when considering situations where the EGL becomes significantly deformed, for example, during the passage of relatively large and rigid leukocytes through small capillaries. Longer term, it would be especially interesting to incorporate the applied loadings as inputs to models of the cell biochemistry implicated in the expression of EGL on the cell surface, as well as models for endothelial remodelling, and hence create a closed mechanotransduction loop.
Acknowledgements
Computations were computed on the New Zealand eScience Infrastructure (NeSI) High Performance Computing Facility. T.C.L. was funded by a University of Auckland Doctoral Scholarship. The authors would also like to acknowledge useful discussions with Dr D. Long in the early stages of this work, and would like to thank the reviewers for their constructive and helpful observations and suggestions.
Declaration of interests
The authors report no conflict of interest.
Supplementary materials
Supplementary materials are available at https://doi.org/10.1017/jfm.2020.249.
Appendix A. Metric
Under the definitions of § 2.1 the metric tensor is given by
 $$\begin{eqnarray}g_{ij}=\frac{\unicode[STIX]{x2202}{\mathcal{S}}^{k}}{\unicode[STIX]{x2202}x^{i}}\frac{\unicode[STIX]{x2202}{\mathcal{S}}^{k}}{\unicode[STIX]{x2202}x^{j}},\end{eqnarray}$$
where repeated indices denote summation. For a point on the surface ( $x^{3}=0$) this simplifies to
 $$\begin{eqnarray}g_{11}=\left(\frac{\unicode[STIX]{x2202}{\mathcal{F}}^{1}}{\unicode[STIX]{x2202}x^{1}}\right)^{2}+\left(\frac{\unicode[STIX]{x2202}{\mathcal{F}}^{2}}{\unicode[STIX]{x2202}x^{1}}\right)^{2}+\left(\frac{\unicode[STIX]{x2202}{\mathcal{F}}^{3}}{\unicode[STIX]{x2202}x^{1}}\right)^{2},\quad g_{22}=\left(\frac{\unicode[STIX]{x2202}{\mathcal{F}}^{1}}{\unicode[STIX]{x2202}x^{2}}\right)^{2}+\left(\frac{\unicode[STIX]{x2202}{\mathcal{F}}^{2}}{\unicode[STIX]{x2202}x^{2}}\right)^{2}+\left(\frac{\unicode[STIX]{x2202}{\mathcal{F}}^{3}}{\unicode[STIX]{x2202}x^{2}}\right)^{2}\end{eqnarray}$$
 $$\begin{eqnarray}g_{12}=g_{21}=\frac{\unicode[STIX]{x2202}{\mathcal{F}}^{1}}{\unicode[STIX]{x2202}x^{1}}\frac{\unicode[STIX]{x2202}f^{1}}{\unicode[STIX]{x2202}x^{2}}+\frac{\unicode[STIX]{x2202}{\mathcal{F}}^{2}}{\unicode[STIX]{x2202}x^{1}}\frac{\unicode[STIX]{x2202}{\mathcal{F}}^{2}}{\unicode[STIX]{x2202}x^{2}}+\frac{\unicode[STIX]{x2202}{\mathcal{F}}^{3}}{\unicode[STIX]{x2202}x^{1}}\frac{\unicode[STIX]{x2202}{\mathcal{F}}^{3}}{\unicode[STIX]{x2202}x^{2}}\end{eqnarray}$$
 $$\begin{eqnarray}g_{13}=g_{31}=0,\quad g_{23}=g_{32}=0,\quad g_{33}=1.\end{eqnarray}$$
We also define the inverse metric tensor,  $g^{ij}=g_{ij}^{-1}$. First and second covariant derivatives will be defined using comma index notation
 $$\begin{eqnarray}a_{,j}^{i}=\frac{\unicode[STIX]{x2202}a^{i}}{\unicode[STIX]{x2202}x^{j}}+\unicode[STIX]{x1D6E4}_{jk}^{i}a^{k},\end{eqnarray}$$
 $$\begin{eqnarray}a_{,jk}^{i}=\frac{\unicode[STIX]{x2202}}{\unicode[STIX]{x2202}x^{k}}\left(\frac{\unicode[STIX]{x2202}a^{i}}{\unicode[STIX]{x2202}x^{j}}+\unicode[STIX]{x1D6E4}_{jl}^{i}a^{l}\right)+\unicode[STIX]{x1D6E4}_{km}^{i}\left(\frac{\unicode[STIX]{x2202}a^{m}}{\unicode[STIX]{x2202}x^{j}}+\unicode[STIX]{x1D6E4}_{jl}^{m}a^{l}\right)-\unicode[STIX]{x1D6E4}_{jk}^{m}\left(\frac{\unicode[STIX]{x2202}a^{i}}{\unicode[STIX]{x2202}x^{m}}+\unicode[STIX]{x1D6E4}_{ml}^{i}a^{l}\right),\end{eqnarray}$$
respectively, where the Christoffel symbol is given by
 $$\begin{eqnarray}\unicode[STIX]{x1D6E4}_{ij}^{k}=\frac{1}{2}g^{km}\left(\frac{\unicode[STIX]{x2202}g_{mj}}{\unicode[STIX]{x2202}x_{i}}+\frac{\unicode[STIX]{x2202}g_{im}}{\unicode[STIX]{x2202}x_{j}}-\frac{\unicode[STIX]{x2202}g_{ij}}{\unicode[STIX]{x2202}x_{m}}\right).\end{eqnarray}$$
Appendix B. Multiscale covariant derivatives
In the EGL, the first and second covariant derivatives can be expressed in terms of both moderate and small scales
 $$\begin{eqnarray}a_{,j}^{i}=\frac{\unicode[STIX]{x2202}a^{i}}{\unicode[STIX]{x2202}x^{j}}+\unicode[STIX]{x1D6E4}_{jk}^{i}a^{k}+\frac{1}{\unicode[STIX]{x1D716}}\frac{\unicode[STIX]{x2202}a}{\unicode[STIX]{x2202}y^{i}},\end{eqnarray}$$
and
 $$\begin{eqnarray}\displaystyle a_{,jk}^{i} & = & \displaystyle \frac{\unicode[STIX]{x2202}}{\unicode[STIX]{x2202}x^{k}}\left(\frac{\unicode[STIX]{x2202}a^{i}}{\unicode[STIX]{x2202}x^{j}}+\unicode[STIX]{x1D6E4}_{jl}^{i}a^{l}\right)+\frac{\unicode[STIX]{x2202}}{\unicode[STIX]{x2202}x^{k}}\left(\frac{1}{\unicode[STIX]{x1D716}}\frac{\unicode[STIX]{x2202}a^{i}}{\unicode[STIX]{x2202}y^{j}}\right)\nonumber\\ \displaystyle & & \displaystyle +\,\frac{1}{\unicode[STIX]{x1D716}}\frac{\unicode[STIX]{x2202}}{\unicode[STIX]{x2202}y^{k}}\left(\frac{\unicode[STIX]{x2202}a^{i}}{\unicode[STIX]{x2202}x^{j}}+\unicode[STIX]{x1D6E4}_{jl}^{i}a^{l}\right)+\frac{1}{\unicode[STIX]{x1D716}}\frac{\unicode[STIX]{x2202}}{\unicode[STIX]{x2202}y^{k}}\left(\frac{1}{\unicode[STIX]{x1D716}}\frac{\unicode[STIX]{x2202}a^{i}}{\unicode[STIX]{x2202}y^{j}}\right)-\left(\frac{1}{\unicode[STIX]{x1D716}}\unicode[STIX]{x1D6E4}_{jk}^{m}\frac{\unicode[STIX]{x2202}a^{i}}{\unicode[STIX]{x2202}y^{m}}\right)\nonumber\\ \displaystyle & & \displaystyle +\,\unicode[STIX]{x1D6E4}_{km}^{i}\left(\frac{\unicode[STIX]{x2202}a^{m}}{\unicode[STIX]{x2202}x^{j}}+\unicode[STIX]{x1D6E4}_{jl}^{m}a^{l}\right)+\unicode[STIX]{x1D6E4}_{km}^{i}\left(\frac{1}{\unicode[STIX]{x1D716}}\frac{\unicode[STIX]{x2202}a^{m}}{\unicode[STIX]{x2202}y^{j}}\right)-\unicode[STIX]{x1D6E4}_{jk}^{m}\left(\frac{\unicode[STIX]{x2202}a^{i}}{\unicode[STIX]{x2202}x^{m}}+\unicode[STIX]{x1D6E4}_{ml}^{i}a^{l}\right),\end{eqnarray}$$
respectively.
B.1 Local Cartesian system
We describe here the transformation that will convert the unit cell problems (2.24)–(2.26) into Cartesian form. Two vectors that are locally tangential to the surface are given by
 $$\begin{eqnarray}\boldsymbol{t}_{1}=(\unicode[STIX]{x2202}{\mathcal{F}}^{1}/\unicode[STIX]{x2202}x^{1},\unicode[STIX]{x2202}{\mathcal{F}}^{2}/\unicode[STIX]{x2202}x^{1},\unicode[STIX]{x2202}{\mathcal{F}}^{3}/\unicode[STIX]{x2202}x^{1}),\quad \boldsymbol{t}_{2}=(\unicode[STIX]{x2202}{\mathcal{F}}^{1}/\unicode[STIX]{x2202}x^{2},\unicode[STIX]{x2202}{\mathcal{F}}^{2}/\unicode[STIX]{x2202}x^{2},\unicode[STIX]{x2202}{\mathcal{F}}^{3}/\unicode[STIX]{x2202}x^{2}),\end{eqnarray}$$
where the functions  ${\mathcal{F}}^{i}$ are those defining the vessel wall (2.1). Constructing unit tangents,
 $\hat{\boldsymbol{t}}_{1}=\boldsymbol{t}_{1}/|\boldsymbol{t}_{1}|$ and
 $\hat{\boldsymbol{t}}_{2}=\boldsymbol{t}_{2}/|\boldsymbol{t}_{2}|$, we can find the unit normal vector to the surface
 $\hat{\boldsymbol{n}}=\hat{\boldsymbol{t}}_{1}\times \hat{\boldsymbol{t}}_{2}$. We can then compute a new local tangent vector,
 $\overline{\boldsymbol{t}}_{2}=\hat{\boldsymbol{t}}_{1}\times \hat{\boldsymbol{n}}$, that is perpendicular to both
 $\hat{\boldsymbol{t}}_{1}$ and
 $\hat{\boldsymbol{n}}$. If for notational convenience if we define
 $\overline{\boldsymbol{t}}_{1}=\hat{\boldsymbol{t}}_{1}$ and
 $\overline{\boldsymbol{n}}=\hat{\boldsymbol{n}}$, then we have defined a new locally orthogonal basis
 $(\overline{\boldsymbol{t}}_{1},\overline{\boldsymbol{t}}_{2},\overline{\boldsymbol{n}})$ which is Euclidean, i.e. has a diagonal local metric tensor
 $$\begin{eqnarray}\bar{g}=\left(\begin{array}{@{}ccc@{}}\bar{g}_{11} & 0 & 0\\ 0 & \bar{g}_{22} & 0\\ 0 & 0 & \bar{g}_{33}\end{array}\right).\end{eqnarray}$$
We shall define a local microscopic Euclidean coordinate system aligned with these axes by  $\overline{\boldsymbol{x}}=(\overline{x}_{1},\overline{x}_{2},\overline{x}_{3})$. However, since
 $\bar{g}_{11}$,
 $\bar{g}_{22}$ and
 $\bar{g}_{33}$ are not generally equal, this is not yet a Cartesian system, although this can be achieved by rescaling our variables and coordinates
 $$\begin{eqnarray}\bar{y}^{i}=\sqrt{g_{ii}}\,{\tilde{y}}^{i},\quad u^{i}=\sqrt{g_{ii}}\,\tilde{u} ^{i},\quad p=\tilde{p}\end{eqnarray}$$
(no summation implied here by repeated indices), which leads to
 $$\begin{eqnarray}\tilde{\unicode[STIX]{x1D6FB}}^{2}\tilde{\boldsymbol{v}}_{l}-\tilde{\unicode[STIX]{x1D735}}p_{l}=0,\quad \tilde{\unicode[STIX]{x1D735}}\boldsymbol{\cdot }\tilde{\boldsymbol{v}}_{l}=0,\end{eqnarray}$$
where  $\tilde{\unicode[STIX]{x1D6FB}}^{2}=\unicode[STIX]{x2202}^{2}/\unicode[STIX]{x2202}{\tilde{y}}_{1}^{2}+\unicode[STIX]{x2202}^{2}/\unicode[STIX]{x2202}{\tilde{y}}_{2}^{2}+\unicode[STIX]{x2202}^{2}/\unicode[STIX]{x2202}{\tilde{y}}_{3}^{2}$ and
 $\tilde{\unicode[STIX]{x1D735}}=(\unicode[STIX]{x2202}/\unicode[STIX]{x2202}{\tilde{y}}_{1},\unicode[STIX]{x2202}/\unicode[STIX]{x2202}{\tilde{y}}_{2},\unicode[STIX]{x2202}/\unicode[STIX]{x2202}{\tilde{y}}_{3})$, i.e. familiar Stokes equations in Cartesian coordinates.
The transformation between these two coordinate systems is then given by
 $$\begin{eqnarray}\frac{\unicode[STIX]{x2202}x_{i}}{\unicode[STIX]{x2202}\overline{x_{j}}}=\frac{\unicode[STIX]{x2202}x_{i}}{\unicode[STIX]{x2202}f_{k}}\frac{\unicode[STIX]{x2202}f_{k}}{\unicode[STIX]{x2202}\overline{x_{j}}}=\left[\frac{\unicode[STIX]{x2202}f_{k}}{\unicode[STIX]{x2202}x_{i}}\right]^{-1}\frac{\unicode[STIX]{x2202}f_{k}}{\unicode[STIX]{x2202}\overline{x_{j}}},\end{eqnarray}$$
where
 $$\begin{eqnarray}\frac{\unicode[STIX]{x2202}f_{k}}{\unicode[STIX]{x2202}x_{i}}=\left(\begin{array}{@{}c@{}}\hat{t}_{1},\hat{t}_{2},\hat{n}\end{array}\right),\quad \frac{\unicode[STIX]{x2202}f_{k}}{\unicode[STIX]{x2202}\overline{x_{j}}}=\left(\begin{array}{@{}c@{}}\overline{t}_{1},\overline{t}_{2},\overline{n}\end{array}\right).\end{eqnarray}$$
We can now transform any tensor computed in a local Cartesian system ( $\tilde{x}_{1},\tilde{x}_{2},\tilde{x}_{3}$) (and, equivalently (
 ${\tilde{y}}_{1},{\tilde{y}}_{2},{\tilde{y}}_{3}$) since we assume microscopic and macroscopic local coordinates share the same basis), into the global macroscopic coordinate system
 $(x_{1},x_{2},x_{3})$. For the rank (
 $1,1$) tensors that relate interfacial traction to surface traction and torque given in § 2.5 the tensors transform according to
 $$\begin{eqnarray}\unicode[STIX]{x1D6EC}_{j}^{i}=\frac{\unicode[STIX]{x2202}x^{i}}{\unicode[STIX]{x2202}\tilde{x^{m}}}\frac{\unicode[STIX]{x2202}\tilde{x}^{n}}{\unicode[STIX]{x2202}x^{j}}\tilde{\unicode[STIX]{x1D6EC}_{n}^{m}},\quad \unicode[STIX]{x0394}_{j}^{i}=\frac{\unicode[STIX]{x2202}x^{i}}{\unicode[STIX]{x2202}\tilde{x^{m}}}\frac{\unicode[STIX]{x2202}\tilde{x}^{n}}{\unicode[STIX]{x2202}x^{j}}\tilde{\unicode[STIX]{x0394}}_{n}^{m}.\end{eqnarray}$$
It should be noted that the unit cell geometry will also vary under this transformation, and it is not clear if this is the case physiologically, i.e. whether the spacing of the brushes varies as a function of endothelium curvature. For simplicity we will assume this to be the case here, but if it is found that the EGL spacing is maintained independent of endothelial topology, then it might be necessary to consider unit cell geometries which are a function of the local metric tensor.
Appendix C. Unit cell verification cases
In order to verify that the computational scheme is solving the expected equations, we seek solutions to the Stokes flow problems in a unit cell where no EGL is present. For such a geometry, we expect to obtain solutions for flow over an infinite wall subject to a unit traction forcing at a certain height (the top of the unit cell) and for the body forced case, subject to zero traction at a certain height with a unit body force. We consider each of these cases in turn.
C.1 Unit interfacial traction
In the case of flow over an infinite wall, we expect our velocities and pressure to only depend on the  $y^{3}$ coordinate as the problem is symmetric in the
 $y^{1}$ and
 $y^{2}$ directions. As such, the Stokes flow equations reduce to
 $$\begin{eqnarray}\frac{\unicode[STIX]{x2202}^{2}u^{1}}{\unicode[STIX]{x2202}y^{3}\unicode[STIX]{x2202}y^{3}}=0,\quad \frac{\unicode[STIX]{x2202}^{2}u^{2}}{\unicode[STIX]{x2202}y^{3}\unicode[STIX]{x2202}y^{3}}=0,\quad \frac{\unicode[STIX]{x2202}^{2}u^{3}}{\unicode[STIX]{x2202}y^{3}\unicode[STIX]{x2202}y^{3}}-\frac{\unicode[STIX]{x2202}p}{\unicode[STIX]{x2202}y^{3}}=0,\quad \frac{\unicode[STIX]{x2202}u^{3}}{\unicode[STIX]{x2202}y^{3}}=0.\end{eqnarray}$$
These equations are subject to no slip at the wall and a unit traction forcing in the  $y^{1}$ direction at the interface (which we take to be located at
 $y^{3}=h$, with
 $h=16$)
 $$\begin{eqnarray}\displaystyle u^{1}(y^{3}=0)=u^{2}(y^{3}=0)=u^{3}(y^{3}=0)=0, & & \displaystyle\end{eqnarray}$$
 $$\begin{eqnarray}\displaystyle \frac{\unicode[STIX]{x2202}u^{1}}{\unicode[STIX]{x2202}y^{3}}(y^{3}=h)=1,\quad \frac{\unicode[STIX]{x2202}u^{2}}{\unicode[STIX]{x2202}y^{3}}(y^{3}=h)=\frac{\unicode[STIX]{x2202}u^{3}}{\unicode[STIX]{x2202}y^{3}}(y^{3}=h)=0. & & \displaystyle\end{eqnarray}$$
This flow is solved by
 $$\begin{eqnarray}u^{1}=y^{3},\quad u^{2}=u^{3}=p=0.\end{eqnarray}$$
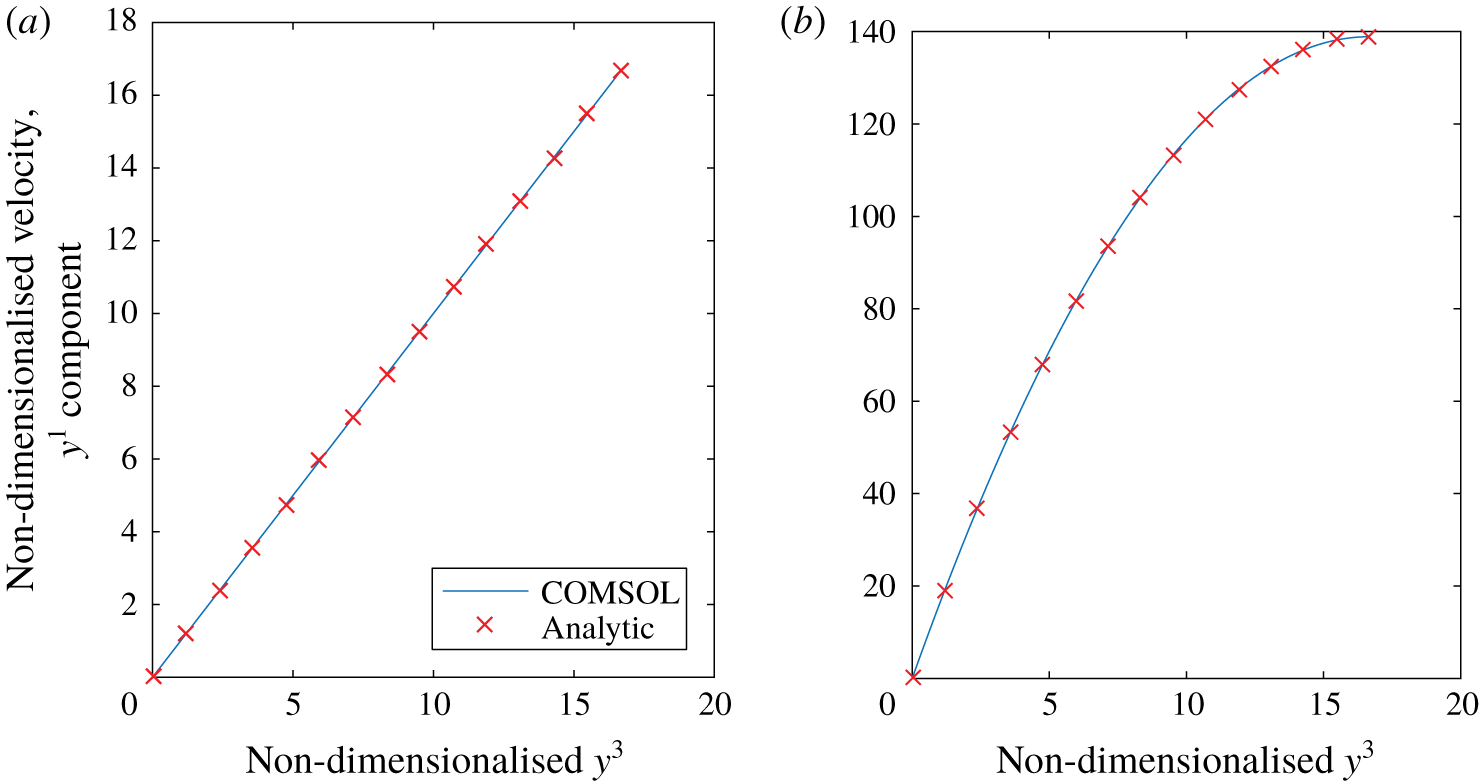
As seen in figure 12(a), the expected analytic result is recovered in the flow simulations.
Plots of the  $y^{1}$ component of velocity for a unit cell with no glycocalyx present subject to (a) unit traction forcing at the interface in the
 $y^{1}$ direction, (b) unit body force in the
 $y^{1}$ direction. Plots the numerically computed velocity profile (solid line) along with the analytic profiles (C 4) and (C 8) (crosses).

C.2 Unit body force
As before, we expect our velocities and pressure to only depend on the  $y^{3}$ coordinate as the problem is symmetric in the
 $y^{1}$ and
 $y^{2}$ directions. As such, the Stokes flow equations reduce to the same form as before except in this case, with a unit body force applied to the
 $y^{1}$ equation
 $$\begin{eqnarray}\frac{\unicode[STIX]{x2202}^{2}u^{1}}{\unicode[STIX]{x2202}y^{3}\unicode[STIX]{x2202}y^{3}}=-1,\quad \frac{\unicode[STIX]{x2202}^{2}u^{2}}{\unicode[STIX]{x2202}y^{3}\unicode[STIX]{x2202}y^{3}}=0,\quad \frac{\unicode[STIX]{x2202}^{2}u^{3}}{\unicode[STIX]{x2202}y^{3}\unicode[STIX]{x2202}y^{3}}-\frac{\unicode[STIX]{x2202}p}{\unicode[STIX]{x2202}y^{3}}=0,\quad \frac{\unicode[STIX]{x2202}u^{3}}{\unicode[STIX]{x2202}y^{3}}=0.\end{eqnarray}$$
 $$\begin{eqnarray}\displaystyle & \displaystyle u^{1}(y^{3}=0)=u^{2}(y^{3}=0)=u^{3}(y^{3}=0)=0, & \displaystyle\end{eqnarray}$$
 $$\begin{eqnarray}\displaystyle & \displaystyle \frac{\unicode[STIX]{x2202}u^{1}}{\unicode[STIX]{x2202}y^{3}}(z=h)=\frac{\unicode[STIX]{x2202}u^{2}}{\unicode[STIX]{x2202}y^{3}}(z=h)=\frac{\unicode[STIX]{x2202}u^{3}}{\unicode[STIX]{x2202}y^{3}}(y^{3}=h)=0. & \displaystyle\end{eqnarray}$$
This is solved by
 $$\begin{eqnarray}u^{1}=-{\textstyle \frac{1}{2}}(y^{3})^{2}+hy^{3},\quad u^{2}=u^{3}=p=0.\end{eqnarray}$$
As seen in figure 12(b), the expected analytic result is recovered in the flow simulations.
Appendix D. Brinkman flow in an asymptotically thin layer
In tensor form, the Brinkman equations can be expressed as
 $$\begin{eqnarray}-\unicode[STIX]{x1D628}^{ij}Q_{,j}+g^{jk}w^{i},_{jk}+Kw^{i}=0\quad w_{,i}^{i}=0.\end{eqnarray}$$
We can consider these flows in the asymptotically thin region considered in this study by rescaling  $x^{3}=\unicode[STIX]{x1D6FF}y^{3}$. If flow in the layer is driven by an
 $O(1)$ pressure gradient, this suggests a rescaling of flow velocity according to
 $(w^{1},w^{2})=\unicode[STIX]{x1D6FF}((v^{0})^{1},(v^{0})^{2})+\unicode[STIX]{x1D6FF}^{2}((v^{1})^{1},(v^{1})^{2})$ and
 $w^{3}=\unicode[STIX]{x1D6FF}^{2}(v^{0})^{3}$, and pressure
 $Q=Q^{(0)}+\unicode[STIX]{x1D6FF}Q^{(1)}+\cdots \,$. At
 $O(\unicode[STIX]{x1D6FF}^{-1})$ in (D 1a), and
 $O(\unicode[STIX]{x1D6FF})$ in (D 1b), we obtain
 $$\begin{eqnarray}\frac{\unicode[STIX]{x2202}^{2}(v^{(0)})^{1}}{\unicode[STIX]{x2202}x^{3}\unicode[STIX]{x2202}x^{3}}=\frac{\unicode[STIX]{x2202}^{2}(v^{(0)})^{2}}{\unicode[STIX]{x2202}x^{3}\unicode[STIX]{x2202}x^{3}}=\frac{\unicode[STIX]{x2202}Q^{(0)}}{\unicode[STIX]{x2202}x^{3}}=0,\quad \frac{\unicode[STIX]{x2202}(v^{(0)})^{i}}{\unicode[STIX]{x2202}x^{i}}+\unicode[STIX]{x1D6E4}_{i1}^{i}(v^{(0)})^{1}+\unicode[STIX]{x1D6E4}_{i2}^{i}(v^{(0)})^{2}=0.\end{eqnarray}$$
If we are required to match traction  $\boldsymbol{f}^{(0)}+\unicode[STIX]{x1D6FF}\boldsymbol{f}^{(1)}$ from the lumen (
 $x^{3}=1$) and no slip at
 $x^{3}=0$, this implies
 $$\begin{eqnarray}(v^{(0)})^{1}=(f^{(0)})^{1}x^{3},\quad (v^{(0)})^{2}=(f^{(0)})^{2}x^{3},\end{eqnarray}$$
 $$\begin{eqnarray}(v^{(0)})^{3}=-\left(\frac{\unicode[STIX]{x2202}(f^{(0)})^{1}}{\unicode[STIX]{x2202}x_{1}}+\frac{\unicode[STIX]{x2202}(f^{(0)})^{2}}{\unicode[STIX]{x2202}x_{2}}+\unicode[STIX]{x1D6E4}_{i1}^{i}(f^{(0)})^{1}+\unicode[STIX]{x1D6E4}_{i2}^{i}(f^{(0)})^{2}\right)\frac{(x^{3})^{2}}{2},\end{eqnarray}$$
using the fact that  $g^{33}=1$ and
 $g^{13}=g^{23}=0$. At
 $O(1)$ we find
 $$\begin{eqnarray}2g^{m3}\frac{\unicode[STIX]{x2202}^{2}(v^{(0)})^{l}}{\unicode[STIX]{x2202}x^{3}\unicode[STIX]{x2202}x^{m}}+\frac{\unicode[STIX]{x2202}^{2}(v^{(1)})^{l}}{\unicode[STIX]{x2202}x^{3}\unicode[STIX]{x2202}x^{3}}+2\unicode[STIX]{x1D6E4}_{3m}^{l}\frac{\unicode[STIX]{x2202}(u^{(0)})^{m}}{\unicode[STIX]{x2202}x^{3}}-g^{jk}\unicode[STIX]{x1D6E4}_{jk}^{3}\frac{\unicode[STIX]{x2202}(u^{(0)})^{l}}{\unicode[STIX]{x2202}x^{3}}-g^{lm}\frac{\unicode[STIX]{x2202}Q^{(0)}}{\unicode[STIX]{x2202}x^{m}}=0\end{eqnarray}$$
 $$\begin{eqnarray}\frac{\unicode[STIX]{x2202}Q^{(1)}}{\unicode[STIX]{x2202}x^{3}}=\frac{\unicode[STIX]{x2202}^{2}(u^{(0)})^{3}}{\unicode[STIX]{x2202}x^{3}\unicode[STIX]{x2202}x^{3}}+2g^{3k}\unicode[STIX]{x1D6E4}_{km}^{3}\frac{\unicode[STIX]{x2202}(u^{(0)})^{m}}{\unicode[STIX]{x2202}x^{3}}\end{eqnarray}$$
( $l,m=1,2$). And from the continuity condition at
 $O(\unicode[STIX]{x1D6FF}^{2})$
 $$\begin{eqnarray}\frac{\unicode[STIX]{x2202}(v^{(1)})^{i}}{\unicode[STIX]{x2202}x^{i}}+\unicode[STIX]{x1D6E4}_{i1}^{i}(v^{(1)})^{1}+\unicode[STIX]{x1D6E4}_{i2}^{i}(v^{(1)})^{2}+\unicode[STIX]{x1D6E4}_{i3}^{i}(v^{(0)})^{3}=0.\end{eqnarray}$$
Upon substitution of (D 3), solving subject to no slip at  $x^{3}=0$ and
 $O(\unicode[STIX]{x1D6FF})$ applied traction
 $\boldsymbol{f}^{(1)}$ at
 $x^{3}=1$, and then integrating between
 $x^{3}=0$ and 1
 $$\begin{eqnarray}(\overline{v^{(1)}})^{l}=-\frac{1}{3}\left(g^{lm}\frac{\unicode[STIX]{x2202}Q^{(0)}}{\unicode[STIX]{x2202}x^{m}}-2g^{m3}\frac{\unicode[STIX]{x2202}(f^{(0)})^{l}}{\unicode[STIX]{x2202}x^{m}}-2\unicode[STIX]{x1D6E4}_{3m}^{l}(f^{(0)})^{m}+g^{jk}\unicode[STIX]{x1D6E4}_{jk}^{3}(f^{(0)})^{l}\right)+\frac{1}{2}(f^{(1)})^{l},\end{eqnarray}$$
with  $(v^{(1)})^{3}$ then coming from (D 7). If the permeability were assumed to be
 $K=O(\unicode[STIX]{x1D6FF}^{-1})$, then this would become
 $$\begin{eqnarray}\displaystyle (\overline{v^{(1)}})^{l} & = & \displaystyle -\frac{1}{3}\left(g^{lm}\frac{\unicode[STIX]{x2202}Q^{(0)}}{\unicode[STIX]{x2202}x^{m}}-2g^{m3}\frac{\unicode[STIX]{x2202}(f^{(0)})^{l}}{\unicode[STIX]{x2202}x^{m}}-2\unicode[STIX]{x1D6E4}_{3m}^{l}(f^{(0)})^{m}+g^{jk}\unicode[STIX]{x1D6E4}_{jk}^{3}(f^{(0)})^{l}\right)\nonumber\\ \displaystyle & & \displaystyle +\,\frac{5}{24}K(f^{(0)})^{l}+\frac{1}{2}(f^{(1)})^{l}.\end{eqnarray}$$