1. INTRODUCTION
In design we sometimes speak of the “design space”: the range of all possible designs. To find a new design, we find a suitable point in the space. In parametric generative design the design space is fully described as an n-dimensional space (where n is the number of parameters). This space may be entirely viable or only partially viable (if some potential designs do not fulfill the requirements of the brief). In the second case, we need to be able to find the viable regions to produce new designs; this is particularly difficult if the viable areas are small compared to the design space. The viable regions may also be discontinuous, preventing easy navigation from one to another. This is the case in our chosen task of designing a chair.
Our proposed method of navigating the design space is to build a list of rules that describe an area of the design space that will produce a chair with a particular property. We call each list a “schema.” This is equivalent to the knowledge base a human designer would have for any design problem: his or her preconceptions. For our case study, chair design, we will look at properties such as comfort and stability to define these spaces. Crucially, we will define multiple schemata for each property, allowing the variety of possible designs to remain high. To create the schemata, we could manually draw on expert knowledge, but instead we find the solutions directly by testing chair models for their physical properties and using decision trees to learn the schemata. Using machine learning to constrain design parameters is not new; Dabbeeru and Mukerjee (Reference Dabbeeru and Mukerjee2011) in particular have explored similar methods. This work extends theirs with its ability to deal with complex design spaces and discontinuous viable regions.
Using predefined schemata is similar to designing based on preconceptions, often seen as negative, reducing the creativity of a designer's output. However, in reality it is an important part of design, where learning from experience allows a designer to quickly find a viable area of the design space in which he or she can explore new ideas. Other researchers have also studied the use of schemata in design, both as a functional part of the design process for human design teams (Lawson, Reference Lawson2004) and as a framework for an automated generative process (Janssen, Reference Janssen2006). They both acknowledge that schemata have a valuable role in enabling the design process, saving time and allowing easy communication of complex ideas.
As well as mapping the design space, our method also has a natural way of finding new designs. We do this by finding combinations of schemata that overlap in the design space. Any design in this area will possess all the properties described by the overlapping schemata. To find viable overlapping schemata, we include a method of removing any schema that does not overlap with those of other properties, and therefore will not be capable of producing new designs. The result of this work is a method of automatically describing the relationships between parameters in a manner that has a useful physical meaning. For example, we find a relationship between leg material and leg width that has an impact on the physical property of stability. By investigating the properties individually, we are able to use a much smaller data set than if we had just divided our whole data set into “good” and “bad” chairs, where the “good” chairs fulfilled all 17 criteria. In our data set of 12,000 random designs, none of them exhibited all 17 properties. This means that our data set does not contain any good chairs, but it does contain a significant number of chairs with desirable properties.
While this work concerns itself with the generation of chair designs from synthetic data sets, it is probable that a similar framework could be used as a generative algorithm for any multiobjective problem where a data set can be collected for each desired property, and each property can be classified into good or bad sets rather than requiring optimization.
We briefly describe the parametric ChairMaker that we use to create the chair designs. The 33 parameters it uses are the 33 dimensions of our design space. A more in-depth description of the development of the ChairMaker, along with a full list of the parameters used is given in Reed and Gillies (Reference Reed and Gillies2016a ). In this section, we will also describe the properties we require our chair to possess and the way in which we have collected data on each property. In particular, we will discuss a new ergonomic simulator that is able to automatically test chair designs quickly, enabling the collection of a large amount of data. Further detail can also be found in Reed and Gillies (Reference Reed and Gillies2016b ).
The main focus of the paper is the extraction of the schemata from the data using decision trees. We also describe the process of combining schemata and show chair designs resulting from this process.
2. PREVIOUS WORK ON GENERATING AND EVALUATING DESIGNS
Our previous work has included developing a method of designing chairs. This work has consisted of two main parts. The first is a parametric chair generator that is able to create a wide variety chairs from an input of 33 values. The parametric structure gives us a meaningful way of comparing chairs of very different styles because we can consider the differences in the input values. The second part was the development of an ergonomic simulation program that could test a variety of ergonomic properties directly from the input values. The benefit of this program over existing ergonomic simulators is that it is much faster and entirely automatic, allowing us to test thousands of chairs (both good and bad) in a comparatively short space of time, thus building large data sets. The output of the system is a score for a variety of properties such as seat comfort and sitting position. The property scores for the ergonomics (and other measures detailed in this section) are used to define classes for the chairs. For each property (e.g., seat comfort) a chair is classified as either possessing this property or not. It is these property classes that we will use in the next section.
2.1. ChairMaker
The parametric chair generator was built in SketchUp (Trimble, 2015). A chair is constructed by positioning a number of cross sections. These are then joined together and finished with a texture. Some of the parameters control the proportions such as heights and widths (by changing the size and position of the cross sections); these are continuous. Others select the cross sections and textures from predefined sets; these are discrete. There are 33 parameters that are used in the generation of a chair.
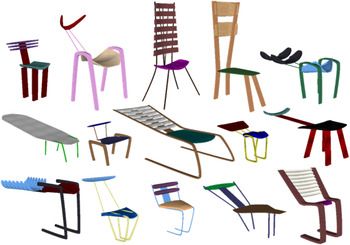
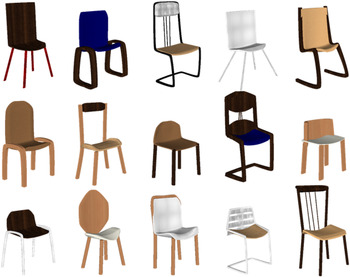
The parametric structure gives us a wide design space containing both good and bad designs. New chairs can be produced by randomly selecting parameter values. Examples of the output are given in Figure 1.
Random chairs produced by the ChairMaker program.

2.2. Ergonomic measures
Because the primary function of a chair is to allow users to sit comfortably in a position that enables them to carry out their desired function, our first design problem is ergonomic. We require a large quantity of samples (both good and bad) to learn the function space. To gather this data, we use an ergonomic simulation of a user. Analyzing real chairs would have taken much longer and would have only given us examples of viable chairs. There are existing ergonomic models available, but they did not suit our purpose because we need to collect large amounts of general data automatically from randomly generated designs and the existing models are designed to collect very precise data from a small number of designs.
We test each chair with a set of users with a range of different body sizes. These simplified human body models were built using proportion data from DINED (TU Delft, 2015), an anthropometric database, and body mass data from “Biomechanics and Motor Control of Human Movement” (Winter, Reference Winter2009).
A simplified chair model that uses 25 of the 33 parameters is built, and the simulation positions the user in the chair. The user sits at the back of the chair (not perching on the front). The legs are positioned so that the height of the center of mass of the leg is minimized. A range of possible positions is found, ensuring that those with the legs passing through the chair or floor are excluded. The center of mass is found for the whole leg in each possible position, and the minimum is chosen.
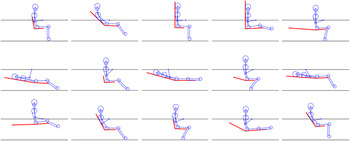
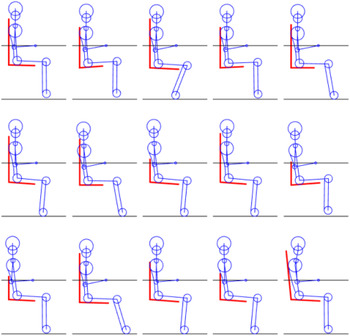
The back and neck are placed to minimize the effort required to stay in that position. Effort is increased if a joint moves from the vertical without support from the chair back. To make the posture more realistic, we also model a muscle along the back; this muscle is relaxed in a slouched position, and effort is increased proportionally when the user leans further forward or sits vertically. If the chair provides little support, this results in the user sitting up, slouching slightly. If the chair offers support for the shoulders, then the user leans back into the seat but keeps the head vertical. If the slope of the chair back is too great to offer support for the head, the user resumes the slouched position. Finally, if the chair offers enough support for the head, the user sits against the back at any angle. We show a range of positions that the user will take in Figure 2, in which the user is seated on the randomly generated chairs shown in Figure 1.
Simulations of a model sitting on the chairs from Figure 1. The model takes the most appropriate position for each chair, only using the back if it offers enough support for the body and head.

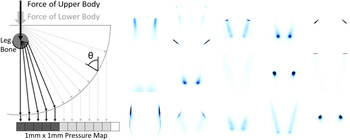
Once the user is seated, we can estimate the peak pressure on the seat and back of the chair by finding the angles between the chair surface and a simplified body form. The pressure in each 1 mm square is then found using f 0cos2(θ) (SOLIDWORKS, 2015), where θ is the contact angle shown in Figure 3 and f 0 is the force normalized so that the sum of the squares add to the full force of the user's body. If the feet are resting on the floor, then the mass of the lower legs is not used; likewise, if the user is leaning against the back, some of the torso and head weight is applied to the back instead of the seat. The highest value of the 1 mm square pressure points is taken as the peak pressure.
Assessing performance of chair designs in the ergonomic simulator. (Left) Cross-section of a leg showing how the force from the upper and lower body is distributed onto the pressure map using a skeleton layer. (Right) Resulting pressure maps from the simulations of chairs in Figure 2. Black indicates areas of very high pressure that would cause pain for the user.

To create the higher pressures under the hips, as seen in real pressure maps (SCI Forum Report, 2004), we add a skeleton layer, transferring the weight of the upper body from the spherical hip bone and cylindrical leg bone to the leg surface before finding the pressure between the leg and seat. This is illustrated in Figure 3, which shows a cross section of the leg and the direction of the forces.
Our method is much simpler than the usual method of finite element analysis (an early example being Todd and Thacker, Reference Todd and Thacker1994, with a good overview in Zhu, Reference Zhu2013), but it gives a good approximation of the range and distribution of pressure found experimentally. It is less detailed than those found by finite element analysis but much faster and therefore ideal for our purpose. The detail in other simulations is required to predict the development of pressure sores in long-term use (such as in a wheelchair), but this is not part of our brief.
Example pressure maps are also shown in Figure 3; again, these are for the chairs shown in Figure 1. Those on flat or gently curved seats show a similar map to those in the literature with a peak under the hip bones. However, those on tightly curved seats show very high peaks in unusual places, and this indicates the seat causing pain. Some show very low pressure, and this is because the user is reclining and the mass of the torso is being supported by the seat back.
We collect a variety of information from these models to produce our data sets. As well as the comfort (given by the peak pressure and curvature of the spine), we also gather data about the suitability of the chair for carrying out seated tasks. For this work, we will choose a dining chair as our brief, and therefore, the users need to be seated vertically with their eyes forward, feet on the floor, and arms resting comfortably by their side onto a table at 90°.
2.3. Other data sets
2.3.1. Efficiency
When designing a chair, we want to ensure that it fulfills its brief in an efficient manner. For example, a dining chair needs to be suitably narrow to allow several of them to fit side by side around a table. We therefore collect three measures to test the efficiency of the design. These are width, length (including the length of the seated user in case the seated position has the legs stretched out too far), and excess recline. The excess recline measures the angle between the spine and the back of the chair. This prevents an unused back as seen in some of the examples in Figure 2.
2.3.2. Leg measures
We introduce three property measures for the legs. These look at the strength, connectivity, and stability of the legs. To test the strength of the legs, we use a very simple measure that looks at the cross section of the legs against the surface finish. The wooden finishes were required to have a higher total leg cross-sectional area than the metal finishes. Upholstered finishes for the legs were not considered sufficiently strong for any cross-sectional area.
The connectivity property looks at how well the legs connect to the seat. Curves representing the tops of the legs and the side of the seat were created, and the percentage of the leg top that overlapped with the seat was found. Those with an overlap of less than 70% were considered to be bad. Finally, the stability property ensures that the chair base covers a sufficient area to prevent the chair overbalancing.
2.3.3. Manufacture
We used three measures that aimed to make the chair more realistic with respect to manufacture. The choice of materials has an impact on what forms can be made and what manufacturing techniques can be used. Our first two manufacture measures looked at the complexity of the seat and back forms by considering the surface curvature of each. These two measures were also multiplied by a material factor. The material factor had a high value for difficult to shape materials such as wood and a low value for easy materials such as plastic. This removes complex forms in wood but allows them in plastic.
The third manufacture measure looks at the difficulty of assembling the chair back. The back can be made of a number of pieces, and these can be easy to assemble (wood or metal) or difficult (plastic). As well as the number of pieces, we consider the way they attach to the verticals. Thin verticals or a single central vertical are considered difficult, while multiple wide verticals are considered easy to assemble.
2.3.4. Aesthetics
When using only the objective data sets (comfort, practicality, stability, efficiency, and manufacture), we received feedback from others that the chairs looked strange and unusual. To overcome this, two further data sets were used to determine color and proportion. We acknowledge that this data is not ideal, because it will remove many aesthetically good designs from the potential design space and some bad designs may remain. However, the addition of these makes the chairs produced more familiar and easier to relate to. If better data sets become available, these can be substituted easily using the schema method.
Proportions. Defining good proportions is a difficult task because it is subjective. Rules have been proposed such as the use of ratios φ (the golden ratio, 1.6180 …) or 1:2 (used by Birkhoff in his aesthetic measures; Birkhoff, Reference Birkhoff1933), but their importance is disputed. It was decided that we would focus on removing observed proportional traits that were considered undesirable, but we would not try to classify the chairs beyond this to prevent reducing the diversity too far. With the help of a professional designer (an architect), some undesirable traits were identified.
One measure was found that was able to remove the majority of the negative proportion traits. This measure looked at the percentage of the possible area that was covered by the seat, back, and legs. We find the possible areas by finding the maximum width of the chair and the height of the back and legs and length of the seat. We then want the seat, back, and legs to fill a certain percentage of this area; we required 70% filled in this test.
Color. As with proportions, it is possible to find color theory rules that claim to dictate colors that work together. However, we were unable to apply these to our work because we had a finite set of materials, and it was found that we could not find groups of these materials that fitted the rules.
It was decided that the best way to apply rules to the color was to source good color palettes that had been approved by a human eye. There are online repositories of these palettes, but as with the color rules, these are not suitable for picking textures from a predefined set. For this we needed a wide range of colors to compare against those in our textures. Therefore, we opted to make our own palettes based on colors that appear in suitable photographs. Two photographs were used in this paper to demonstrate the method, but many others could be added to increase the possible combinations of colors in the chairs.
2.4. Evolutionary generation
An early version of the ChairMaker and the ergonomic measures have previously been used to generate new designs using an evolutionary algorithm (Reed & Gillies, Reference Reed, Gillies, Johnson, Carballal and Correia2015). A fitness function was learned from a test set of data using the ergonomic measures only, and this was used to evolve a diverse set of viable designs. The method was reliable with regular convergence to the top fitness in a few seconds of run time. The successful use of an established generation method helps validate our chosen measures, and we now explore a more robust algorithm to produce our designs.
However, increasing the complexity of the problem with new parameters used in the ChairMaker and additional measures (stability and manufacture; aesthetics was not used) created problems with the evolutionary algorithm. Increasing the number of properties significantly reduced the diversity of the evolved chairs with all the offspring appearing near identical. The algorithm also failed to converge regularly when using over 11 parameters.
3. GENERATION OF NEW DESIGNS USING SCHEMA DRIVEN DESIGN
The machine learning method used in this work, as well as in the earlier evolutionary algorithms, is decision trees. These were used because they have dimensionality reduction built into the algorithm and they are able to handle the discrete parameters used in the ChairMaker. However, for this work we use another property of decision trees; they are a “white box” algorithm. That is, we can see the decisions that lead to a data point being classified. Decision trees therefore can be used to map the design space, with each region defined by the decisions that lead to that node.
Finding the regions of good chairs is required of all generative algorithms. The most basic algorithm, generate and test, finds a chair by randomizing the parameters and then tests it to see if it possesses the desired properties. If the design space is large and the good regions are small, then this is not viable. Our random set of 12,000 chairs tested using our ergonomic simulator contained no good chairs with all 17 desired properties. In other words, sampling the design space 12,000 times did not locate a single good region.
More sophisticated algorithms, such as the evolutionary algorithms, actively search for the good regions. However, as we have fully mapped the space using decision trees, searching is redundant because the decision tree can tell us where the good regions are directly. The schema algorithm works by finding the constraints that define good regions for each property and then locating regions that are good for all 17 properties.
The constraints defining each good region are extracted directly from the decision trees. These can be seen as sets of rules that describe a method for creating a chair with a particular property. For example, we could restrict our leg material parameter to “wood” and the leg width parameter to be “wide”; applying these rules gives our chair the property of “sturdy legs.” We call such a set of rules a “schema” because it provides a plan for our designs.
One strength of this method is that the rules are generated automatically from a data set and therefore do not rely on expert knowledge. We also have multiple schemata for each property; for example, in addition to wide wooden legs, we can also achieve the property “sturdy legs” with narrow metal legs. Having multiple schemata for each property keeps the design space diverse and interesting. Multiple schemata from different properties can be combined so that we are able to design chairs that possess all of the properties that we require.
In this section, we will use Property 9 as an example. This is the property that ensures good posture in our seated figures. We use this as an example because it was found that it only relies on two parameters (back height and back recline), allowing us to illustrate the design space in two dimensions.
3.1. Finding a decision tree
Test data was generated using all of the measures described in the previous section. Randomly generated chairs were tested with the simulator and categorized into good or bad classes for each property based on the simulation results. The classes were chosen to correspond to our brief of a dining chair (e.g., ensuring the user was sitting up at an appropriate height to use a table or desk), making sure that both good and bad classes represented a significant proportion of the training set to enable training of the decision trees. We classify each property separately. This means that a chair could be classified good for seat pressure but bad for posture. Studying each property separately allows us to find the parameters that affect that property directly. It would have been impossible to train a tree to find chairs with all 17 good properties with this data set because none of the chairs were classified as good for all 17 properties.
Individual trees were trained for each property, using the ChairMaker parameters as the input variables and the classes from the simulations as the labels. We use MATLAB to find the decision trees because MATLAB allows the extraction of information about the decision rules that are needed in the production of the schemata. We use MATLAB version R2014b and the function fitctree (Mathworks, 2014).
Overfitting is always a problem in machine learning, but it is of particular concern for our method because superfluous parameters in our schemata could cause problems later when we combine schemata in the generative phase. The problems would arise by creating apparent conflicts between schemata where there are none. To prevent overfitting, we use a property of decision trees that gives the relative importance of the predictor variables; in MATLAB we find this using the function predictorImportance(tree). This importance finds the sum of the change in risk for each variable and divides by the number of nodes.
For each property, we randomly sample one-third of the data, train a tree, and find the importance values (rescaled so the maximum value is 1). We do this 20 times, finding the minimum importance value of the 20 tests for each parameter. Only those parameters with a minimum importance value over 0.005 are then used to create the tree from which we will extract the schemata. We assume a “real” important parameter will have a significant importance value for any subset of the data but an over fitted parameter will have a near zero importance for some subsets of the data.
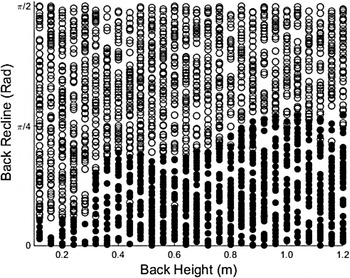
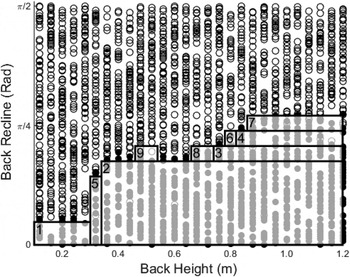
For our example of Property 9, we find that only the parameters back height and back recline (parameter numbers 3 and 4) have an importance above the threshold; therefore, the final tree is trained with only these parameters as input variables. In Figure 4 we see the design space of Property 9. Each point is one of the chairs in our data set, and the unfilled points are the chairs classified as bad while the good chairs are shown filled. A tree trained on this set is shown in Figure 5.
Example design space for Property 9 (back curvature). Each point is a chair from the test set with the corresponding values for back recline and back height. Those that satisfy the property (have a comfortable back curvature) are shown filled. Those that are considered uncomfortable are shown unfilled.

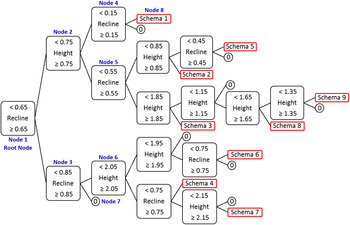
The tree trained using the data in Figure 4. Each node shows the decision at that node, or if the node is a terminal node, a labeled schemata for positive nodes and a “0” for negative nodes. The numbered nodes represent the numbering system used in MATLAB and correspond to the node data in Table 1.

Example of data extracted from an actual decision tree trained in MATLAB on data for Property 9

Note: The properties in the first row (tree.Parent, etc.) are the properties of the MATLAB ClassificationTree object that are extracted. The node numbers system is illustrated in Figure 5.
3.2. Schemata derivation
To derive the schemata from the trees, we much first find the full range of each parameter, and this is then turned into a vector of possible values for that parameter. To do this we round our continuous variables into a discrete list; however, we will continue to refer to them as continuous because they will still behave as such; for example, 0.4 is more similar to 0.5 than to 0.8 but (as an example of a discrete measure) cross section 4 is not necessarily more or less similar to cross section 5 than to cross section 8. We find a range vector for each parameter; for example, we have 33 vectors in total. As an example, the vector for Parameter 3 is the numbers 0.0 to 1.6 in increments of 0.1 and the vector for Parameter 4 is the numbers 0.3 to 3.0 in increments of 0.1.
To turn our parameter vector sets into schemata, we extract information from the trained tree in MATLAB. Table 1 shows the properties extracted from the tree and some of the data for Property 9 in the format it is given. To demonstrate the method, we will extract a schema from Property 9 using the data in Table 1. The method can also be followed using the tree in Figure 5. The method proceeds as follows:
-
• We first find a terminal node; in the extracted data this is indicated by the letters “NaN” for the property “CutPoint.” Our example data has two terminal nodes: numbers 7 and 8.
-
• We then identify a positive terminal node. Node 7 has a probability of 0.9987 that it is negative. Node 8, however, has a probability of 1 that it is positive. We choose this as our first schema. In Figure 5 Node 8 is labeled “Schema 1.”
-
• The parent of our terminal node is identified from the value given by parent node. We see in Table 1 that the parent of Node 8 is Node 4. This can also be seen in Figure 5.
-
• From the parent node, we find the decision parameter and value. For Node 4 this is Parameter 3 (back recline) and value 0.15. We also identify whether the decision is greater or less than the value by observing if our terminal node is the first or second child node listed for the parent. The first child node is “less than,” the second is “greater than or equal to.” In our example, we find that we have “less than.”
-
• Putting together the information from the parent node, we find that to reach Node 8, a point must have a value of Parameter 3 that is less than 0.15. We therefore constrain Parameter 3 to satisfy this by removing all values greater than 0.15 from the range vector. The range vector is now [0.0, 0.1].
-
• The process is now repeated by treating Node 4 as our terminal node. We find that its parent is Node 2, and we must satisfy Parameter 4 less than 0.75. This reduces the vector to [0.3, 0.4, 0.5, 0.6, 0.7].
-
• The process is now repeated by treating Node 2 as our terminal node. We find that its parent is Node 1, and we must satisfy Parameter 4 less than 0.65. This reduces the vector to [0.3, 0.4, 0.5, 0.6].
-
• The process then stops as Node 1 is the root node.
-
• Schema 1 has been defined as constraining Parameters 3 and 4 to values in [0.0, 0.1] and [0.3, 0.4, 0.5 0.6], respectively. All other parameters are unconstrained.
-
• As we see in Figure 5 there are nine positive nodes, each producing a unique schema. The remaining extracted data is not shown here.
Each of the schema represents a distinct region of the design space. The nine schema shown in the tree in Figure 5 can be seen as regions in Figure 6.
Numbered schemata in the Property 9 design space with the numbers corresponding to the schemata in Figure 5. Each schemata is produced by < or ≥ constraints for each parameter, creating the rectangles.

3.3. Parameters to consider in schemata derivation
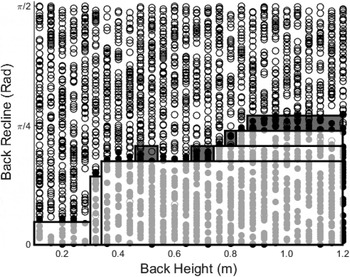
Unlike traditional classification, where it is important to have high accuracy for both good and bad classes, here we are only interested in the good class. If a good design is misclassified as bad, then our design space will be reduced slightly but we still have a large space from which to find our designs. However, if a bad design is misclassified as good, then we run the risk of producing nonviable chairs. To ensure a low percentage of nonviable chairs, we can remove positive nodes that have a high level of uncertainty, measured using the Class Probability property from our Matlab trained tree (example values can be seen in Table 1). This is an estimate that a point assigned to that node has the node class.
We choose 0.85 as our bias level, with only those nodes with 0.85 probability of being positive used as positive leaves. For our example, we find that only the first nine schemata fit this criteria. The other schemata are capable of producing good designs, but the likelihood that they would produce a nonviable chair is too high. The removed schemata are shown in Figure 7 shaded in gray.
Schemata with a high possibility of producing nonviable chairs are removed (in gray).

3.4. Incompatible schema
For each desired property, we now have a set of schemata that is equivalent to a set of different solutions to the same design problem. To produce a new design, we must solve all our design problems by picking one solution from each property, finding the intersection of the permitted parameters, and creating a chair based on that specification.
Before we choose our schemata, we remove those that are completely incompatible to reduce the possibility of a schema combination where the intersection of one or more parameters is empty. For example, any schema that has a reclined back will be incompatible because several properties of the dining chair require the user to be sat up straight. It is important to note that we only want to remove a schema that conflicts with all the schemata of an entire property and therefore has no possible combinations that would produce a viable chair. Any schema that has at least one compatible match in every property's schema set will be kept.
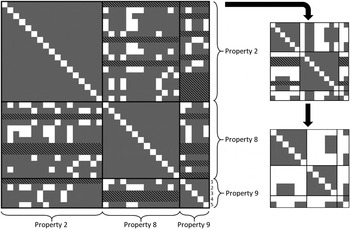
Figure 8 shows the process in which the incompatible schemata are removed. We demonstrate this with Properties 2, 8 and 9 because these are the properties that conflict with our example Property 9. Each row and column is equivalent to one of the schemata. If a schema is compatible with another, the cell is white; if it is incompatible, then it is shown in gray. A full row of gray (highlighted with diagonal lines) indicates that the schema for that row is incompatible with any of those for the property.
Illustration of the removal of schemata that are incompatible with those from other properties. Each row and column correspond to a single schema with each square representing the compatibility of the respective row schema and the column schema. A gray square indicates incompatible schemata, that is, chairs could not be produced from this pair of schemata because the intersection of one or parameters would be empty. The rows highlighted with diagonal lines show schemata that are incompatible with entire properties.

We see that Property 9 has five rows and columns, representing the five schema that fulfilled our accuracy requirement. However Schema 1 is incompatible with all the schemata for Property 2. That is, the region described by Schema 1 does not overlap with any of those described by the schemata for Property 2. Likewise Schemata 3 and 4 are incompatible with Property 8. Schemata from Properties 2 and 8 are also found to be incompatible. Schemata 1, 3, and 4 are removed from the set, along with the other highlighted schemata.
The process is then repeated as we find some of the schemata from Property 8 are incompatible with the remaining schemata from Property 9. The process is repeated until no new incompatible schemata are found. Here we are left with six schemata for Property 2, five for Property 8, and two for our example Property 9. These two are Schemata 2 and 5 from our original tree.
In practice, we compare all 17 properties together. Once the removal process is finished, we are left with 118 schemata representing the 17 properties for which there is at least one valid combination for every schema. Using different properties will result in different schemata remaining.
3.5. Schema fusion
To create a new chair, we must chose a single schema for each property. Each schema defines a region of the design space that satisfies the property it represents. If we can find a point that is in one schema for every property, it will satisfy all the desired properties.
To find a new chair, we choose one schema at random, and this can be from any property. We then find all the schemata compatible with it. This will not include any others from the same property because regions defined by the same tree never overlap. A second random schema is chosen from this set. The parameter intersection of the two schemata is found, and this is our fused schema. The fused schema describes an area that possesses the properties of both schemata. Once again the compatible schema are identified.
The process then repeats; a new random schema is chosen and the intersection between it and the fused schema is found. The process continues until no compatible schemata remain. This is because either all 17 properties are represented in the fused schema or the fused schema becomes incompatible with all others. A new chair can be produced if the fused schema represents all 17 properties.
In a typical run of 1000, we get a successful fused schema for around 120–150. The process for this number of trials takes roughly 1 s in the MATLAB program. Therefore, over 100 chairs per second can be made with the schema method.
A chair is made from the fused schema by selecting a single parameter value from each constrained vector. Because the vector will often contain multiple values, we can make several chairs from each fused schema.
4. RESULTS
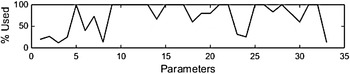
We can see some of the designs created by the schema method in Figure 9. There is a wide range of shapes and styles, including both traditional and modern. This range can also be seen in the diversity plot in Figure 10. This shows the proportion of the parameter range from the random test set that is still present in a generated set of 500 chairs. Most parameters show a high diversity, indicating that a significant amount of the original range is still present. Of those that show a significantly reduced diversity, the first four parameters correspond to seat height, seat length, back recline, and back height, and are therefore strongly restrained by the practicality design brief. Parameters 6 and 8 are seat and corner width, respectively, and are likely constrained by the comfort and proportion requirements. Finally, Parameters 23, 24, and 33 choose the textures, and these only contain values from the chosen palette.
Chairs produced with the schema method.

Remaining diversity in the 33 generating parameters displayed in a set of 500 schema-generated chairs. Parameters with 100% use the same range of the parameter as those in the randomly generated test set.

In Figures 11 and 12 we show the posture diagrams and pressure maps for the chairs shown in Figure 9 produced by the ergonomic simulation. We see that all the figures are sat upright with their feet resting on the floor and hands easily reaching desk height. The pressure maps show even distributions for all the seats and that none of the seats possess the high painful pressures, which would be shown in black.

Pressure maps for the chairs in Figure 9. Many have higher overall pressures than those seen in Figure 3 because all of the weight is now supported by the seat rather than the back. However, here the pressure is better distributed and we see no black areas indicating very high painful pressures.

4.1. Adding and removing data sets
The data sets that can be used with this method are not fixed. New trees can be trained on additional data and schemata extracted in the same way. Once new schemata have been found, we can repeat the conflicted schema deletion process and we are left with those that pass our new design brief. Likewise, we can remove the set of schemata for a particular trait if it is no longer required, or swap a schema set for a new one if better data becomes available (e.g., if it were possible to collect ergonomic data on a large set of real chairs). If we decide that some of the traits are not required, we can remove them. For example, if we decide that our aesthetic assumptions are too restrictive, we can remove them and use only the physical property schemata to generate chairs like those shown in Figure 13.
Chairs produced with the schema method without the aesthetic schemata.

4.2. Chair sets
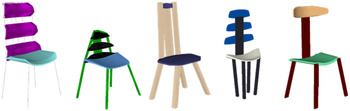
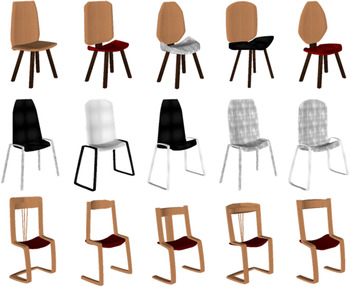
The range of chairs produced by this method shown so far have been generated by a different fused schema for each chair. However, because the fused schema will still contain a range of values for some parameters, it is possible to create a range of chairs from a single schema set. Figure 14 shows three sets of chairs, each made with a single fused schema with different parameter values randomly chosen from the remaining range. The sets of chairs produced all appear to be visually similar and belong to the same “family” of designs. This suggests that shared schema choices could create a shared visual reference or style.
Sets of chairs made from three final fused schemata but choosing different parameters from the constrained range.

5. CONCLUSION AND FUTURE WORK
We have shown that it is possible to use existing knowledge in the automatic generation of new designs through the use of schemata. We have also shown that it is possible to find these schemata automatically through the use of decision trees and data sets measuring various properties of our desired design brief. We have presented a method of filtering and combining these schemata to isolate regions of the design space in which we can then create viable chair designs.
There are several directions in which this work could proceed. One question is the effect of taking risks with the schemata. In this work we used a heavy bias to ensure no risks were taken with the choice of schemata; schemata that were known to be uncertain were removed. However, risks in designs can lead to interesting innovations, and removing this potential could be undesirable. Allowing the designs to include risky schemata could lead to more novel designs but this will have to be combined with other assessment methods such as direct testing or manual assessment to remove the nonviable designs produced.
Another area of interest is the effect of the schema choice on styles. Styles though history have arisen when groups of designers have made the same design decisions, such as choice of material or type of decoration, and we have seen that our schemata can create similar families such as those in Figure 14. The ChairMaker was built to enable chairs of different styles to be created from the same set of parameters, and we have seen that the method described in this paper can generate viable chairs of different styles such as traditional or modern. Currently the schemata are combined randomly, but there is scope to investigate to what extent the choice of schemata (and therefore parameters) affect the style.
Kate Reed obtained her PhD from the Department of Computing at Imperial College London. She earned her research master's degree in natural computation at the University of Birmingham, specializing in evolutionary algorithms for design. She also received an undergraduate master's in mathematics with astronomy from the University of Leicester in 2011.
Duncan Gillies is a Professor of biomedical data analysis in the Department of Computing at Imperial College. He graduated from the University of Cambridge with a degree in engineering science. He worked for 3 years as a Control Engineer in industry, before returning to full time study and obtaining a PhD in the area of artificial intelligence from Queen Mary College. After teaching for 6 years at London South Bank University, he moved to the Department of Computing at Imperial College. He has worked in the areas of computer graphics and vision and their applications in the medical field and in probabilistic inference methods, particularly Bayesian networks and classifiers.