Implications
Mathematical models that describe milk yield in time can be very useful in genetic breeding programs, herd nutritional management, decision making on the culling animals and milk production systems. The lactation curve is important because its wide characterization of the animal production throughout lactation allows estimating the peak yield, days in milk and lactation persistency. Accurate knowledge of lactation curves has a significant relevance to management and study of dairy production systems. Mathematical modeling of lactation curve by appropriate functions widely applied in dairy cattle. These equations can represent also for buffaloes a fundamental tool for management and breeding decision making.
Introduction
There are about 480 000 water buffaloes, mostly present in south and northwest Iran. All of the Iranian buffaloes are riverine (Ghavi Hossein-Zadeh, Reference Ghavi Hossein-Zadeh2014b). Some archeological evidence suggests that water buffaloes have been tamed in Iran and migrated to southern Europe through this region. The ancestry of Iranian buffaloes is not clearly known, but it has been suggested that the main forerunner of these animals are Indian buffaloes such as Murrah due to their phenotypic similarity (Ghavi Hossein-Zadeh et al., Reference Ghavi Hossein-Zadeh, Madad, Shadparvar and Kianzad2012).
The term lactation curve refers to a graphic representation of the association between milk production and lactation time starting at calving (Papajcsik and Bodero, Reference Papajcsik and Bodero1988). The mathematical description of the temporal evolution of milk production in ruminant species reared for milk production represents one of the most important applications of mathematical models in animal science (Pulina and Nudda, Reference Pulina and Nudda2001). Several reasons can be found for the need of a mathematical modeling of the lactation pattern. Mathematical models of the lactation curve and, in general, of the mammary gland represent a valuable tool for basic research studies aimed at increasing the scientific knowledge of complex physiological mechanisms that underlie the milk secretion process (Dimauro et al., Reference Dimauro, Catillo, Bacciu and Macciotta2005). Lactation curves may be applied by physiologists, nutritionists and other researchers to mimic the lactation process and to study the relationships existing between secretory cells, hormones, energy supply and environmental effects affecting the milk production process (Steri et al., Reference Steri, Dimauro, Canavesi, Nicolazzi and Macciotta2012). On a dairy farm scale, the pattern of milk yield (MY) across the year depicts the trend of the main farm income. Moreover, it is strongly associated with evolution of the nutritive requirements of the animals and, consequently with feeding costs, that represent one of the most important expenses in dairy farming. Thus, a mathematical function able to accurately describe the pattern of MY during the year and to predict future production supplies useful information to help the farmer and the agricultural extension workers in several management decisions. Such information is of great importance in the programs of genetic improvement, herd management, feeding, health monitoring and profits evaluation, besides the construction and validation of bio-economic models and software for livestock species (Ghavi Hossein-Zadeh, Reference Ghavi Hossein-Zadeh2014a).
According to the theoretical approach used to describe the main components of the lactation pattern, mathematical models suggested for studying the lactation curve can be divided into two main classes: empirical models and mechanistic models. The aim of empirical mathematical models is to provide a basis for identifying the difference between regular component and stochastic one. In addition, interpretation of the parameters of the function used and identification of the mechanisms which control the process are important in empirical models (Steri et al., Reference Steri, Dimauro, Canavesi, Nicolazzi and Macciotta2012). These empirical models have large application in different fields of animal science, basically due to their limited mathematical complexity. Mechanistic models are essentially aimed at translating in mathematical terms a hypothesis about biological and biochemical processes that regulate the phenomenon of interest. Such an approach, even if of great interest for research and also for practical implementations, has been little developed in animal sciences. This was due to the high theoretical complexity of mechanistic models, to the large number of input variables involved and to the high computation requirements (Macciotta et al., Reference Macciotta, Miglior, Cappio-Borlino and Schaeffer2008).
Mathematical modeling of lactation curve by appropriate functions of time widely applied in the dairy cattle industry (Silvestre et al., Reference Silvestre, Martins, Santos, Ginja and Colaco2009; Gołębiewski et al., Reference Gołębiewski, Brzozowski and Gołębiewski2011; Ghavi Hossein-Zadeh, Reference Ghavi Hossein-Zadeh2014a), and there are various mathematical equations describing lactation curves in dairy cows, from the more empirical equations that relate input to output statistically with little consideration of the biology of lactation (e.g. Wood, Reference Wood1967; Rook et al., Reference Rook, France and Dhanoa1993), to the more mechanistic ones that describe the lactation curve based on the biology of lactation (e.g. Dijkstra et al., Reference Dijkstra, France, Dhanoa, Maas, Hanigan, Rook and Beever1997). These equations can represent also for buffaloes a fundamental tool for management and breeding decision. However, information on the shape of lactation curves and its description by the most appropriate mathematical model in dairy buffaloes is very limited. Therefore, the aim of this study was to evaluate the main features of lactation curves for MY and its components (milk fat percentage and milk protein percentage) for the first three lactations of buffaloes. For this purpose, seven routine mathematical models (Wood, Dhanoa, Sikka, Nelder, Brody, Dijkstra and Rook) were examined to evaluate their efficiency in describing the lactations of buffaloes. Therefore, seven non-linear equations with various complexities were evaluated and compared using lactation data collected from buffalo herds. Comparison of the predictive ability of these models permits identification of a mathematical function capable of characterizing and providing a better perspective on the lactation curve shape of the dairy buffaloes. When an appropriate lactation curve model is determined, selection emphasis can then be focused exclusively on the level of the lactation curve.
Material and methods
Data
Data set were 116 117 test-day records for MY, fat (FP) and protein (PP) percentages of milk, from the first three lactations of buffaloes. Number of animals in the first three parities was 4990, 4360 and 4024, respectively. Data were recorded on 893 dairy herds in the period from 1992 to 2012 by the Animal Breeding Center of Iran. Outliers and out of range productive records were deleted from the analyses. Records from days in milk (DIM) <5 and >305 days were eliminated. Records were also eliminated if no registration number was present for a given buffalo. Analyses were applied to only the first three parities and, therefore, data from later parities were also discarded. First-parity buffaloes represented 37.1%, whereas second and third parities accounted for 33.6% and 29.3% of the total test-day records, respectively.
Lactation curve models
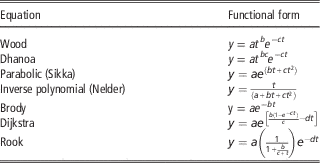
The non-linear models used to characterize the lactation curves for MY and compositions are presented in Table 1. A first attempt to synthesize the temporal variation of MY with a functional relationship was proposed by Brody et al. (Reference Brody, Ragsdale and Turner1923) that used an exponential function to describe the declining phase of lactation in dairy cattle. The incomplete γ function proposed by Wood (Reference Wood1967) has been used widely to study lactation curves in animals. Dhanoa (Reference Dhanoa1981) proposed a model which is similar to the Wood (Reference Wood1967) model. This model resulted in a lower correlation between parameters b and c, than was the case between these parameters in the original Wood model. The parabolic exponential function introduced by Sikka (Reference Sikka1950) to model MY resulted in a bell shaped truncated curve that, as a result of the curve symmetry around peak yield, only fitted MY reasonably during first lactation (Gahlot et al., Reference Gahlot, Gahlot and Jairath1988). Nelder model is a derivation of the Sikka model proposed by Nelder (Reference Nelder1966) using an inverse exponential parabolic function. Inverse polynomials are generally non-negative, bounded, and have a second-order form which has no built-in symmetry. The inverse polynomial overcomes the objections of ordinary polynomials (Nelder, Reference Nelder1966). Rook et al. (Reference Rook, France and Dhanoa1993) and Dijkstra et al. (Reference Dijkstra, France, Dhanoa, Maas, Hanigan, Rook and Beever1997) proposed modified forms of mechanistic models, based on a set of differential equations representing cell proliferation, and cell death, in the mammary gland, which resulted in a four-parameter equation. For all models, peak yield (PY) was assumed as the maximum predicted test-day MY or minimum predicted milk constituents and peak time (PT) was accepted as the test time, at which predicted daily MY was maximum or predicted milk constituents were minimum.
Equations and their features used to describe the lactation curve of Iranian buffaloes

y=milk yield and composition; a, b, c, d=parameters that define the scale and shape of the lactation curve; t=time from parturition.
Statistical analyses
Each model was fitted to monthly productive records of buffaloes using the NLIN and MODEL procedures in SAS (SAS Institute, 2002) and the parameters were estimated. The NLIN procedure produces least squares or weighted least squares estimates of the parameters of a non-linear model. For each non-linear model to be analyzed, the model (using a single dependent variable) and the names and starting values of the parameters to be estimated must be specified. When non-linear functions were fitted, the Gauss–Newton method was used as the iteration method. To begin this process the NLIN procedure first examines the starting value specifications of the parameters. If a grid of values is specified, NLIN procedure evaluates the residual sum of squares at each combination of parameter values to determine the set of parameter values producing the lowest residual sum of squares. These parameter values are used for the initial step of the iteration. The MODEL procedure analyzes models in which the relationships among the variables comprise a system of one or more non-linear equations. Primary uses of the MODEL procedure are estimation, simulation, and forecasting of non-linear simultaneous equation models. The models were tested for goodness of fit (quality of prediction) using adjusted coefficient of determination (
 $$R_{{{\rm adj}}}^{2} $$
), residual standard deviation or root means square error (RMSE), Durbin–Watson statistic (DW) and Akaike’s information criterion (AIC).
 $$R_{{{\rm adj}}}^{2} $$
was calculated using the following formula:
 $$R_{{{\rm adj}}}^{2} =1{\minus}\left[ {{{(n{\minus}1)} \over {(n{\minus}p)}}} \right](1{\minus}R^{2} )$$
where R
2 is the coefficient of determination
 $\left( {R^{2} =1{\minus}{{{\rm RSS}} \over {{\rm TSS}}}} \right)$
, TSS the total sum of squares, RSS the residual sum of squares, n the number of observations (data points) and p the number of parameters in the equation. The R
2 value is an indicator measuring the proportion of total variation about the mean of the trait explained by the lactation curve model. The coefficient of determination lies always between 0 and 1, and the fit of a model is satisfactory if R
2 is close to unity (Ghavi Hossein-Zadeh, Reference Ghavi Hossein-Zadeh2014a).
RMSE is a kind of generalized standard deviation and was calculated as follows:
 $${\rm RMSE}=\sqrt {{{{\rm RSS}} \over {n{\minus}p{\minus}1}}} $$
where RSS is the residual sum of squares, n the number of observations (data points) and p the number of parameters in the equation. RMSE value is one of the most important criteria to compare the suitability of used lactation curve models in terms of expression of lactation MY properties (Fernandez et al., Reference Fernandez, Sanchez and Garces2002). Therefore, the best model is the one with the lowest RMSE.
DW was used to detect the presence of autocorrelation in the residuals from the regression analysis. In fact, the presence of autocorrelated residuals suggests that the function may be inappropriate for the data. The DW statistic ranges in value from 0 to 4. A value near 2 indicates non-autocorrelation; a value toward 0 indicates positive autocorrelation; a value toward 4 indicates negative autocorrelation. DW was calculated using the following formula:
 $${\rm DW}={{\mathop{\sum}\nolimits_t^n {(e_{t} {\minus}e_{{t{\minus}1}} )^{2} } } \over {\mathop{\sum}\nolimits_{t=1}^n {e_{t}^{2} } }}$$
where e t is the residual at time t and e t−1 the residual at time t-1.
AIC was calculated as using the equation
 $${\rm AIC}=n{\times}\ln ({\rm RSS}){\plus}2p$$
AIC is a good statistic for comparison of models of different complexity because it adjusts the RSS for number of parameters in the model. A smaller numerical value of AIC indicates a better fit when comparing models.
Predicted 305-day MYs were obtained for every model using the following equation with substitution of y(t) by the corresponding model equation (Table 1):
 $$305\,{\rm MY}=\mathop{\sum}\limits_{t=5}^{305} {y(t)} $$
where 305MY is the predicted 305-day MY and y(t) the MY at day t (5, …, 305) estimated by corresponding lactation models. In addition, two types of persistency measures were used in the current study. The first type uses mathematical functions for determining the MY persistency (S) as follows:
 $$S={\minus}\left( {b{\plus}1} \right)\ln \left( c \right)\, {\rm for}\,{\rm Wood}\,{\rm model}$$
 $$S={\minus}\left( {bc{\plus}1} \right)\ln \left( c \right)\, {\rm for}\,{\rm Dhanoa}\,{\rm model}$$
where b and c are already fitted parameter estimates obtained from Wood or Dhanoa models. The second type of persistency measures uses ratios between different parts of the lactation (P 2 : 1, P 3 : 1 and P Weller). The P 2 : 1 and P 3 : 1 were proposed by Johansson and Hansson (Reference Johansson and Hansson1940). P 2 : 1 and P 3 : 1 are the ratios between the MYs of the second and third 100 days of lactation, respectively, and that of the first 100 days. In addition, Weller et al. (Reference Weller, Ezra and Leitner2006) defined milk persistency as estimated milk production at 180 day after peak divided by estimated peak production in percent as follows:
 $$P_{{{\rm Weller}}} ={\rm 1}00{\times}{\rm PROD(27}0{\rm )}\!/\!\,{\rm PROD(9}0{\rm )}\,{\rm For}\,{\rm parity}={\rm 1}$$
 $$P_{{{\rm Weller}}} ={\rm 1}00{\times}{\rm PROD(225)}\!/{\rm PROD(45)}\,{\rm For}\,{\rm parity}\,\gt {\rm 1}$$
where PROD(270), PROD(225), PROD(90) and PROD(45) are milk production at 270, 225, 90 and 45 DIM, respectively.
Results and discussion
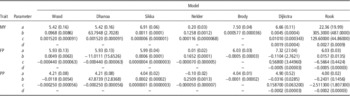
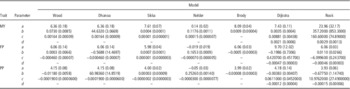
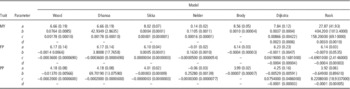
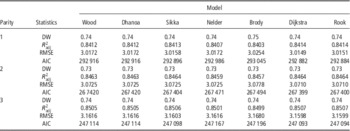
Estimated parameters of non-linear equations for the first-, second- and third-parity buffaloes are presented in Tables 2, 3 and 4. In addition, goodness of fit statistics for the seven models fitted to average standard curves of MY according to parity class are shown in Table 5. In general,
 $$R_{{{\rm adj}}}^{2} $$
and DW values were not different among the models for the first three parities. For all parities, Dijkstra and Rook models provided the lowest values of RMSE for MY, but Brody equation had the greatest value. For the first three parities, Dijkstra model provided the lowest AIC values, but Brody model had the greatest value of AIC (Table 5). Therefore, Dijkstra equation provided the best fit of MY for the first three parities of buffaloes.
Parameter estimates for the different lactation equations of the first-parity buffaloes

a, b, c, d=parameters that define the scale and shape of the lactation curve; MY=milk yield; FP=fat percentage; PP=protein percentage.
Standard errors are in parentheses.
Parameter estimates for the different lactation equations of second-parity buffaloes

a, b, c, d=parameters that define the scale and shape of the lactation curve; MY=milk yield; FP=fat percentage; PP=protein percentage.
Standard errors are in parentheses.
Parameter estimates for the different lactation equations of third-parity buffaloes

a, b, c, d=parameters that define the scale and shape of the lactation curve; MY=milk yield; FP=fat percentage; PP=protein percentage.
Standard errors are in parentheses.
Comparing goodness of fit for average standard curves of milk yield according to parity class, for Wood, Dhanoa, Sikka, Nelder, Brody, Dijkstra and Rook models

$R_{{{\rm adj}}}^{2} $
=adjusted coefficient of determination; RMSE=root means square error; DW=Durbin–Watson; AIC=Akaike information criteria.
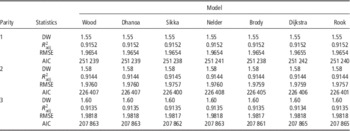
Goodness of fit statistics for the seven equations fitted to average standard curves of FP according to parity class are shown in Table 6. In general,
$$R_{{{\rm adj}}}^{2} $$
, DW and RMSE estimates were not different among the models. For the first parity, Sikka and Brody model provided the lowest AIC values, but Dijkstra model had the greatest value. For the second parity, Sikka model provided the lowest value of AIC, but Nelder equation had the greatest one. For the third parity, Brody model provided the lowest AIC value, but Dijkstra and Rook models had the greatest values (Table 6).
Comparing goodness of fit for average standard curves of fat percentage of milk according to parity class, for Wood, Dhanoa, Sikka, Nelder, Brody, Dijkstra and Rook models

$R_{{{\rm adj}}}^{2} $
=adjusted coefficient of determination; RMSE=root means square error; DW=Durbin–Watson; AIC=Akaike information criteria.
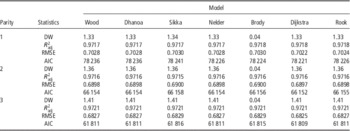
Goodness of fit statistics for the seven functions fitted to average standard curves of PP according to parity class are shown in Table 7. Brody model provided the lowest values of DW (0.04) for the first three parities and this indicated positive autocorrelation, but DW values were not different among other models. In addition, RMSE and
$$R_{{{\rm adj}}}^{2} $$
estimates were not different among the models. For the first three parities, Dijkstra model provided the lowest AIC values, but Sikka model had the greatest values of AIC (Table 7). Therefore, Dijkstra equation provided the best fit of PP for the first three parities of buffaloes.
Comparing goodness of fit for average standard curves of protein percentage of milk according to parity class, for Wood, Dhanoa, Sikka, Nelder, Brody, Dijkstra and Rook models

$R_{{{\rm adj}}}^{2} $
=adjusted coefficient of determination; RMSE=root means square error; DW=Durbin–Watson; AIC=Akaike information criteria.
It is necessary to develop an optimal method (such as genetic selection) to obtain a desired lactation shape through modifying the parameters of lactation model. The shape of the lactation curve has been shown to be influenced by parity, mainly because of a less well-defined peak (associated with high variation at the start of lactation) and greater lactation persistency in first-lactation animals (Ghavi Hossein-Zadeh, Reference Ghavi Hossein-Zadeh2014a). Lack of consistent milk recording (with many missing data) has made it difficult to construct the complete lactation curve for individual animals and to estimate their total (e.g. 305 day) MYs, which is a major hindrance to genetic evaluation and selection of candidate animals in the field (Dematawewa and Dekkers, Reference Dematawewa and Dekkers2014). However, the lactation curve of an individual or a group can be expressed as a mathematical model that describes the relevant general pattern of milk production throughout the lactation (Aziz et al., Reference Aziz, Shalaby, El-Shafie, Mahdy and Nishida2006). Once the parameters of the model are estimated using the available yield information, it can be used to predict the missing values and thereby construct the complete (i.e. 305 day) lactation yield (Dematawewa and Dekkers, Reference Dematawewa and Dekkers2014). Variations between the lactation curve characteristics of primiparous and multiparous buffaloes are likely to be responsible for the significant difference between goodness of fit of the models for the different lactations. In addition, the difference between fit of models may have arisen from the variations in mathematical functions of the models (Ghavi Hossein-Zadeh, Reference Ghavi Hossein-Zadeh2014a).
Consistent with the current study, Dimauro et al. (Reference Dimauro, Catillo, Bacciu and Macciotta2005) showed that the models commonly used to fit the lactation curve in dairy cattle are able to describe with a high degree of accuracy average curves of water buffaloes. Dimauro et al. (Reference Dimauro, Catillo, Bacciu and Macciotta2005) reported peak time, peak yield and 300-day MY of Italian water buffaloes predicted by Wood model were 33 days, 10.9 kg/day and 2327 kg, respectively. Dematawewa and Dekkers (Reference Dematawewa and Dekkers2014) reported Dijkstra model provided a slightly better fit of MY than Wood model for Murrah buffaloes in Sri Lanka, but Rook function can be recommended for lactation curve modeling of buffaloes in Sri Lanka. Aziz et al. (Reference Aziz, Shalaby, El-Shafie, Mahdy and Nishida2006), Barbosa et al. (Reference Barbosa, Pereira, Santoro, Batista and Ribeiro Neto2007) and Abdel-Salam et al. (Reference Abdel-Salam, Mekkawy, Hafez, Zaki and Abou-Bakr2011) reported Wood function provided the best fit of lactation curve in Murrah buffaloes, crossbred buffaloes in the Amazonian region of Brazil and Egyptian buffaloes, respectively. However, these researchers did not fit Dijkstra model in their study. The Dijkstra equation provided the best fit of lactation curve for MY and PP in the current study. This model has two advantages over the Wood equation, namely, the precise biological meaning of the parameters and the value of the intercept that is not nil (Ghavi Hossein-Zadeh, Reference Ghavi Hossein-Zadeh2014a). It is important to note that mechanistic models, such as Dijkstra and Rook, were developed for lactation yield considering cell proliferation rates, apoptosis and secretion rates and their underlying mechanisms. Therefore, when such mechanistic models developed for yield data are fitted to percentage traits of milk (FP and PP), they act like another empirical models.
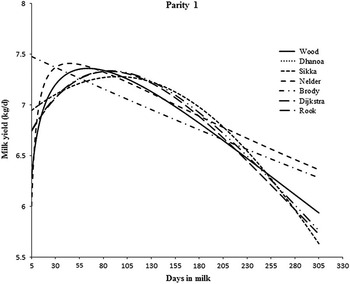
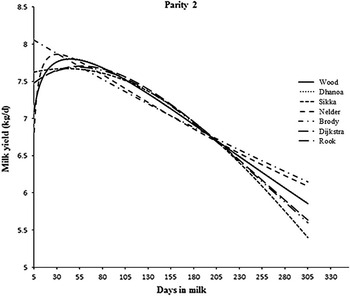
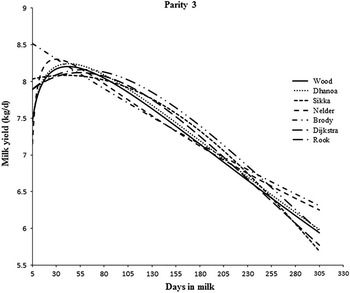
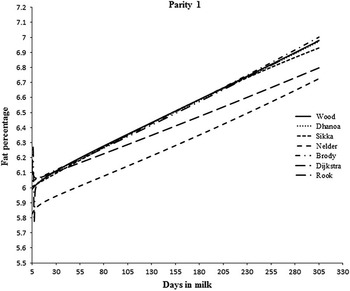
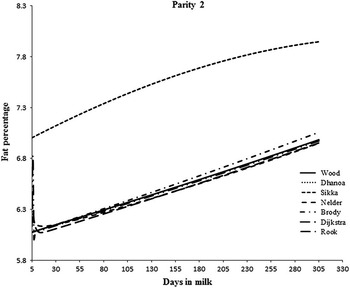
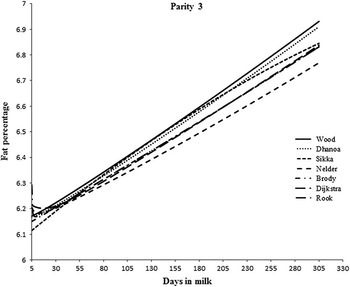
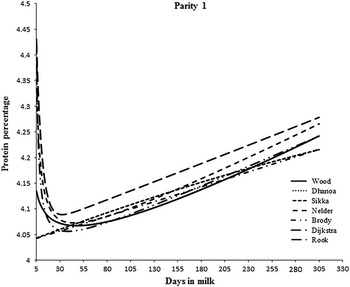
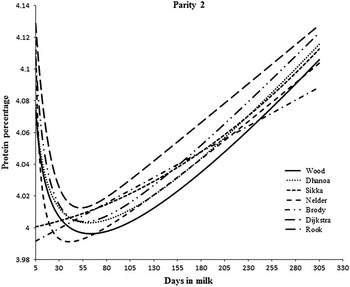
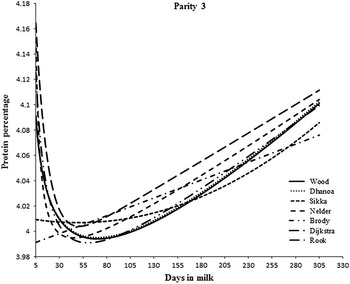
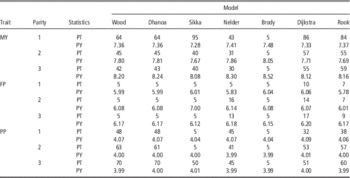
For the first parity, the peak MY was 8.22 kg/day on day 59 of lactation and minimum values of FP and PP were 5.24% and 2.89% on day 31 of lactation, respectively. For the second parity, the peak yield of milk was 8.38 kg/day on day 35 of lactation and minimum values of FP and PP were 5.71% and 3.71% on days 17 and 39 of lactation, respectively. For the third parity, the peak yield of milk was 9.08 kg/day on day 31 of lactation and minimum values of FP and PP were 5.85% and 3.63% on days 19 and 57 of lactation, respectively. Time to the peak and production at peak for average standard lactations of MY and minimum production and corresponding time for FP and PP according to parity class predicted by the seven non-linear equations are shown in Table 8. Predicted MY, FP and PP lactation curves across the parities are shown in Figures 1 to 9, respectively. Evaluation of first lactation features showed that the Wood and Dhanoa equations were able to estimate the time to the peak more accurately than the other equations. In addition, Nelder and Dijkstra equations were able to estimate the peak time at second and third parities more accurately than other equations, respectively. Brody function provided more accurate predictions of peak MY over the first three parities of buffaloes. For first and third lactation FP, Dijkstra equation was able to estimate the time to the minimum FP, but Nelder equation provided more accurate estimate of minimum time than other models for the second parity. Rook equation was able to predict more accurately the minimum values of FP at first and second parities, but Sikka model provided more accurate prediction of minimum FP for third-parity buffaloes. Dijkstra, Nelder and Rook equations provided more accurate estimates of time to the minimum values of PP for the first three parities, respectively. For first parity PP, Sikka and Brody equations were able to estimate the minimum PP more accurately than the other equations; but, for second parity PP, the minimum value of PP was predicted more accurately by the Nelder and Brody models. Although all equations over-predicted the minimum PP for third-parity buffaloes, but Wood, Nelder, Brody and Rook equations provided slightly better predictions of minimum PP. It must be noted that peak yield and overall milk production of buffaloes is lower than in dairy cattle. Such a relevant limitation of the productive ability of buffaloes can be assigned to the lack of selection in this species (Catillo et al., Reference Catillo, Macciotta, Carretta and Cappio-Borlino2002). The state of pregnancy results in a markedly reduced MY for lactating buffalo cows, as happened in dairy cattle before the development of selection programs for the improvement of MY (Coulon et al., Reference Coulon, Perochon and Lescourret1995). Latest peak production observed in first lactation for most models in the current study, while third lactation buffaloes generally had the earliest day of peak production and this might be explained by the milk secretary tissue in primiparous buffaloes taking longer to reach its peak activity than in multiparous buffaloes (Ghavi Hossein-Zadeh, Reference Ghavi Hossein-Zadeh2014a).
Lactation curves for milk yield predicted by Wood, Dhanoa, Sikka, Nelder, Brody, Dijkstra and Rook models in the first-parity buffaloes.

Lactation curves for milk yield predicted by Wood, Dhanoa, Sikka, Nelder, Brody, Dijkstra and Rook models in second-parity buffaloes.

Lactation curves for milk yield predicted by Wood, Dhanoa, Sikka, Nelder, Brody, Dijkstra and Rook models in third-parity buffaloes.

Lactation curves for fat percentage of milk predicted by Wood, Dhanoa, Sikka, Nelder, Brody, Dijkstra and Rook models in the first-parity buffaloes.

Lactation curves for fat percentage of milk predicted by Wood, Dhanoa, Sikka, Nelder, Brody, Dijkstra and Rook models in second-parity buffaloes.

Lactation curves for fat percentage of milk predicted by Wood, Dhanoa, Sikka, Nelder, Brody, Dijkstra and Rook models in third-parity buffaloes.

Lactation curves for protein percentage of milk predicted by Wood, Dhanoa, Sikka, Nelder, Brody, Dijkstra and Rook models in the first-parity buffaloes.

Lactation curves for protein percentage of milk predicted by Wood, Dhanoa, Sikka, Nelder, Brody, Dijkstra and Rook models in second-parity buffaloes.

Lactation curves for protein percentage of milk predicted by Wood, Dhanoa, Sikka, Nelder, Brody, Dijkstra and Rook models in third-parity buffaloes.

PT and PY for average standard lactations of MY, FP and PP according to parity class, predicted by Wood, Dhanoa, Sikka, Nelder, Brody, Dijkstra and Rook models

PT=peak time; PY=maximum value for MY and minimum value for FP and PP; MY=milk yield; FP=fat percentage; PP=protein percentage.
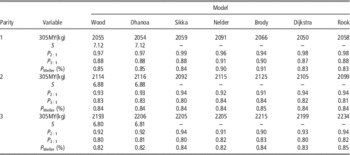
Different persistency measures and 305-day MY for average standard lactations of buffaloes according to parity class, predicted by different equations are presented in Table 9. For first-parity buffaloes, Nelder model and Dijkstra equation provided the greatest and lowest 305-day MY, respectively. Brody and Rook models predicted the greatest 305-day MY at the second- and third parities, respectively, but Sikka and Wood models provided the lowest 305-day MY for the second- and third parities, respectively. According to the persistency measures obtained from different models, the highest MY persistency was obtained during first parity. For first-parity buffaloes, Sikka equation provided the most persistent lactation curves based on P 2 : 1, but Nelder and Brody models provided lactations with better persistency than other equations according to P 3 : 1 and P Weller, respectively. For second-parity buffaloes, Sikka, Dijkstra and Rook models provided the most persistent lactation curves based on P 2 : 1, but Nelder and Brody models provided lactations with better persistency than other equations according to P 3 : 1 measure. In addition, Brody equation provided the most persistent lactation curves based on P Weller. On the other hand, Sikka and Rook equations provided the most persistent lactation curves based on the measures of P 2 : 1, but Brody and Rook models provided lactations with better persistency than other equations according to P 3 : 1 and P Weller for third-parity buffaloes, respectively. More countries are currently shifting to test-day models in genetic evaluation; hence, 305-day yields may no longer be necessary for genetic evaluation. However, 305-day yields will always be vital information for the farm managers and veterinarians to provide a current indicator of animal performance (Flores et al., Reference Flores, Kinghorn and van der Werf2013). Lactation persistency is the ability of the animal to maintain milk production at a high level after the peak yield, that is, a persistent animal has a flatter milk curve (Cobuci et al., Reference Cobuci, Euclydes, Pereira, Torres R de, Costa and Lopes2003). High persistency is associated with more resistance to disease, better utilization of feed, reduced stress from high peak MY and low reproductive costs (Gengler, Reference Gengler1996; Cole and Null, Reference Cole and Null2009). Persistent animals generate more return (Dekkers et al., Reference Dekkers, Ten Hag and Weersink1998); therefore, enhancing persistency could promote efficient and economical milk production. For animals with flatter lactation curves, the incidence of metabolic and reproductive disorders that originate from the physiological stress of high MY would be lower, and the proportion of roughage in the ration could be increased, thus reducing production costs (Tekerli et al., Reference Tekerli, Akinci, Dogan and Akcan2000). Therefore, a genetic change towards a persistent lactation curve could be applied as a means to lower the disease susceptibility in dairy buffaloes. It was suggested that persistent buffaloes might lose less BW indicating a favorable relationship between persistency and reduced negative energy balance (Ghavi Hossein-Zadeh, Reference Ghavi Hossein-Zadeh2014a). There was generally a positive relationship between 305MY and persistency measures and also between peak yield and 305MY, calculated by different models, within each lactation in the current study. Persistency is dependent on total yields, but the direction of the relationship depends on the measures used. The ratio measures (such as the measures in the current study) show a positive one, whereas the variation measures show a negative relationship (Gengler, Reference Gengler1996). The reason for this could be that the first are highly affected by the level of production and the second are influenced by variation in production, with this variation more important for high producing animals (Gengler, Reference Gengler1996). In addition, dairy buffaloes with high daily MY at peak can produce more total MY over the lactation than lower producing buffaloes at peak day. Therefore, dairy buffaloes could be selected on the basis of their peak yield.
Different measures of persistency and 305-day milk yield for average standard lactations of buffaloes according to parity class, predicted by Wood, Dhanoa, Sikka, Nelder, Brody, Dijkstra and Rook models

305MY=predicted 305-day milk yield; S=milk yield persistency obtained from Wood or Dhanoa models; P 2 : 1=ratio between the milk yields of the second 100 days of lactation and those of the first 100 days; P 3 : 1=ratio between the milk yields of the third 100 days of lactation and those of the first 100 days; P Weller=milk yield persistency measure proposed by Weller et al. (Reference Weller, Ezra and Leitner2006).
Conclusions
A number of factors could be considered when selecting the optimal model to describe the lactation curve of dairy buffaloes. While the key factor is the accuracy of the fit of the model, the possibility of calculating the curve characteristics and the interpretation of the curve’s parameters is as important. Of the seven functions investigated in the current study, Dijkstra equation provided the best fit of MY and protein percentage of milk for the first three parities of buffaloes due to the lower values of RMSE and AIC than other models. For the first-parity buffaloes, Sikka and Brody models provided the best fit of fat percentage of milk, but for the second- and third-parity buffaloes, Sikka model and Brody equation provided the best fit of lactation curve for fat percentage of milk, respectively.
Acknowledgment
The author wishes to acknowledge the Animal Breeding Center of Iran for providing the data used in this study.