Introduction
Tonsillectomy is one of the commonest operations performed on children in the world. The most frequent indications are obstructive sleep apnoea (OSA) and recurrent tonsillitis. For recurrent tonsillitis, a number of randomised, controlled trialsReference Paradise, Bluestone, Bachman, Colborn, Bernard and Taylor1–Reference Lock, Wilson, Steen, Eccles, Mason and Carrie4 have provided good-quality evidence for the number of episodes that might justify intervention, and clinicians have evidence-based guidelines to follow.5 For OSA, the exact indications are still the subject of some discussion.
Tonsillectomy rates have been found to vary substantially within a number of countries. In the USA, for example, there is a four-fold variation in tonsillectomy rate for children in different regions of the country, and more than a two-fold variation between rural and urban areas.Reference Boss, Marsteller and Simon6 A similar urban–rural difference was found in Australia.Reference Close, Rushworth, Rob and Rubin7 In Canada, a six-fold variation between geographical areas was found.Reference Croxford, Friedberg and Coyte8 In England, a 2010 study found a seven-fold variation between local authority areas in paediatric tonsillectomy rates,Reference Suleman, Clark, Goldacre and Burton9 and this could not be explained by variations in the proportion or rate of tonsillectomies performed in the private sector. In fact, these substantial variations in intervention rates within countries have never been satisfactorily explained.
Socio-economic deprivation is a major determinant of health, and otolaryngological disorders in children are no exception. In the Canadian study, there was a significant association between greater socio-economic deprivation and higher rates of tonsillectomy.Reference Croxford, Friedberg and Coyte8 An English study, from 2014, found that children undergoing tonsillectomy were twice as likely to be from the most deprived 20 per cent of the population as the least deprived 20 per cent.Reference Koshy, Bottle, Murray, Sharland and Saxena10 Similar differences have been found in Scotland.Reference Bisset and Russell11,Reference Clement12
It has been known for some time that considerable variation in tonsillectomy rates exists between Scottish health boards. A two-fold difference in tonsillectomy rates was found between Scottish health boards in the period from 1975 to 1990.Reference Bisset and Russell11 Much has changed since the 1990s, and although overall paediatric tonsillectomy rates in Scotland have remained relatively static this century, the proportions of younger children (aged under four years), and of children with OSA, undergoing tonsillectomy have risen substantially in recent years.Reference Kubba and Downie13 This study therefore aimed to use routinely collected National Health Service (NHS) data to determine whether geographical variations are still evident and whether they can be accounted for by differences in socio-economic deprivation between health boards.
Materials and methods
Ethical considerations
This work is based on anonymised data that are routinely collected by the NHS and freely available on reasonable request to the Information Services Division of NHS Scotland. Research ethics committee approval was not required for access to the data. There were no specific ethical considerations.
Data sources
The Information Services Division of NHS Scotland provided data based on the Scottish Morbidity Record. Scottish Morbidity Record returns are produced by all NHS hospitals in Scotland. Each acute hospital episode is coded, whether in-patient or day-case, and the Information Services Division report that their data are at least 99 per cent complete.14
For this study, data were provided, covering all Scottish hospitals in the period from 2001 to 2018, for the number of tonsillectomy procedures, using the Office of Population Censuses and Surveys code F34 and all its sub-categories, for patients aged 0–16 years. Where more than one procedure was performed under the same anaesthetic (such as tonsillectomy, adenoidectomy or middle-ear ventilation tube insertion), the procedure was included if there was a code for tonsillectomy as any of the first, second, third or fourth coded procedures. Data were provided according to the health board where surgery was performed, by default. We also obtained data according to the health board in which the patient was resident and on the diagnostic code associated with each tonsil surgery procedure. Data were extracted using RStudio for R programming language, version 3.5.1 (RStudio, Boston, USA). NHS Scotland uses the World Health Organization's International Classification of Diseases version 10 codes.15
Scotland has 14 health boards, comprising 11 mainland health boards and 3 island health boards. The three island health boards have very small populations and have not been included in the study because the Information Services Division will not provide data where the number of cases is so small that there is a theoretical risk that individual patients may be identified, for reasons of confidentiality. Data presented here are therefore only from the 11 mainland health boards, each of which has 1 hospital site where children's otolaryngological surgery is currently performed.
Population data for Scotland for each year from 2001 to 2018, by year of patient age and by health board of residence, are freely available on the National Records of Scotland website.16 These figures allowed us to calculate intervention rates corrected for any change in population specific for each year and each health board area, and expressed as tonsillectomies per 1000 children. For some calculations, the mean population of each health board over the period from 2001 to 2018 was used.
Socio-economic deprivation
The Scottish Index of Multiple Deprivation (2020 version) is a tool to measure relative socio-economic deprivation between different areas of Scotland. The country is divided into 6505 small geographical areas based on the postal code, and these are ranked in order from most deprived to least deprived based on a weighted sum of scores in 38 indicators across 7 domains (income, employment, health, education, skills and training, housing, geographical access and crime). These ranks are then used to aggregate the areas into five equal-sized groups (quintiles), each containing 20 per cent of the Scottish population, with quintile 1 being the most deprived and quintile 5 being the most affluent. As the birth rate varies across the quintiles, they do not each contain 20 per cent of the children in the population, but data are available for the number of children aged 0–16 years, resident in each health board area, for each Scottish Index of Multiple Deprivation quintile. The mean number of children in each deprivation quintile in each health board area over the study period from 2001 to 2018 was used as the basis for the calculations in this study.
Statistical analyses
Trends over time were identified by performing simple linear regression using least squares, with the number of procedures as the dependent variable and time as the independent variable. Inspection of the data confirmed that a simple linear model was appropriate, as all apparent trends were linear with no major step changes. Analysis was performed using SPSS statistical software, version 27 (IBM, Armonk, New York, USA).
Results
Over the period from 2001 to 2018, 46 425 tonsillectomies were performed in the 11 mainland health boards of Scotland on children aged 0–16 years. Of these, 252 were performed on children resident in 1 of the 3 island health boards or children resident outside of Scotland (mostly in England, Wales and Northern Ireland). This leaves 46 173 procedures performed on residents of the 11 mainland health boards.
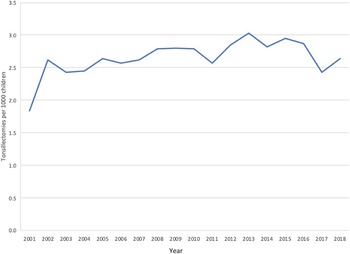
The total number of children aged 0–16 years in mainland Scotland varied between a maximum of 1 021 280 in 2001 and a minimum of 957 826 in 2014. The intervention rate varied between 1.83 and 3.01 tonsillectomies per 1000 children resident, with a mean of 2.64 per 1000. The rate shows a small but statistically significant increase over the study period (R = 0.561, p = 0.015), as shown in Figure 1.
Tonsillectomy rate per 1000 children resident in the 11 mainland health board areas of Scotland, 2001–2018. There is a significant increase in the rate over time (R = 0.561, p = 0.015).

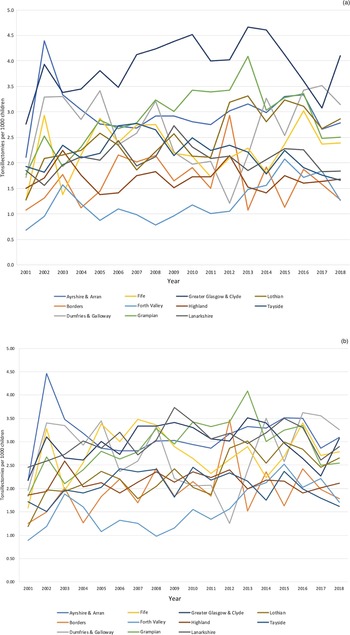
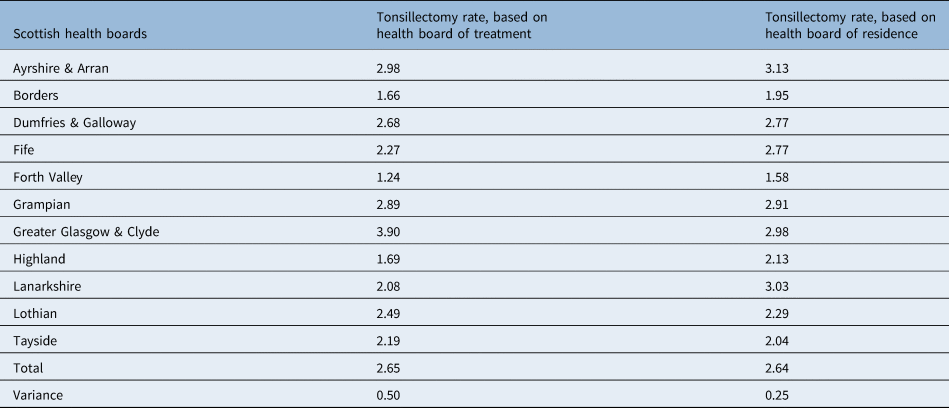
The intervention rate varied considerably between the 11 mainland health boards, as shown in Figure 2a. The rate for each health board was mostly consistent over the period under study, with the only health boards showing a significant increase over time being Forth Valley (R = 0.639, p = 0.004), Grampian (R = 0.533, p = 0.023) and Lothian (R = 0.753, p < 0.001). After recalculating the intervention rates based on health board of residence rather than health board of treatment, the variation between health boards was lower, as shown in Figure 2b and Table 1. The variance reduced from 0.5 to 0.25.
Tonsillectomy rates per 1000 children for each of the 11 mainland health boards in Scotland, 2001–2018, based on: (a) the health board where the surgery was performed, and (b) the health board where the child was resident.

Tonsillectomy rate, 2001–2018, for all 11 mainland health boards of Scotland

Data represent mean annual tonsillectomy rates per 1000 children
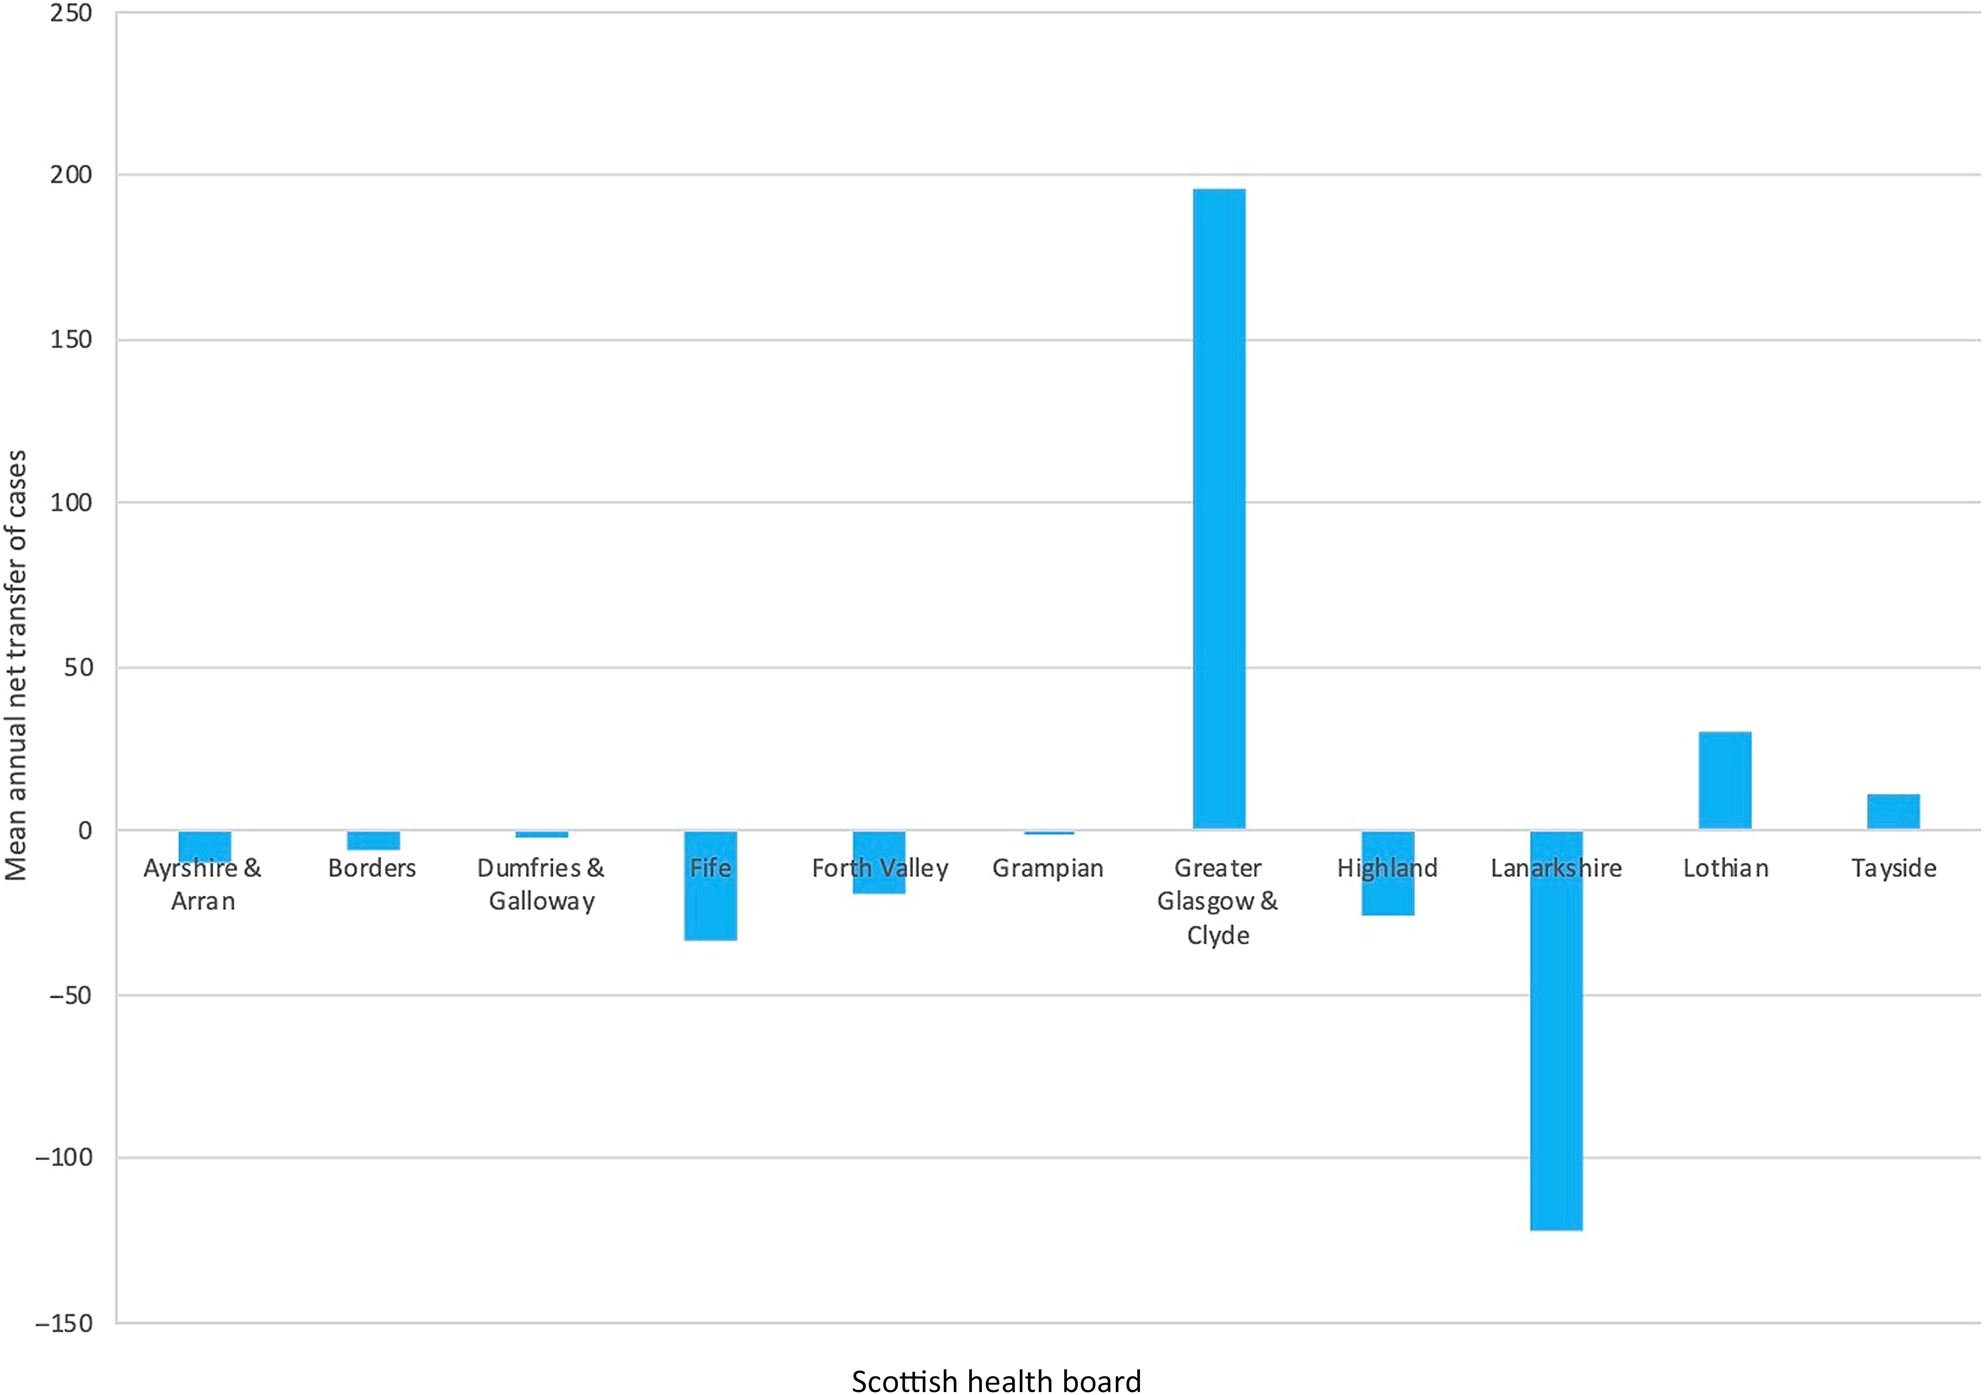
The mean annual net transfer of children for tonsillectomy is shown in Figure 3, with Greater Glasgow and Clyde receiving the largest number of cases from outside the health board area, and Lanarkshire being the largest net exporter of cases. Over the study period, 23.7 per cent of tonsillectomies performed in Greater Glasgow and Clyde were on children resident in a different health board area. Conversely, 31.3 per cent of children resident in Lanarkshire had their tonsillectomy performed elsewhere.
The mean annual number of children transferred between health boards for tonsillectomy (transfers from another health board minus transfers to another health board). Greater Glasgow and Clyde operates on the largest number of children from outside of the health board, while Lanarkshire exports the largest number.

More than 150 distinct International Classification of Diseases version 10 codes were associated with the tonsil surgery procedures. In 57.6 per cent of cases, these were clearly related to recurrent tonsillitis as the indication for surgery, namely J03 (variations on ‘acute tonsillitis’) and J02 (variations on ‘pharyngitis’). In 22.4 per cent of cases, the diagnostic codes were highly suggestive of OSA as the indication for the tonsil surgery, namely J351, J352 and J353 (‘hypertrophy of tonsils and adenoids’), G473 (‘disorders of sleep: sleep apnoea’) and R065 (‘breathing disorders: snoring’). For the remainder, the coding was not obviously related to a specific indication for tonsil surgery, and we have grouped these together as ‘other’ (20 per cent of the total). In many of these, it is clear that the coding refers to an associated condition such as otitis media, inferior turbinate hypertrophy or laryngomalacia, which is not directly related to the tonsil procedure but may relate to another procedure performed under the same general anaesthetic, such as middle-ear ventilation tubes, turbinate reduction or supraglottoplasty.
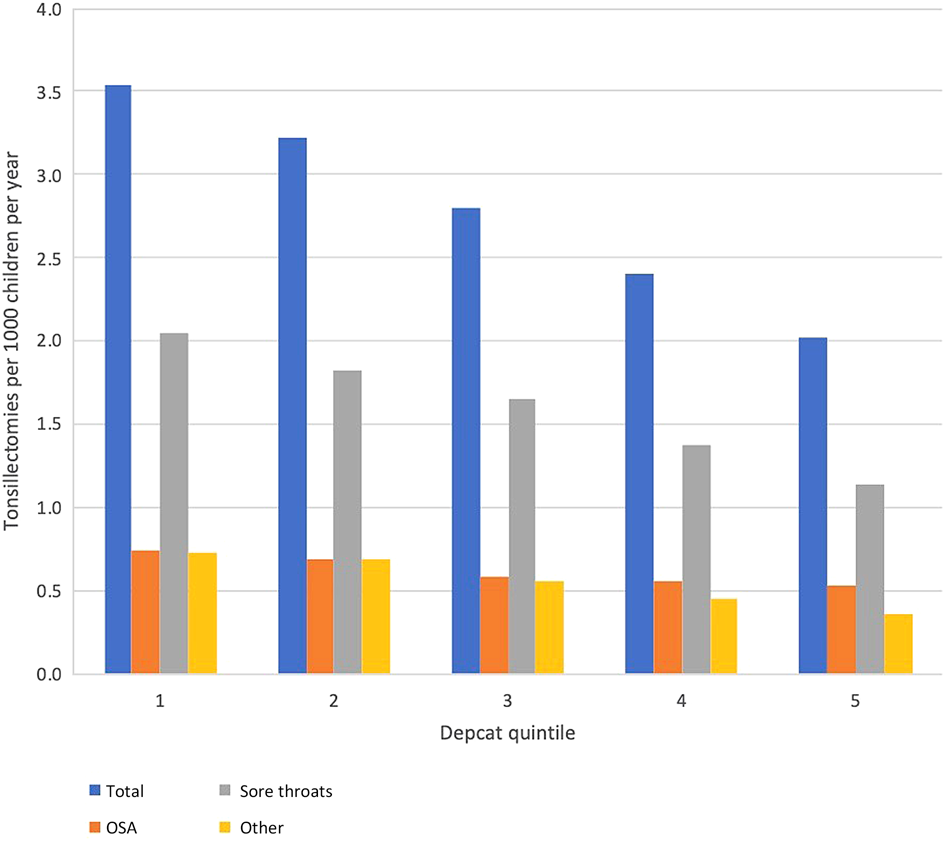
Tonsillectomy rate varied with Scottish Index of Multiple Deprivation quintile of socio-economic deprivation, with more procedures being performed in children resident in the most deprived areas, as shown in Figure 4. The tonsillectomy rate varied between 3.54 per 1000 children in Scottish Index of Multiple Deprivation quintile 1 and 2.03 per 1000 children in quintile 5 (chi-square test for trend across five ordered categories; chi-square = 1999.3, degrees of freedom = 1, p < 0.00001). This trend is also apparent when considering only those tonsillectomies performed for recurrent sore throats (chi-square = 1204.9, degrees of freedom = 1, p < 0.00001) or for obstructive symptoms (chi-square = 191.7, degrees of freedom = 1, p < 0.00001), or those with unclear indications (‘other’; chi-square = 621.0, degrees of freedom = 1, p < 0.00001).
Variation in tonsillectomy rate per 1000 children in each Scottish Index of Multiple Deprivation quintile for socio-economic deprivation (quintile 1 is the most deprived, quintile 5 the most affluent). Depcat = deprivation category score; OSA = obstructive sleep apnoea

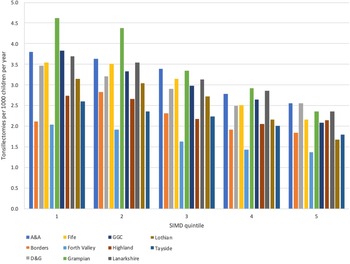
The deprivation profile was very variable between health boards. In some health boards, such as Lanarkshire, Greater Glasgow and Clyde, Ayrshire and Arran, and Fife, there was a preponderance of children resident in more deprived areas. In others, such as Lothian, Borders and Grampian, there was a preponderance of children in the more affluent areas. The remaining health board areas showed a more even spread across the Scottish Index of Multiple Deprivation quintiles. We examined the tonsillectomy rate per 1000 children in each Scottish Index of Multiple Deprivation quintile in each health board area to see if deprivation was the cause of the variation between health boards. The results are shown in Figure 5. There remained considerable variation between health boards in the intervention rate, even within each Scottish Index of Multiple Deprivation quintile. The variance was greatest in the most deprived quintiles (0.57 for quintile 1, 0.41 for quintile 2 and 0.29 for quintile 3) and lowest for the most affluent quintiles (0.2 for quintile 4 and 0.13 for quintile 5).
Tonsillectomy rates by health board and Scottish Index of Multiple Deprivation (SIMD) quintile. A&A = Ayrshire and Arran; D&G = Dumfries & Galloway; GGC = Greater Glasgow and Clyde

Discussion
The overall tonsillectomy rate was fairly stable over the period from 2001 to 2018, with a mean annual rate of 2.64 tonsillectomies per 1000 children in Scotland.
It is clear that substantial geographical variations exist, with a three-fold difference between the health board with the lowest tonsillectomy rate (Forth Valley, 1.24 per 1000 children) and the highest (Greater Glasgow and Clyde, 3.9 per 1000). At first glance, this compares favourably with the four-fold variation between areas of the USA,Reference Boss, Marsteller and Simon6 the six-fold variation within CanadaReference Croxford, Friedberg and Coyte8 and the seven-fold variation within England.Reference Suleman, Clark, Goldacre and Burton9 However, we should remember that Scotland is a small country (at least in terms of population size) and there are many reasons why Scotland should be less prone to variation in tonsillectomy rates compared with other countries. The number of otolaryngologists in Scotland operating regularly on children is small, communication between departments is good and the specialty has an active society (ENT Scotland) where clinical matters are discussed. The vast majority of healthcare is delivered within the public system, with fewer than 10 per cent of the population thought to have any private health insurance.Reference Steel and Cylus17 The public health system (NHS Scotland) is run by 14 geographically defined health boards on a collaborative and planned basis and is therefore very distinct in nature from the patchwork of competing NHS Trusts that comprise the NHS in England, or indeed any country with a substantial private sector or competition between healthcare providers. A three-fold variation in tonsillectomy rates is not small, and the reasons behind it should be investigated.
One major cause for this variation is evident when comparing intervention rates by health board of residence rather than health board of intervention (which is the default way that data are presented). This is the result of significant net transfers of children between health boards for treatment. In some cases, this is driven by parental preference, but a large proportion will be the transfer of very young and medically complex children from district hospitals to one of Scotland's tertiary referral children's hospitals, which are located in Greater Glasgow and Clyde (Royal Hospital for Children, Glasgow), Lothian (Royal Hospital for Sick Children, Edinburgh) and Grampian (Royal Aberdeen Children's Hospital) health boards. Half the variance in tonsillectomy rates between health boards is explained by transfers between them. One very important conclusion from our data, therefore, is that when intervention rates are being discussed for children's surgery, the figures should always be based on health board of residence, not of treatment.
Once transfers of children between health boards have been accounted for, the difference between tonsillectomy rates is smaller, but still evident, with a 1.5-fold difference between the highest and the lowest. This has changed little since the study of intervention rates in Scotland from 1975 to 1990.Reference Bisset and Russell11
Tonsillectomy rates vary with socio-economic deprivation, with the highest intervention rate being in the most deprived children. The children in the most deprived quintile are 1.75 more likely to undergo tonsillectomy than those in the most affluent quintile. Deprivation profiles are very different between health boards, and they change over time, with some health boards having changes of up to 10 per cent in the proportion of children in the most deprived quintile in a given year. However, we can see from our data that deprivation does not account for the variation in intervention rates between health boards. In fact, the variation between health boards is seen consistently within each of the quintiles in Figure 5, and is stable over time (data not shown but available on request).
• Despite evidence-based guidelines and expert consensus statements, tonsillectomy rates vary considerably between and within countries worldwide
• Scottish National Health Service data were used to examine tonsillectomy rate variations between geographical areas of Scotland
• There was a three-fold variation in tonsillectomy rate between Scottish health boards; half of this is due to transfers for treatment
• Accounting for transfers of care, there was a 1.5-fold difference between the health boards with the highest and lowest intervention rate
• There was a 1.75-fold difference between tonsillectomy rates in the most and least deprived population quintiles
• Deprivation does not explain the difference in intervention rates between health boards; this variation remains unexplained
The considerable variation in tonsillectomy rates between health boards remains unexplained. Possible explanations are genuine differences in disease prevalence, differences in health-seeking behaviour in the population or differences in the behaviour of clinicians (either general practitioners being more or less keen to refer for surgery, or surgeons being more or less keen to operate). The first two of these options would require access to good-quality population-based data, which we do not have at present. With regard to potential differences in the behaviour of clinicians, it is interesting to note that the differences in intervention rates between health boards are relatively stable across the 18 years of the study. Many general practitioners and hospital specialists will have retired and been replaced during such a long time period, so it seems very unlikely that the differences are caused by one or two ‘rogue’ individuals. Rather, such sustained differences in behaviour would have resulted from differences in ‘culture’ affecting many clinicians in each region. The presence of rogue individuals is not impossible, of course, but it seems less likely than a difference in disease prevalence.
Limitations of the data available mean that we are not able to account for procedures carried out in the private sector, although the small proportion of the Scottish population who have private insurance suggests that this is unlikely to be a major contributor to variation between health boards. Suleman et al. found no relation between tonsillectomies performed privately and the variation in intervention rates within England.Reference Suleman, Clark, Goldacre and Burton9 We are also not able to comment on any effect of ethnicity, as the reporting of ethnicity in Scottish Morbidity Record returns is incomplete.
Conclusion
Half the variance in paediatric tonsillectomy rates between health boards in Scotland is caused by children being transferred between regions for treatment. Once this has been accounted for, there is a 1.5-fold difference between the health boards with the highest and the lowest intervention rates. This is not accounted for by socio-economic deprivation. At present, this variation is unexplained. There is a 1.75-fold difference between tonsillectomy rates in the most deprived and least deprived population quintiles. Data on children's surgery should always be reported by the child's health board of residence.
Competing interests
None declared