INTRODUCTION
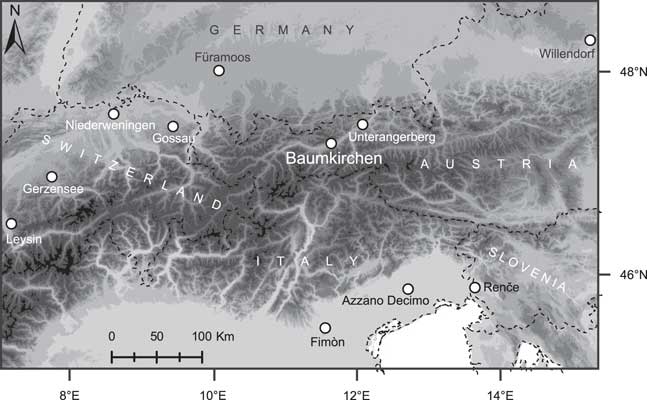
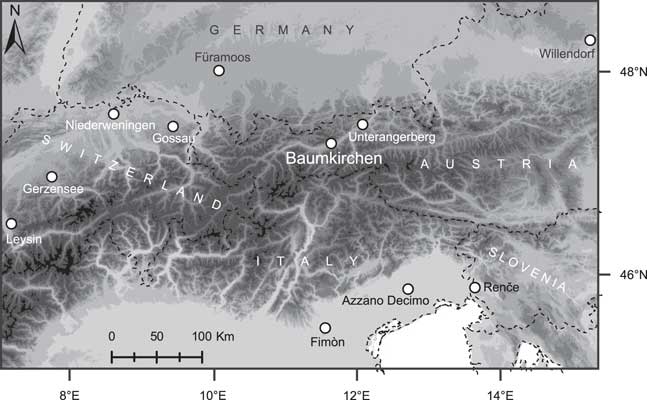
Thick successions of banded clayey silts, locally known as Bändertone, are present in glacially carved valleys and basins of the Alps. While the majority of these lacustrine deposits formed during the last deglaciation, some of them record earlier lake phases. One of the most interesting and best-preserved successions are the Bändertone of Baumkirchen (Tyrol, western Austria; Fig. 1), known for more than a century (Blaas, Reference Blaas1885; Penck, Reference Penck1890). The Sub-Commission for European Quaternary Stratigraphy defined the top of these sediments in the clay pit of Baumkirchen as the stratotype of the Middle to Upper Würmian transition in the Alps (Chaline and Jerz, Reference Chaline and Jerz1984), which corresponds approximately to the transition between Marine Oxygen Isotope Stages (MIS) 3 and 2 (e.g., Heiri et al., Reference Heiri, Koinig, Spötl, Barrett, Brauer, Drescher-Schneider and Gaar2014). The clay pit was meticulously studied by Fliri and colleagues (e.g., Fliri et al., Reference Fliri, Hirscher and Markgraf1971; Fliri, Reference Fliri1973), who reported rare findings of Pinus sylvestris (Scots pine), Pinus mugo (dwarf pine), Alnus alnobetula (=A. viridis, green alder), and Hippophae rhamnoides (sea buckthorn). These plant remains not only provided a means to radiocarbon date these sediments (recently re-dated by Spötl et al. [Reference Spötl, Reimer, Starnberger and Reimer2013]); they also allowed key insights into the palaeovegetation inside the Alps prior to the last glacial maximum (LGM). Pollen analysis of these sediments was first attempted by Sarnthein (Reference Sarnthein1937). Later, Bortenschlager (in Fliri et al., Reference Fliri, Bortenschlager, Felber, Heissel, Hilscher and Resch1970) took three samples of which he could evaluate one. The pollen content was low (<100 grains/cm3) and preservation was poor. Markgraf (in Fliri et al., Reference Fliri, Hirscher and Markgraf1971) collected samples to look for seasonal patterns but did not succeed due to the low pollen content. In 1978, however, Bortenschlager and Bortenschlager succeeded through a detailed analysis of an 86-cm-long section (ca. 654 m above sea level [asl]). The pollen flora and the overall low pollen concentration correspond to a forest-free (although not tree- and shrub-free) vegetation. The authors were also able to distinguish 17 possible growing seasons in this short section. As expected, the sedimentation rate proved to be high and variable, between 3 and 8 cm/yr.
Map of the Eastern and Central Alps showing the location of the Baumkirchen site and other important sites mentioned in the text.
The Baumkirchen sequence corresponds to the period during the last glacial cycle dominated by Dansgaard-Oeschger cycles. These millennial- to centennial-scale climate events known from the Greenland ice cores (North Greenland Ice Core Project members, 2004) are also recorded by speleothems in the Eastern Alps (e.g., Spötl et al., Reference Spötl, Mangini and Richard2006; Moseley et al., Reference Moseley, Spötl, Svensson, Cheng, Brandstätter and Edwards2014). Given the scarcity of surface records, however, little is known about the impact these climatic events had on the Alpine landscape and ecosystems. Thus, the high-resolution Baumkirchen sequence provides a unique window into the response of the Alpine environment to these high-magnitude climate fluctuations. The aim of this study was to take a fresh, new look at the palynology of the Baumkirchen succession in an attempt to improve our knowledge of the paleovegetation and its response to Dansgaard-Oeschger cycles. This was made possible by a series of scientific core drillings, which provide a much longer and continuous record of these sediments than the previous (and, meanwhile, largely back-filled) clay pit.
Study site
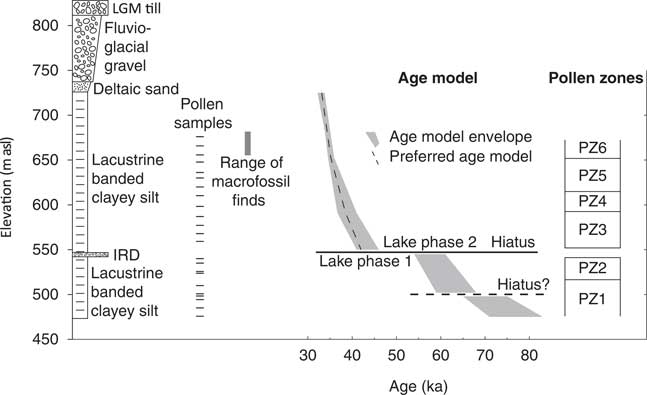
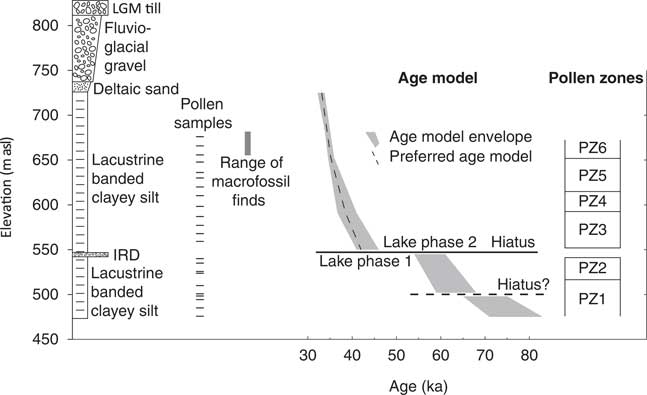
The Baumkirchen lacustrine sequence is located in the Gnadenwald terrace on the northern rim of the Inn Valley around 12 km east of Innsbruck (Tyrol). The sediments are overconsolidated due to the overlying ice during the LGM but are uncemented and diagenetically unaltered (Köhler and Resch, Reference Köhler and Resch1973). The site has recently been the subject of a renewed major research effort including scientific drilling, which extended the thickness of the succession to 250 m. The latter can be divided into two lake phases chronologically constrained by luminescence dating (Barrett et al., Reference Barrett, Starnberger, Tjallingii, Brauer and Spötl2017). The lower phase (LP1) is poorly constrained but extends from ca. 70–83 ka until ca. 55–63 ka, spanning MIS 4 and possibly MIS 5a, and is characterized by a low sedimentation rate. The upper phase (LP2) extends from ca. 45–33 ka with a closely spaced series of radiocarbon dates (on plant macrofossils) providing a more precise tie point of the upper part of the sequence to ca. 35 cal ka BP (Spötl et al., Reference Spötl, Reimer, Starnberger and Reimer2013), corresponding to mid- to late MIS 3 (Fig. 2). This upper sequence is characterized by a much higher sedimentation rate. Besides a short section (ca. 5 m) in the uppermost part of LP1 interpreted as ice-rafted debris, the majority of the paleolake sequence is interpreted as being fed by glacial streams with no direct ice contact (Barrett Reference Barrett2017; Barrett et al., Reference Barrett, Starnberger, Tjallingii, Brauer and Spötl2017).
Simplified stratigraphic log and age model envelope based on Barrett et al. (Reference Barrett, Starnberger, Tjallingii, Brauer and Spötl2017). Sample locations for pollen analysis are indicated, along with the depth range of the plant macrofossils mentioned in Spötl et al. (Reference Spötl, Reimer, Starnberger and Reimer2013). The pollen zones are also shown (see Fig. 3 and 4). IRD, ice-rafted debris.
The central Inn Valley presently has a humid continental climate. The potential natural modern vegetation of the floor of the valley corresponds to montane riverine forests with Alnus incana, but is now mostly transformed into vegetable fields and meadows. At intermediate altitudes on the south-facing slopes of the Northern Calcareous Alps (Nordkette), inner-alpine pine forests (Pinus sylvestris) are dominant west of Innsbruck, whereas montane Fagus-Abies forests are present east of Innsbruck (i.e., the area immediately north of Baumkirchen). The higher altitudes are covered by dwarf pine stands (Pinus mugo) and alpine grassland. Abies-Picea forests are predominant on the north-facing slopes south of the Inn river. At higher altitudes, subalpine forests with Larix and Pinus cembra are common (Wagner, Reference Wagner1985). Various woodland communities have been partially transformed into spruce plantations or meadows.
Regarding the origin of the pollen embedded in the Baumkirchen sediments, three sources can be expected: (1) wind-blown grains from the vegetation of the catchment area, including the central Inn Valley, surrounding mountains, and parts of the Southern Alps and Pre-Alps due to long-distance pollen transport by strong winds (e.g., Foehn); (2) fluvially delivered grains derived from erosion of contemporaneous or older sediments; and (3) fluvially delivered grains melted out of glaciers upstream in the Inn Valley or its tributaries.
MATERIALS AND METHODS
Since the general state of the vegetation is of interest, samples for pollen analysis should include at least 10 yr. Estimates based on previous pollen analyses (Bortenschlager and Bortenschlager, Reference Bortenschlager and Bortenschlager1978), radiocarbon (Spötl et al., Reference Spötl, Reimer, Starnberger and Reimer2013), and luminescence dating (Barrett et al., Reference Barrett, Starnberger, Tjallingii, Brauer and Spötl2017) indicate high sedimentation rates of >3 cm/yr. Therefore, strips of sediment were sampled from cores of ca. 50 cm in length with a diameter of 1–1.5 cm. Thirteen samples were taken with a spacing of ca. 10 m from cores between ca. 676 and 559 m asl corresponding to LP2 (samples covering ca. 8–50 yr, spaced ca. 170–1000 yr apart). Ten samples were taken in LP1 between ca. 540 and 476 m asl with a slightly closer sample spacing of ca. 6–7 m due to the expected lower sedimentation rate (samples covering ca. 55–170 yr, spaced ca. 720–2200 yr apart).
The samples were dried and homogenized. Of this material, 6–12 cm3 were sub-sampled and treated with cold concentrated hydroflouric acid (HF) for at least 24 hours. In some cases, the process was repeated with hot HF. As the pollen density was expected to be very low, 4–8 slides were prepared from each sample and combined to reach a minimum pollen sum of 50 pollen grains. In two samples (510 and 494 m asl) the total amount nonetheless remained lower (48 and 39 grains, respectively). Lycopodium pollen was added in order to obtain pollen concentration data (following Stockmarr, Reference Stockmarr1971).
Pollen counting was undertaken using a Leitz Biomed optical microscope with 400× and 1000× magnification. The pollen identification and nomenclature follows Beug (Reference Beug2004). The preservation of the pine grains partially permitted the distinction of Pinus cembra (semicircular form of the sacci and the presence of veruccae on the ventral part of the pollen grain) from Pinus sylvestris/mugo. The non-distinguished grains are included in the pollen type Pinus together with the Pinus sylvestris/mugo type. Although the macrofossils document the presence of Alnus alnobetula in the uppermost part of the sequence, a verification was only possible on individual grains. Therefore, they were summed up in the pollen taxon Alnus. The non-pollen palynomorphs (NPP) were determined on the basis of numerous reference studies listed by Miola (Reference Miola2012). Despite rather poor preservation, two different trilet spores of the Upper Triassic Raibl Group could be identified. They were summarized together with unidentified spores in the category “trilet pre-Quaternary spores.”
In view of the general climatic situation during MIS 4–3, the growth of thermophilous trees and shrubs in the Inn Valley seems highly unlikely but not impossible. Input by long-distance transport is also unlikely, because at that time such tree species were growing only rarely on the southern slopes of the Alps. The possibility of melting out from glaciers may be negligible due to much lower pollen productivity and reduced pollen transport compared to the present-day (Festi et al., Reference Festi, Kofler, Bucher, Carturan, Mair, Gabrielli and Oeggl2015). Therefore, while their origin is uncertain, the pollen grains of Tilia, Ulmus, Fagus, and Corylus were included in the pollen sum. The “Indeterminanda” may include several reworked and redeposited sporomorphs. Various extinct Pinaceae originated from the Late Pliocene and/or the Earliest Pleistocene (Draxler, I., personal communication, 2016). Within the trilet pre-Quaternary spores, two types could be distinguished: Trilites tuberculiformis (Cookson, Reference Cookson1947) frequent in the Upper Triassic, and Paraconcavisporites sp. with a wider stratigraphic range, but also present in the Upper Triassic (Draxler, I., personal communication, 2016). The number of reworked microfossils may be higher than presented in the results. Identification was generally difficult and the criteria “degree of compression” and “surface abrasion” (Pini et al., Reference Pini, Ravazzi and Donegana2009) were not applicable due to generally poor preservation (except for Pinus).
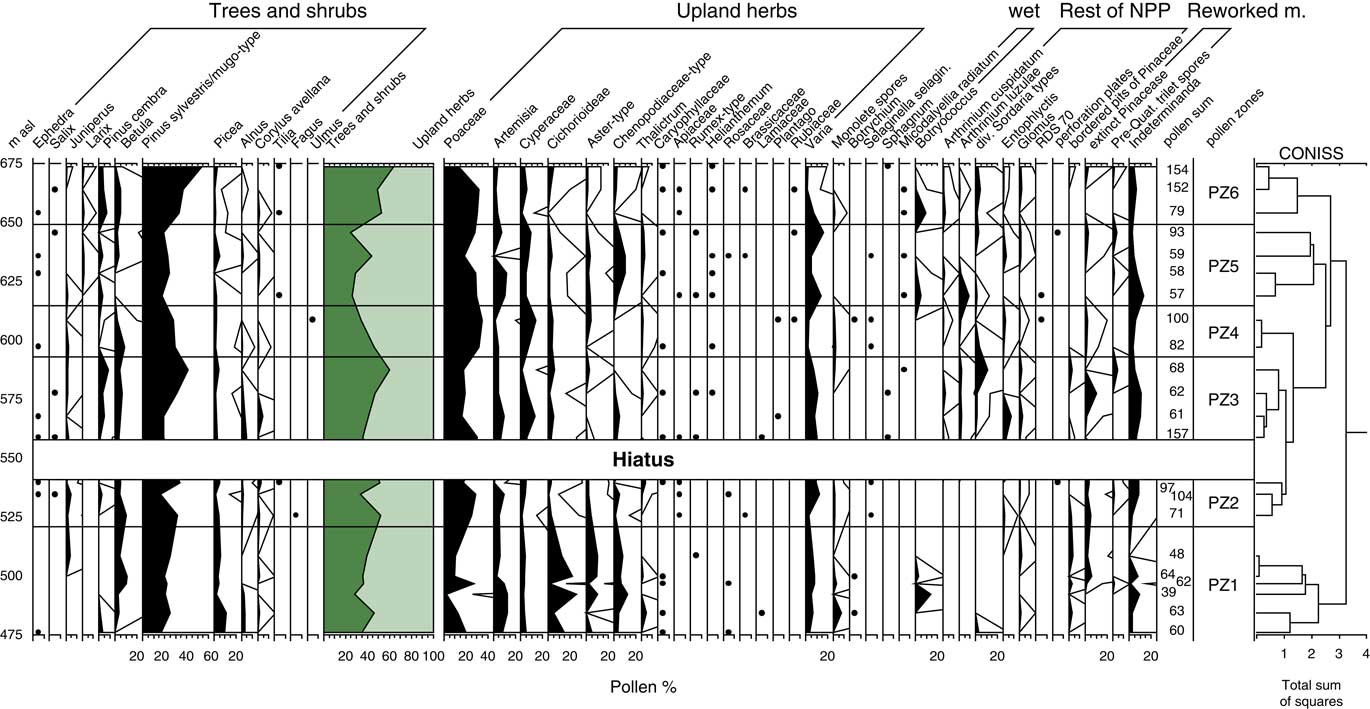
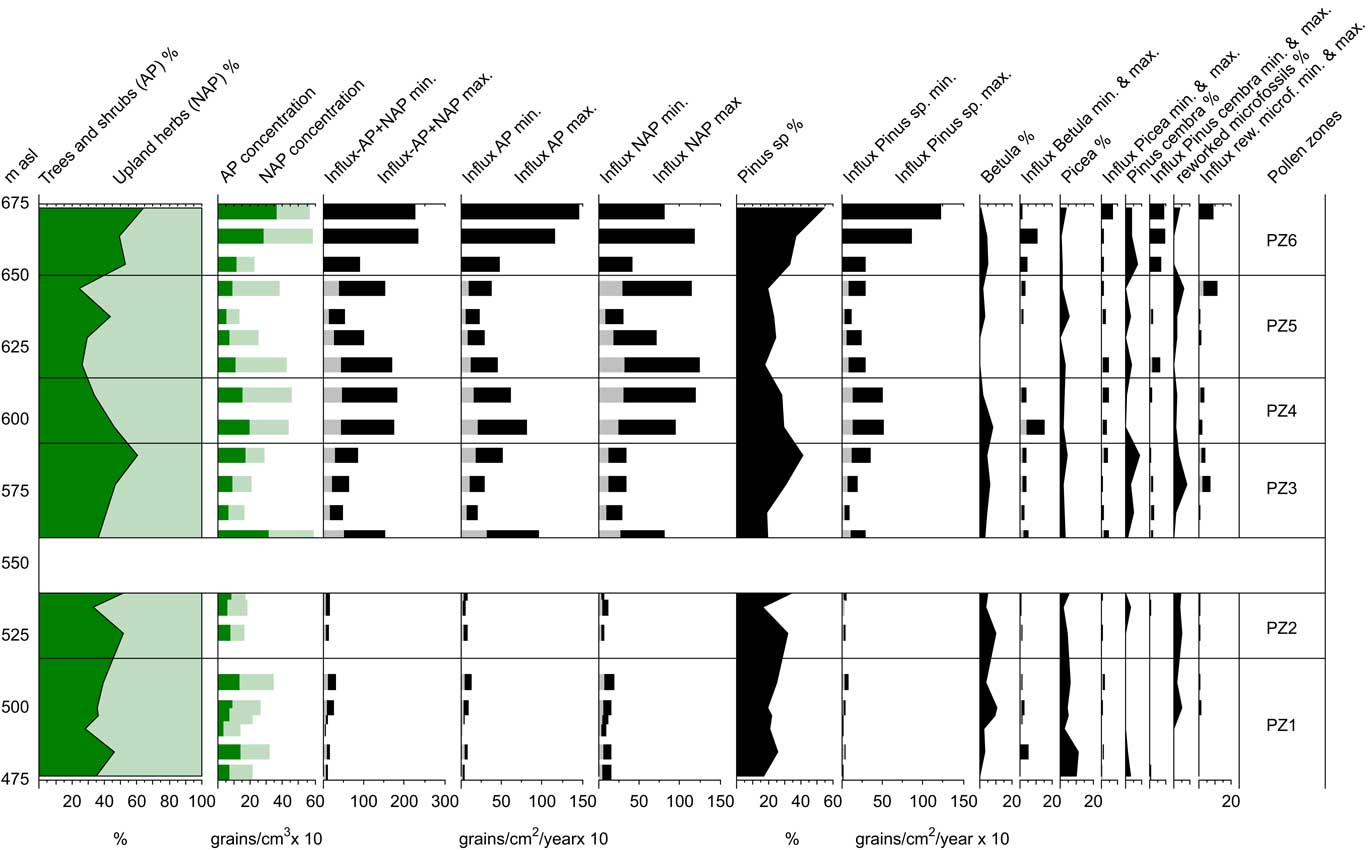
The results of the analysis are presented as a reduced percentage diagram (Fig. 3) and a reduced concentration and influx diagram (Fig. 4). The pollen sum includes all pollen grains of trees, shrubs, and upland herbs (arboreal pollen [AP] + non-arboreal pollen [NAP]=100%) except extinct Pinaceae and pre-Quaternary spores (pollen sum+all reworked microfossils). The values for Pteridophyta and mosses were determined on the basis of the pollen sum (i.e., AP + NAP) plus Pteridophyta and mosses, and those of the NPPs as percentages of the pollen sum plus NPP.
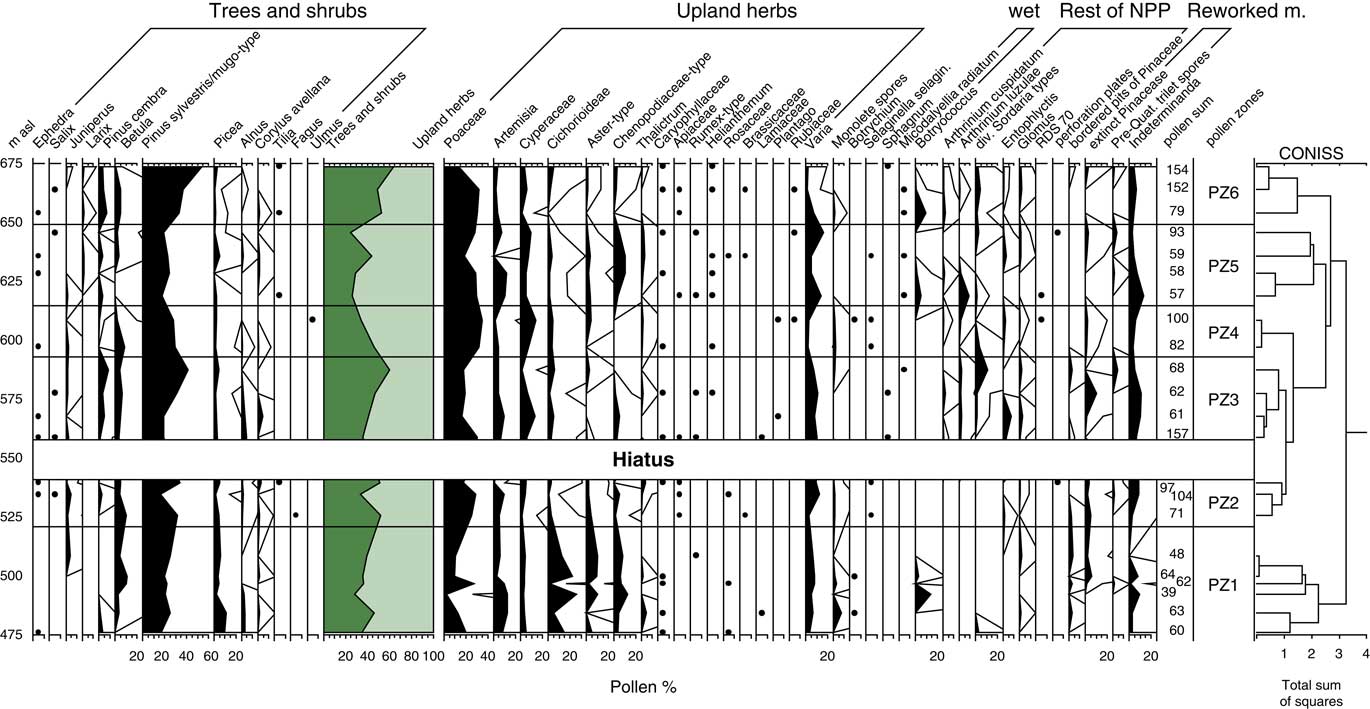
(color online) Pollen percentage diagram showing the most important taxa. The results of the statistical clustering analysis (CONISS) and the associated pollen zone interpretations are shown along with the pollen sums. Black lines indicate percentages multiplied by 10. Black dots indicate values less than 2%.
(color online) Pollen diagram showing percentages, concentrations, and influx of the most important taxa.
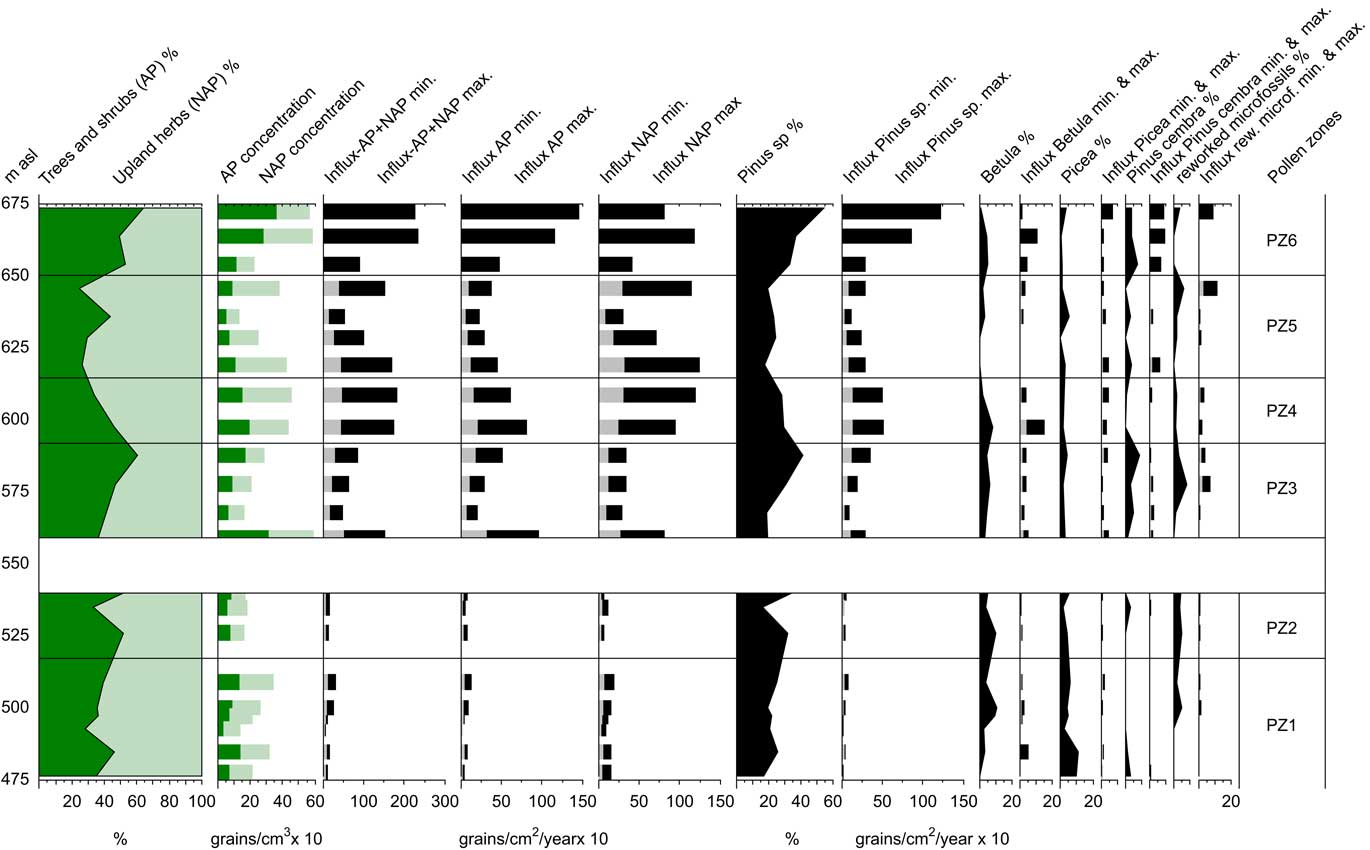
The pollen influx rate (grains/cm2/yr) was calculated on the basis of the sedimentation rate estimates. The degree of scatter and inherently large uncertainties of the luminescence ages (see Barrett et al., Reference Barrett, Starnberger, Tjallingii, Brauer and Spötl2017) did not permit the use of a Bayesian age-modelling approach (e.g., attempts using Bacon [Blaauw and Christen, Reference Blaauw and Christen2011] yielded unsatisfactory results). Therefore, beyond the short interval of the available radiocarbon chronology where a linear regression age model was used, an age model considering only the upper and lower bounds was produced based on the luminescence ages and the spacing of possible annual layers (for details, see Barrett, Reference Barrett2017; Barrett et al., Reference Barrett, Starnberger, Tjallingii, Brauer and Spötl2017). This model (Fig. 2) was used to calculate generous maximum and minimum sedimentation rate estimates, which resulted in maximum and minimum pollen influx rates (Fig. 4). As the rates were estimated based on sedimentological assumptions (i.e., lack of hidden hiatuses and the nature of the presumed annual layers), these influx rates should be treated with caution.
The pollen percentage, concentration, and influx diagrams were created using TILIA and TILIA.GRAPH version 2.0.33 (Grimm, Reference Grimm2014). The division of six pollen zones in Figures 2–4 were established according to a stratigraphically constrained incremental sum of squares clustering method (CONISS; Grimm Reference Grimm1987) using percentage data for all trees, shrubs, and upland herbs. The zone division was identical when the analysis was repeated with data below 5% excluded. The concentration and influx data are shown for certain taxa only (Fig. 4).
RESULTS
The results of the pollen analysis are shown in Figures 3 and 4 (percentages and concentrations and influx, respectively). As expected, the pollen content in the slides is very low and preservation, as noted by Bortenschlager and Bortenschlager (Reference Bortenschlager and Bortenschlager1978), is poor. Pollen grains of herbs are often small and distorted. Since they are also flattened, identification was not always possible. The values of “Varia” (unknown pollen grains) and “Indeterminanda” (damaged and therefore indeterminable pollen grains) are hence slightly higher than is usual in late glacial or Holocene lake sediments. In general, only the pollen of Pinus (pine) and Picea (spruce), although often fragmented, lacks strong corrosion and is hence well recognizable.
Given the low pollen sums, the percentage estimates of pollen abundances below 5% are not statistically significant. Nevertheless, it is essential to include rare or generally underrepresented species (e.g., Larix, Ephedra, Pinus cembra, and various herb species) due to the important climatic information they provide. Excluding species with abundances below 5% has no significant effect on the pollen curves of more abundant species or on the division of the different pollen zones.
The overall pollen profile is dominated by Pinus (mainly P. sylvestris/mugo type), but its proportion remains below 50% with one exception (676 m asl). Picea was found in almost every horizon. The curves of Pinus cembra, Betula, and Juniperus are patchy, while Ephedra, Hippophae, Salix, and Larix occur only sporadically. Species demanding a more favorable climate such as Alnus, Corylus, Tilia, Ulmus, and Fagus occur irregularly and show no obvious pattern.
PZ1 and 2: 476–540 m asl (base ca. 71–83 ka; top ca. 54–61 ka)
Based on the cluster analysis (Grimm, Reference Grimm1987), the lower part of the sequence is divided into two pollen zones. The pollen sum in both PZ1 (476–508 m asl) and 2 (508–540 m asl) is low (39–100 grains), causing highly fluctuating pollen percentage values. On the other hand, the pollen concentration is relatively high in PZ1 (varying between ca. 150 and 350 grains/cm2) and quite low (ca. 150 grains/cm2) in PZ2.
Pinus dominates and is present throughout PZ1 and 2 with percentages up to 34%. Relatively high values of Picea (up to 13%) are recorded in the lower PZ1, whereas Betula and Juniperus are more common in PZ1 and 2. Pinus cembra and Ephedra are found irregularly or rarely. Moreover, Poaceae are represented in PZ2. Cichorioideae, Chenopodiaceae, and Aster-type are more frequent in upper PZ1 and Artemisia in lower PZ1. Among the Pteridophyta, monolete spores, Botrychium, and Selaginella selaginoides were found. The continuous presence of the extinct Pinaceae and Glomus in upper PZ1 and Anthrenus (museum and cabinet beetles) in the lower part of PZ1 is remarkable. The sum of the reworked microfossils is mostly higher than 5%.
Single microfossils not indicated in the pollen diagram are: Plantago alpina-type and Geranium in PZ1 and Fagus, Ranunculaceae, and Mentha-type in PZ2.
PZ3: 559.5–593 m asl (base ca. 46–41 ka)
The pollen concentration (ca. 160–300 grains/cm3) is relatively low with the exception of level 559.5 m asl. This is also true for the pollen-influx values (varying between 160 and 1500 grains/cm²/yr), but they are less reliable due to uncertainties in the chronology.
The AP rise up to 60% with Pinus dominating and Betula, Juniperus, and Picea present. Corylus and Alnus are considered reworked. Poaceae show relatively low values, and Cyperaceae are more frequent than in PZ1 and 2. Arthrinium luzulae, Arthrinium cuspidatum, and Glomus are present on a more or less regular basis. The sum of the reworked microfossils is amongst the highest in the record.
Single microfossils not represented in the diagram are Galeopsis-type and Lamiaceae.
PZ4: 593–625 m asl (base ca. 41–38 ka)
The pollen concentration (ca. 440 grains/cm3 throughout) and the total influx (between 500 and 1800 grains/cm²/yr) are relatively high. AP range from 30 to 50% and are dominated by Pinus. Poaceae show high percentages causing the decrease in pine, while Chenopodiaceae are absent. Some Selaginella, few Botryococcus, and RDS 70 (Drescher-Schneider, Reference Drescher-Schneider2008; Huber et al., Reference Huber, Weckström, Drescher-Schneider, Knoll, Schmidt and Schmidt2010) are present. The single microfossil not represented in the diagram is Ulmus.
PZ5: 625–650 m asl (base ca. 38–37 ka)
The pollen concentration (130–380 grains/cm3) and total influx (between 130 and 1500 grains/cm²/yr) are low. AP vary between 25 and 40% and are dominated by Pinus. Betula is nearly absent and Poaceae show rather low percentages. On the other hand, Chenopodiaceae, together with Helianthemum, Artemisia, Thalictrum, Ephedra, Larix, as well as Pre-Quaternary spores, reach maximum abundance values.
PZ6: 650– 676 m asl (base ca. 35 ka)
The pollen concentration (nearly 600 grains/cm2) and influx (up to 2300 grains /cm²/yr) are the highest (and the most reliable due to the well constrained chronology). AP increase slightly up to 65%. Pinus dominates and Pinus cembra is constantly present. Poaceae shows relatively high values, Botryoccocus is present, and the pre-Quaternary sporomorphs are mostly absent. Single pollen grains and spores not represented in the diagram are Centaurea montana, Ericaceae, Gentianaceae, Pediastrum, Microtyrium, Ustulina deuste, and HdV 200.
DISCUSSION
Given the limited information about the lake extent, paleogeography, and position and extent of upstream glaciers, the pollen origin and potential floating time are not well-constrained. Consequently, a high “pollen noise” with limited information about changes in climate and vegetation is to be expected. However, the analysis of an 84-cm-long sediment section with 117 individual laminae (corresponding to PZ6 of the present study) made evident that sediment layers with higher pollen concentrations (in favorable cases, seasonal pollen deposition) alternate with layers showing fewer pollen grains (Bortenschlager and Bortenschlager, Reference Bortenschlager and Bortenschlager1978). On this basis, Bortenschlager and Bortenschlager (Reference Bortenschlager and Bortenschlager1978) concluded that sediment deposition occurred mainly in summer and ceased during winter, most probably due to freezing of the lake surface. The ability to identify seasonal pollen deposition refutes long floating periods. The uniformity of the sediments between 550 and 676 m asl (PZ3–6) suggests that the sedimentation regime did not change fundamentally. Hence, this seasonal pollen input likely also applied to the rest of the upper lake phase (LP2). The sediments of the lower lake phase (PZ1 and 2), however, are somewhat different (most notably the lower sedimentation rate), and thus the implications following from the analysis of Bortenschlager and Bortenschlager (Reference Bortenschlager and Bortenschlager1978) are less likely to apply there.
Vegetation development based on pollen percentages and concentrations
Throughout the profile, the total AP percentage never reaches more than 65%. Different boundaries as to what is considered forest-free vegetation are given in the literature and vary from <45–55% (Burga, Reference Burga1984) to <70–80% (Bortenschlager, Reference Bortenschlager1972). Given that the majority of AP is from Pinus, the pollen production of which is about four times that of Fagus and double that of Betula, we consider the vegetation to be forest-free, but not free of trees throughout the profile. This interpretation is confirmed by pollen grains of herbs. The abundant grasses, sedges, Helianthemum, Thalictrum, and Centaurea montana suggest an open and light-demanding vegetation. Furthermore, Artemisia and especially Chenopodiaceae are indicative of steppe vegetation.
In PZ1 and 2, the low pollen sum giving rise to fluctuating percentages, frequently interrupted pollen curves, and the especially poor pollen preservation preclude a detailed interpretation. The possible hiatus (tentatively inferred from the chronology) between 496 and 506 m asl is not clearly indicated in the pollen curves. There are some small changes within this range, however: Betula increases, Artemisia decreases, and Juniperus and extinct Pinaceae start. Betula, Cichorioideae, and Aster-type, and the algae Botryoccocus together with relatively high concentrations of upland herbs in upper PZ1 might reflect relatively humid conditions. While Artemisia and pollen of mesophilic trees are slightly more abundant, the maxima of Glomus and extinct Pinaceae suggest a period of enhanced sediment and soil erosion due to drier conditions during PZ2. It is likely that the “bordered pits” are also reworked.
Although the pollen percentages in PZ3 do not differ substantially from PZ1 and 2, the first evidence of some microfossils of low (i.e., local) dispersal are worth mentioning: Arthrinium luzulae (saprophyte on Luzula) and Arthrinium cuspidatum (living symbiotically with Juncus; Scheuer, Reference Scheuer1996). Nevertheless, some moist-preferring inhabitants must have existed, because Entophlyctis (HdV 13; van Geel, Reference Geel1976; Kuhry, Reference Kuhry1985) is a sign of nearby Scheuchzeria palustris bogs. The low pollen concentration, the relatively high values of Chenopodiaceae, Artemisia, and reworked types suggest a cold and rather dry climate with enhanced soil and sediment erosion.
The decrease of AP, mainly Pinus, in PZ5 is partly caused by the spread of Poaceae and Cyperaceae. Chenopodiaceae are nearly absent and the values of reworked microfossils are low. Together with a pollen concentration more than twice as high as before, this zone reflects a period of temperate, and probably rather humid, conditions with better-developed vegetation in a still woodless landscape. The small pollen proportion of woody species in PZ5 is accompanied by relatively low pollen concentrations, abundant grasses and Cyperaceae, and especially Chenopodiaceae, Helianthemum, and Ephedra: signs of a rocky semidesert. The occurrence of pre-Quaternary forms supports the interpretation of this zone as a cold period with moderate to low vegetation cover and a high input of eroded material. PZ5 represents the coldest and driest period of the PZ3–6 sequence.
Zone PZ6 shows a continuous increase in AP, Pinus rises, Betula and Pinus cembra are regularly above 1%, and Larix and Salix are also present. By contrast, reworked types are almost absent. This pollen zone corresponds to the previously studied part of the sequence, which contained a number of woody macro fossils (Fliri et al., Reference Fliri, Hirscher and Markgraf1971, Reference Fliri, Felber and Hilscher1972). Most remains were fragments of Pinus mugo, Pinus sylvestris, Alnus alnobetula, Hippophae rhamnoides, and Salix, including a leaf of Dryas octopetala (Supplementary Table 1). Their good state of preservation argues against a long-distance transport or reworking from older sediments. It is more likely that these remains were transported to the lake by either local creeks or avalanches from the northern shore. Unfortunately, the new cores lack wood fragments throughout PZ6. The only clues to the presence of trees are increasing Pinus percentages and concentrations and Ustulina deusta, a dangerous parasite on the roots of deciduous trees such as Betula (van Geel and Andersen, Reference Geel and Andersen1988; Brandstetter, Reference Brandstetter2007). High counts of Poaceae, Caryophyllaceae, Apiaceae, Centaurea montana, and Gentianaceae are indicators of a mostly closed vegetation cover. This was the warmest and most humid period of the complete sequence with more frequent stands of Pinus, Betula, Pinus cembra, Larix, and dwarf shrubs like Salix and Dryas octopetala in a non-forested landscape.
Vegetation development on the basis of pollen concentration and influx
Pollen-concentration values are influenced by various parameters including sediment type and composition, sedimentation rate, mode of deposition, presence or absence of high pollen producers, and changes in vegetation cover and structure (Lotter, Reference Lotter1985). Nevertheless, a comparison of percentage and concentration data assists in interpreting the vegetation development.
In the studied core (Fig. 4), the pollen concentration does not change significantly throughout the whole sequence. Nevertheless, the general trend of low concentrations is interrupted by two intervals of somewhat higher pollen content (PZ4 and 6).
In PZ1, concentration values vary between 160 and 343 grains/cm3. PZ2, with ca. 160 grains/cm2, is similar to PZ3 (with the exception of level 559.5 m, reaching 590 grains/cm3) and the middle part of PZ5. Concentrations of ca. 440 grains/cm3 dominate in PZ4, and about 570 grains/cm3 are present in the two uppermost levels of PZ6. Even though the difference between PZ4 and 6, on one hand, and PZ1–3 and PZ5, on the other, is small, assuming no fundamental changes in the sedimentation regime, a trend towards denser vegetation cover and slightly more frequent tree stands is visible for PZ4 and 6. Pollen-abundance values in general are very low but confirm the observations by Bortenschlager and Bortenschlager (Reference Bortenschlager and Bortenschlager1978). They are also comparable to those of stadial sections at Unterangerberg 40 km downstream in the Inn Valley (Starnberger et al., Reference Starnberger, Drescher-Schneider, Reitner, Rodnight, Reimer and Spötl2013a) and to LGM deposits from the peri-alpine site Renče (western Slovenia; <250 grains/cm3; Monegato et al. Reference Monegato, Ravazzi, Culiberg, Pini, Bavec, Calderoni, Jež and Perego2015). These values are many times lower than those in samples of the pre-Eemian glacial sediments from Niederweningen (northern Switzerland; Dehnert et al., Reference Dehnert, Lowick, Preusser, Anselmetti, Drescher-Schneider, Graf and Heller2012) or LGM samples from the Oglio area (Ravazzi et al., Reference Ravazzi, Badino, Marsetti, Patera and Reimer2012) and Lake Garda (Ravazzi et al., Reference Ravazzi, Pini, Badino, De Amicis, Londeix and Reimer2014), or the MIS 3 sediments at Azzano Decimo (all Italy; Pini et al., Reference Pini, Ravazzi and Donegana2009) with up to 50,000 grains/cm3 during stadials and more than 250,000 grains/cm3 during interstadials. They are even lower than those of the non-forested Tulppia interstadial in Finland (Bos et al., Reference Bos, Helmens, Bohncke, Seppä and Birks2009) and late glacial lake sediments in the Alps prior to afforestation (Bortenschlager and Bortenschlager, Reference Bortenschlager and Bortenschlager1978; Ammann, Reference Ammann1984; Lotter, Reference Lotter1985). The most likely explanation for the low pollen concentrations at Baumkirchen, as well as at Unterangerberg and Renče, is the high sedimentation rate of these paleolakes. The record of Niederweningen, showing comparable sedimentation rates in the oldest pre-Eemian section, is characterized by a high amount of reworked pollen types significantly increasing the total pollen concentration. On the other hand, Azzano Decimo is situated in a glacial refuge area of spruce and many deciduous tree species, due to increased humidity south of the Alps at that time (Florineth and Schlüchter, Reference Florineth and Schlüchter2000; Pini et al., Reference Pini, Ravazzi and Reimer2010). Furthermore, the late glacial sequences were deposited in lake sediments of significantly lower sedimentation rates, leading to higher pollen concentrations.
A more reliable measure of vegetation density and composition is given by the influx values, i.e., the number of pollen grains embedded per cm² and yr. This, however, requires reliable sedimentation rate estimates (e.g., Berglund and Ralska-Jasiewiczowa, Reference Berglund and Ralska-Jasiewiczowa1986). At Baumkirchen, sedimentation rates are not precisely known. Therefore, the influx values are given as range (minimum and maximum) and provide a general trend only.
The pollen influx in PZ1 and 2, reaching values between 40 and 308 grains /cm²/yr, is least reliable due to the highly uncertain sedimentation rate. In the other two cold-climate pollen zones (PZ3 and 5), the influx was about four times higher than in PZ1 and 2. The rate of pollen deposition in the more temperate zones (PZ4 and 6) was about twice as high as in PZ3 and 5.
Due to the highly uncertain sedimentation rates below the hiatus (LP1: PZ1 and 2), the pollen content of PZ1 and 2 will not be further discussed. Even though the calculation of pollen influx in PZ3–5 remains tentative, it is better constrained than in the older sediments. In circum-Alpine pollen records of the same time window as Baumkirchen, pollen influx values are generally not available due to the absence of a robust chronology. Values representing pollen sedimentation rates during non-forested late glacial periods are also rare. Bortenschlager (Reference Bortenschlager1984) estimated as few as 100 grains/cm²/y in sediments older than 13,980±240 14C yr BP at Lanser See (15 km west of Baumkirchen). Similar values (270–620 grains/cm²/yr) were calculated in clayey sediments older than 13,300 14C yr BP at Lobsigensee, Switzerland (Ammann, Reference Ammann1989). Both influx estimates are comparable with PZ3 and 5 at Baumkirchen. Although it is possible that the Pinus grains reflect long-distance transport from south of the Alps (as also assumed for Lanser See), it is unlikely that the Inn Valley was totally devoid of trees during PZ2 and 5. Pinus and Betula may have survived in small scattered stands in climatically favorable habitats.
Concerning the two more temperate pollen zones, the pollen accumulation rates reach 1806 grains/cm²/y in PZ4 and 2300 grains/cm²/y in PZ6, similar to values found during the dwarf-shrub period before the Juniperus zone at both Lobsigensee (Ammann, Reference Ammann1989) and Lanser See (Bortenschlager, Reference Bortenschlager1984). Furthermore, we compared our data to two deposits of Younger Dryas age in Switzerland (Wick, Reference Wick2000). At Gerzensee (central Switzerland, 603 m asl), pine forests changed little between the Allerød and the Younger Dryas, with only birch trees largely disappearing. The total influx (AP + NAP) during the climatically unfavorable period at Gerzensee was about 6000–7000 grains/cm²/y. The second location is Leysin in the Swiss Prealps (1230 m asl), which, although located above the timberline during the Younger Dryas, was not completely free of trees. In these sediments, the total influx varied between 1000 and 2000 grains/cm²/y.
Beside the higher pollen influx rates in PZ6, the vegetation development is different in PZ4 compared to PZ6. The influx of Pinus increases weakly from 350 to 510 grains/cm²/y while upland herbs rise steadily within PZ4 (from 340 to 1900 g/cm²/y). We conclude that the tree population increased slightly due to higher humidity and probably also higher temperatures, but that the climate (and possibly the brief time span) did not permit a greater spread of trees. The steadily increasing herbs coincided with a rising variety and density of vegetation resulting in well-developed, but still not completely closed, grassland. In PZ6, however, the pollen curves indicate a different succession: the increase in the influx values is manly caused by Pinus, Betula, and Pinus cembra. Considering both the pollen information from this study as well as the earlier woody macro fossil finds, we infer interstadial conditions and small tree-stands on the lakeshore and in other favorable locations represented by woody species such as Pinus sylvestris, Pinus mugo, Pinus cembra, and the strongly under-represented Larix as well as by the shrubs Alnus alnobetula, Hippophae, Juniperus, Salix, and Dryas octopetala. Because the lacustrine Baumkirchen sequence continues for another 50 m upsection (up to 725 m asl) PZ6 may mark only the onset of a more pronounced interstadial.
Provided that the sedimentation rate estimates are broadly accurate, the interpretation of the percentage record is confirmed for the most part by the pollen influx rates. Moreover, these data allow us to refine the differences between the individual pollen zones and clarify the vegetation development and corresponding climate conditions.
The Baumkirchen pollen record in the context of other Alpine and extra Alpine records
The Baumkirchen pollen zones PZ3–6 span from ca. 45 to ca. 35 ka (i.e., mid- to late MIS 3), a period characterized by centennial- to millennial-scale Dansgaard-Oeschger oscillations. This closely corresponds to a period of occupation of caves by cave bear in the lower Inn Valley (Spötl et al., Reference Spötl, Reimer, Rabeder and Scholz2014). Palynological investigations of long sedimentary MIS 3 and 4 sequences from the Alps, especially those with robust chronologies, are restricted to the foreland (Füramoos, Müller et al., Reference Müller, Pross and Bibus2003; Azzano Decimo, Pini et al., Reference Pini, Ravazzi and Donegana2009; Fimòn, Pini et al., Reference Pini, Ravazzi and Reimer2010). Shorter sequences are known from Gossau (Switzerland; ca. 45–54 ka; Schlüchter et al., Reference Schlüchter, Maisch, Suter, Fitze, Keller, Burga and Wynistorf1987; Preusser, Reference Preusser1999), Niederweningen (ca. 45 ka; Drescher-Schneider et al., Reference Drescher-Schneider, Jacquat and Schoch2007), and Unterangerberg (ca. 40–75/85 ka; Starnberger et al., Reference Starnberger, Drescher-Schneider, Reitner, Rodnight, Reimer and Spötl2013a, Reference Starnberger, Rodnight and Spötl2013b), the latter also being located in the Inn Valley. The vegetation pattern of the different MIS 3 interstadials in these Alpine records is still poorly chronologically constrained and thus difficult to correlate. Furthermore, the Unterangerberg and the Füramoos records both contain hiatuses from ca. 40–45 ka onwards and thus lack sediments of late MIS 3 age. Baumkirchen therefore contributes a valuable piece to the Middle Würmian puzzle.
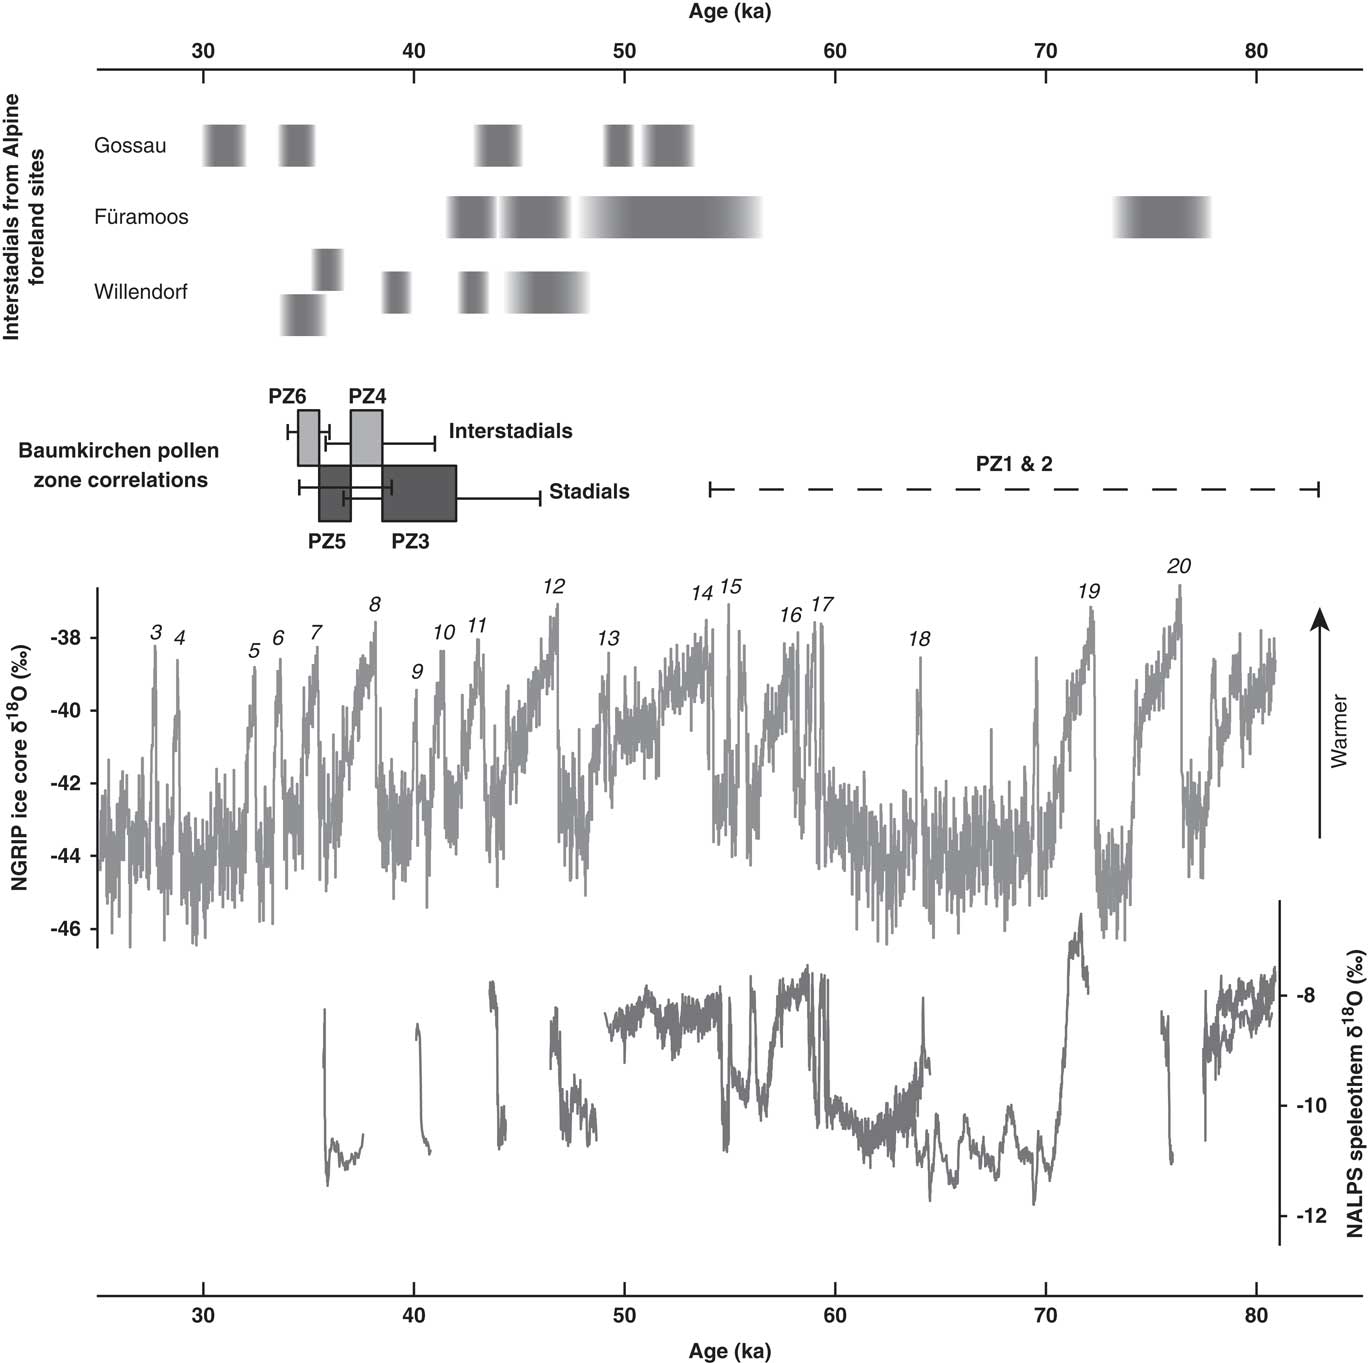
The section corresponding to the interstadial pollen zone PZ6 at Baumkirchen is well-dated to ca. 35 ka by multiple luminescence and radiocarbon dates (Spötl et al., Reference Spötl, Reimer, Starnberger and Reimer2013; Barrett et al., Reference Barrett, Starnberger, Tjallingii, Brauer and Spötl2017), corresponding to Greenland Interstadial (GI) 7 (Fig. 5). Due to the generally poor age control of Alpine foreland sites, this is therefore the first firm correlation between an Alpine pollen record and a Greenland interstadial. On this basis, a tentative correlation can be made to the PZ6 interstadial of the Gossau section (Preusser et al., Reference Preusser, Geyh and Schlüchter2003) and the Schallenbach II or III interstadial at the loess section of Willendorf (Lower Austria; Nigst et al., Reference Nigst, Haesaerts, Damblon, Frank-Fellner, Mallol, Viola, Götzinger, Niven, Trnka and Hublin2014).
Comparison of Baumkirchen pollen zone age ranges with interstadials from Alpine foreland sites Füramoos (Müller et al., Reference Müller, Pross and Bibus2003), Gossau (Preusser et al., Reference Preusser, Geyh and Schlüchter2003), and Willendorf (Nigst et. al., 2014); the NGRIP δ18O temperature-proxy record with interstadials numbered (GICC05modelext time scale; Seierstad et al., Reference Seierstad, Abbott, Bigler, Blunier, Bourne, Brook and Buchardt2014; Rasmussen et al., Reference Rasmussen, Bigler, Blockley, Blunier, Buchardt, Clausen and Cvijanovic2014); and the NALPS speleothem δ18O record (Boch et al., Reference Boch, Cheng, Spötl, Edwards, Wang and Häuselmann2011; Moseley et al., Reference Moseley, Spötl, Svensson, Cheng, Brandstätter and Edwards2014). For the Baumkirchen pollen zones, shaded boxes show the correlations based on the chronology and comparison of pollen results to the Greenland ice-core record, and whiskers show the full possible age range based on the chronology alone. For the interstadials from foreland sites, the faded bars schematically represent age/correlation uncertainties.
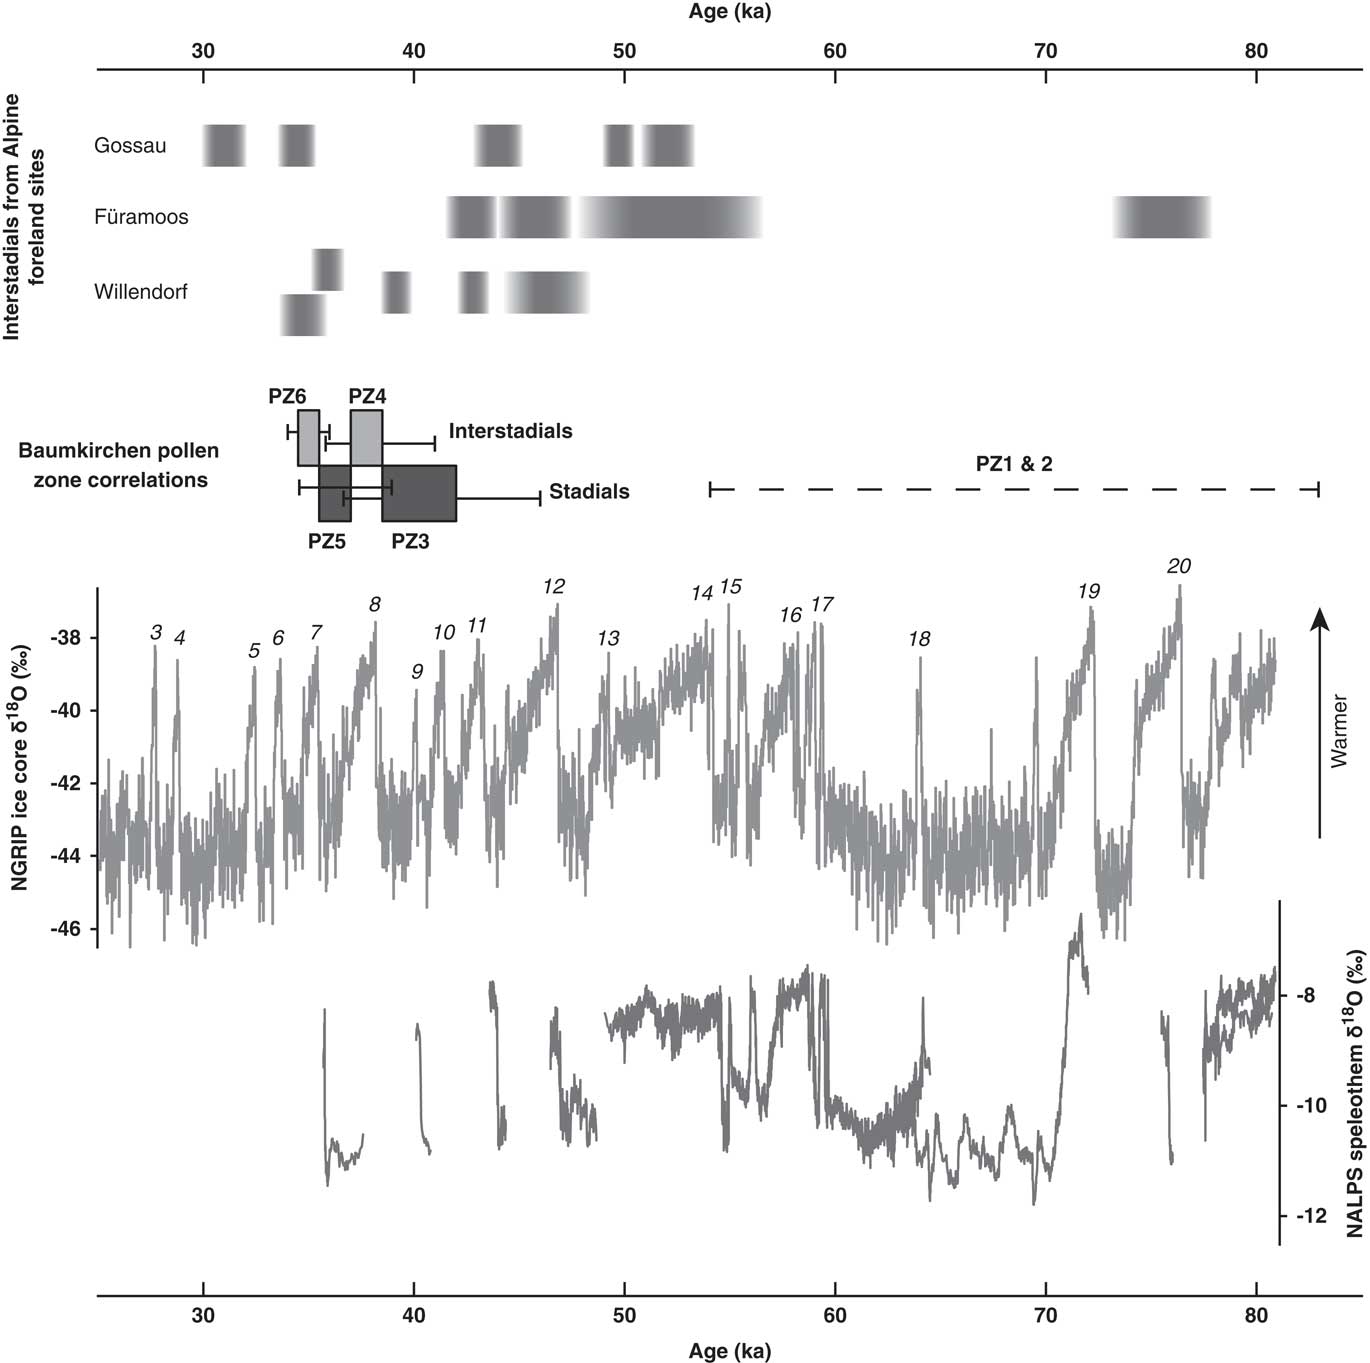
The onset of PZ4 is less well-constrained by luminescence dating to ca. 37–41 ka probably corresponding to GI 8. In Greenland, this interstadial was longer than GI 7 and one would expect a vegetation pattern in Baumkirchen somewhat more developed than during GI 7. Therefore, this correlation remains tentative. On the basis of the chronology, this interval may correspond to Schallenbach Ib in the Willendorf loess section (Nigst et al., Reference Nigst, Haesaerts, Damblon, Frank-Fellner, Mallol, Viola, Götzinger, Niven, Trnka and Hublin2014). The correlations of PZ6 and 4 to GI 7 and 8, respectively, and PZ5 and 3 to the respective neighboring stadials, based on the chronology and pollen data, are shown in Figure 5.
Comparison to and correlation with extra-Alpine late MIS 3 (ca. 45–35 ka) records again relies on reliable independent chronologies. With a few exceptions, however, well-dated sequences are only available from southern Europe where better climatic conditions prevailed: GI 7–9 (probably corresponding to Baumkirchen PZ6 and 4) were generally characterized by open forests (Fletcher et al., Reference Fletcher, Sánchez Goñi, Allen, Cheddadi, Combourieu-Nebout, Huntley and Lawson2010). On the contrary, a dominance of Poaceae, a peak in Betula, and increased Pinus are reported for the Charbon warm period at La Grande Pile (France; ca. 40 14C yr BP; Helmens, Reference Helmens2014), interpreted as an increased expansion or blossoming of wood-stands or shrubs in a still open environment (de Beaulieu and Reille, Reference de Beaulieu and Reille1992). Moreover, an interstadial with increased presence of Pinus (±60%) and Larix occurs at the top of the Horoski Duźe sequence (Poland). Its chronostratigraphic position, however, is unclear and two interpretations were discussed (Helmens, Reference Helmens2014), a correlation with Denekamp (ca. 30 ka, a controversial interstadial, see Litt et al., Reference Litt, Behre, Meyer, Stephan and Wansa2007) or with Oerel (ca. 55 ka).
The age of the base of PZ1 and 2 is assumed to range between 75 and 85 ka (Fig. 5), a period at the end of the Early Würmian that possibly includes the interstadials during MIS 5a followed by the transition to the severe climatic deterioration of MIS 4. If this assumption is correct, the warmer interstadial conditions should be reflected in the lowermost horizons by higher percentages and influx of spruce, pine, and larch. As discussed above, however, the pollen record reflects very scarce vegetation and no evidence of former forests. Müller (Reference Müller2001) reported evidence of two interstadials in the Füramoos record, which he correlates to GI 20 (Dürnten) and 21 (Odderade) followed by a distinct, treeless stadial correlated to MIS 4. We therefore find it most plausible to assign PZ1 and 2 to MIS 4. Given the age uncertainties and lack of bounding pollen zones, it is not clear whether PZ1 and 2 represent the entire MIS 4 or only part of it. Therefore, no strong correlation is suggested in Figure 5.
CONCLUSIONS
Despite the very low pollen concentrations, the analysis performed on new core material from the Baumkirchen stratotype provides important new insights into the vegetation inside the Alps during the last glacial cycle prior to the LGM. These data are confirmed by pollen-influx data calculated from sediment accumulation rates based on new radiocarbon and luminescence dates. As a result, five climatic episodes could be established:
(1) An interstadial (PZ6) at around 35 cal ka BP, which is regarded as the equivalent of GI 7. This zone, which is the best developed in the sequence, is characterized by poorly developed forest stands. Pinus sylvestris, P. mugo, Alnus alnobetula, Salix, Hippophae, and Dryas octopetala are known from earlier wood finds, and in addition P. cembra, Juniperus, and Larix are documented by their pollen. This indicates relatively warm and humid conditions compared to the rest of the sequence.
(2) Framed by two cooler and drier phases (PZ5 and 3) of low pollen influx and open but not treeless vegetation, an older interstadial (PZ4) is recorded between ca. 593 and 625 m asl It differs from PZ6 by showing fewer tree stands and widespread, well-developed grassland.
(3) Based on the position below PZ6 and the presumed age of the lower boundary (ca. 41–38 cal ka BP), PZ4 may be an equivalent of GI 8 (ca. 37–38 cal ka BP). This correlation remains uncertain, because in Greenland GI 8 was longer and possibly warmer than GI 7 and one would thus expect richer vegetation and more widespread tree stands at Baumkirchen.
(4) The lowest section (PZ1 and 2) represents a period of extremely cold and dry conditions and, consequently, a treeless landscape with only a scattered vegetation cover. On the basis of the vegetation data and the luminescence age control, this interval is correlated to MIS 4.
ACKNOWLEDGMENTS
This research was supported by the Austrian Science Fund (FWF, grant number P24820-B16) and the Austrian Academy of Sciences (ÖAW, grant number 23322). We also thank Helmut Mayrhofer of the Institute of Plant Sciences, Karl-Franzens University of Graz, for access to lab facilities. We further thank two anonymous reviewers and the associate editor for helpful and constructive comments on the manuscript.
Supplementary materials
To view supplementary material for this article, please visit https://doi.org/10.1017/qua.2018.26