Non-technical Summary
Bioturbation (biological mixing of solid particles and bioirrigation of burrows with water and solutes) should promote time averaging, shifting young shells downward into sedimentary increments with older shells and moving older shells upward where they can be mixed with newly produced shells. However, bioturbation is a double-edged sword for shell preservation, and also influences time averaging. On the one hand, bioirrigation of sediments promotes acid-producing reoxidation processes that dissolve carbonate shells; biomixing exhumes shells back into this taphonomically active zone (TAZ) and even up to the sediment–water interface, where they can be reexposed to physical damage and bioerosion, and the physical jostling, especially within siliciclastic sediments, can further damage weakened shells. On the other hand, biomixing can accelerate burial of shells well below the TAZ, advecting them into a sequestration zone faster than permitted by sediment accumulation alone; they achieve a time-out from aggressive disintegration in the TAZ and may become diagenetically stabilized. We assessed these competing effects of bioturbation on the disintegration and time averaging of bivalve shells in a modern-day, open-shelf siliciclastic setting (warm-temperate southern California shelf) relevant to shallow-marine fossil records, using a gradient in wastewater pollution that created conditions of both high and low sediment accumulation and high and low bioturbation, conditions that are beyond the scope and ethics of experimental manipulation. We found that bioturbation ultimately increases the time averaging of skeletal remains on this shelf, even though mixing and disintegration rates covary positively. Sediment (fine-matrix) accumulation remains the first-order control on the scale of time averaging: high rates limit time averaging regardless of bioturbation. However, a decline in bioturbation, either over space or through time (both explored here), also reduces time averaging. The well-documented increase of burrowing depth and intensity over the Phanerozoic, established independently by others, is thus probably associated with a secular increase in time averaging.
Introduction
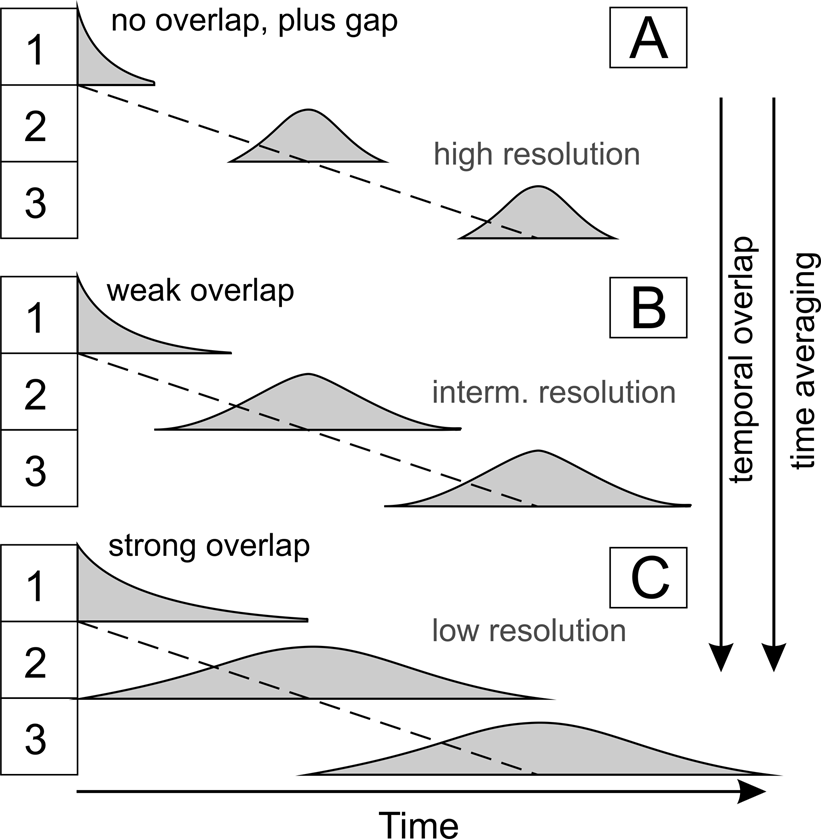
Slow sediment accumulation, low disintegration, and deep sediment mixing by burrowers should each promote strong time averaging of shelly fossil assemblages in stratigraphic increments, which leads to high temporal overlap among assemblages (low temporal distinctness of stratigraphic increments) and significant age offsets between species that co-occur within a given assemblage (Kowalewski Reference Kowalewski1996; Kosnik et al. Reference Kosnik, Hua, Jacobsen, Kaufman and Wüst2007; Tomašových et al. Reference Tomašových, Gallmetzer, Haselmair, Kaufman, Vidović and Zuschin2017, Reference Tomašových, Gallmetzer, Haselmair, Kaufman, Kralj, Cassin, Zonta and Zuschin2018; Ritter et al. Reference Ritter, Erthal, Kosnik, Kowalewski, Coimbra, Caron and Kaufman2023; Fig. 1). Temporal variability in the rates of sediment accumulation, disintegration, and mixing can thus lead to up-section variation in time averaging and temporal distinctness, affecting inferences about the timing and magnitude of paleoecological and paleoceanographic phenomena (Guinasso and Schink Reference Guinasso and Schink1975; Kidwell Reference Kidwell1986; Ridgwell Reference Ridgwell2007; Tomašových et al. Reference Tomašových, Kidwell, Alexander and Kaufman2019b; Hohmann Reference Hohmann2021; Belanger and Bapst Reference Belanger and Bapst2023). Each of these three factors varies temporally and over many scales, from bed to bed, through sequences and phases of basin evolution, and through evolutionary time (Thayer Reference Thayer, Tevesz and McCall1983; Kidwell Reference Kidwell, Allison and Briggs1991; Kidwell and Brenchley Reference Kidwell and Brenchley1994; Holland Reference Holland2000; Patzkowsky and Holland Reference Patzkowsky and Holland2012; Buatois et al. Reference Buatois, Mángano, Desai, Carmona, Burns, Meek and Eglington2022). Bioturbation is one of the key processes of vertical mixing within marine sediments globally, as it can occur at all water depths (Swinbanks and Luternauer Reference Swinbanks and Luternauer1987; Smith Reference Smith, Rowe and Pariente1992; Solan et al. Reference Solan, Ward, White, Hibberd, Cassidy, Schuster, Hale and Godbold2019; Arlinghaus et al. Reference Arlinghaus, Zhang, Wrede, Schrum and Neumann2021; Song et al. Reference Song, Santos, Yu, Wang, Burnett, Bianchi and Dong2022), and in modern seas burrowers can penetrate ≥0.5–1 m below the sediment–water interface (McMurtry et al. Reference McMurtry, Schneider, Colin, Buddemeier and Suchanek1986; Miller and Myrick Reference Miller and Myrick1992; Walbran Reference Walbran1996; Parsons-Hubbard et al. Reference Parsons-Hubbard, Hubbard, Tems, Burkett, Hembree, Platt and Smith2014). Ichnologic evidence for evolution in the depth and intensity of bioturbation by metazoans from the late Precambrian into and over the Phanerozoic (e.g., Larson and Rhoads Reference Larson, Rhoads, Tevesz and McCall1983; Thayer Reference Thayer, Tevesz and McCall1983; Bottjer and Ausich Reference Bottjer and Ausich1986; Droser and Bottjer Reference Droser and Bottjer1989; Tarhan et al. Reference Tarhan, Droser, Planavsky and Johnston2015) thus has potential to produce long-term trends in time averaging and overlap, making it difficult to compare Paleozoic records characterized by shallow bioturbation (and by higher preservation potential of event beds) with Cenozoic records characterized by deep bioturbation (e.g., Sepkoski Reference Sepkoski, Einsele and Seilacher1982; Brandt Reference Brandt1986; Sepkoski et al. Reference Sepkoski, Bambach, Droser, Einsele, Ricken and Seilacher1991; Allison and Briggs Reference Allison and Briggs1993; Kidwell and Brenchley Reference Kidwell and Brenchley1994; Brett Reference Brett1995; Simões et al. Reference Simões, Kowalewski, Torello, Ghilardi and de Mello2000; Orr et al. Reference Orr, Benton and Briggs2003; Seilacher et al. Reference Seilacher, Buatois and Mángano2005; Tarhan and Droser Reference Tarhan and Droser2014; Gougeon et al. Reference Gougeon, Mángano, Buatois, Narbonne and Laing2018). Physical reworking by fair-weather and storm conditions can be important on the shoreface, leading to amalgamated rather than accretionary sand bodies (Willis et al. Reference Willis, Sun and Ainsworth2022), and can be extreme (to 1 m) in exceptional conditions such as the fluid-rich deltaic sediments (e.g., Kuehl et al. Reference Kuehl, DeMaster and Nittrouer1986; Aller Reference Aller2004). However, individual storms today typically remobilize only the uppermost 5–10 cm of seabeds on the open shelf below the shoreface, declining with water depth (e.g., Niedoroda et al. Reference Niedoroda, Swift, Reed and Stull1996; Storms Reference Storms2003; Guillén et al. Reference Guillén, Bourrin, Palanques, De Madron, Puig and Buscail2006; Keen et al. Reference Keen, Slingerland, Bentley, Furukawa, Teague, Dykes, Li, Sherwood and Hill2012). Such increments are thinner than the 10–20 cm reach of modern bulldozing taxa and are far less than that of nonlocal burrowers, but might exceed the reach of bioturbators in Paleozoic environments or in present-day hypoxic conditions.
Three scenarios (A–C) each showing a qualitatively different stratigraphic pattern in time averaging per assemblage (i.e., total or interquartile range of shell ages in an assemblage) and thus in their temporal distinctness, that is, the amount of temporal overlap that exists between postmortem age distributions drawn from adjacent increments. The average ages of assemblages increase downcore in all three scenarios, and the raw temporal spacing of assemblages (defined as the temporal difference between the mean or median ages of adjacent assemblages, i.e., a classic definition of stratigraphic resolution) remains the same among the three scenarios (the dashed lines connect mean ages). In A, the stratigraphically successive assemblages do not overlap in age at all, in fact, gaps occur between assemblages: the record lacks fossils from some intervening intervals of time (x-axis), e.g., either owing to temporarily increased disintegration or temporarily reduced input of dead shells. However, the effective stratigraphic resolution of assemblages decreases in scenarios B and C, where time averaging is higher and indeed exceeds the raw temporal spacing of assemblages (dashed line).

Here, we focus on the net effects of bioturbation, which encompasses many direct and indirect effects on seabeds relevant to time averaging. It promotes both (1) shell mixing (vertical movement of skeletal remains within sediment, moving young shells down and old shells up; mixing also affects biogeochemical processes, which can either increase or decrease rates of shell disintegration) and (2) the irrigation of sediments with oxygenated water (which promotes acidification and shell dissolution as well as microbial maceration). Which of these effects on time averaging wins out? The importance of sediment accumulation on time averaging and between-increment overlap of assemblages is, on the other hand, comparatively well established, notwithstanding low sediment accumulation also being a double-edged sword: lower sediment accumulation means less dilution of shell input by clastic sediment, which promotes time averaging of shells, but also means more prolonged exposure to taphonomic processes at and just below the sediment interface, which acts against preservation and thus reduces time averaging (Kidwell Reference Kidwell1986, Reference Kidwell1989). Sequence-stratigraphic field studies, dating of shells from historical layers, and modeling all support sediment accumulation rate as a key variable, making it possible to predict variation in preservation and temporal resolution through stratigraphic sequences: time averaging in the marine realm is to a first approximation proportional to the duration of the sedimentary hiatus (i.e., to the inverse of sediment accumulation rate) (e.g., Kidwell Reference Kidwell1986, Reference Kidwell1989, Reference Kidwell, Allison and Briggs1991; Rogers and Kidwell Reference Rogers and Kidwell2000; Scarponi et al. Reference Scarponi, Kaufman, Amorosi and Kowalewski2013; Ritter et al. Reference Ritter, Erthal, Kosnik, Coimbra and Kaufman2017; Tomašových et al. Reference Tomašových, Gallmetzer, Haselmair and Zuschin2022; Durham et al. Reference Durham, Dietl, Hua, Handley, Kaufman and Clark2023).
To assess the effects of bioturbation on time averaging, we use molluscan shell age–frequency distributions (AFDs) from sediment cores that we collected along a gradient of bioturbation on the warm-temperate, siliciclastic southern California shelf, taking advantage of an anthropogenic gradient. Burrowers were suppressed for several decades in the twentieth century by sediment and pore-water toxicity around the White Point wastewater outfall (Palos Verdes shelf, Los Angeles County), which either fully aborted or limited mixing and irrigation to less than few centimeters (Bandy et al. Reference Bandy, Ingle and Resig1964; Sherwood et al. Reference Sherwood, Drake, Wiberg and Wheatcroft2002). The area also includes a gradient in sediment accumulation rate, with two sites having high-sediment accumulation inside the zone of solid-sediment effluent deposition near the White Point wastewater outfall, and two sites outside that zone where sediment accumulation was an order of magnitude slower. We use two types of stochastic transition-rate matrices (TRMs) based on continuous-time Markov chains (Tomašových et al. Reference Tomašových, Kidwell and Dai2023; conceptually similar to discrete-time Markov chains used in bioturbation modeling [Jumars et al. Reference Jumars, Nowell and Self1981; Foster Reference Foster1985; Shull Reference Shull2001; Trauth Reference Trauth2013; Kanzaki et al. Reference Kanzaki, Hülse, Kirtland Turner and Ridgwell2021; Hülse et al. Reference Hülse, Vervoort, van de Velde, Kanzaki, Boudreau, Arndt and Bottjer2022]) to estimate downcore trends in rates of disintegration and mixing, allowing us to evaluate (1) whether disintegration and mixing rates covary and (2) the sediment depth at which they decline, that is, does the base of the TAZ (high disintegration) lie above, coincident with, or below the base of the surface well-mixed layer (SML; high mixing)? If high disintegration affects less of the column thickness than does mixing, then the positive effects of bioturbation on time averaging (mixing shells of different ages) outweigh the negative effects (bioirrigation and the disintegration it promotes). Our findings from this legacy anthropogenic gradient on the southern California shelf show that although the effects of bioturbation do increase disintegration, these effects can be exceeded by the effects of shell mixing, so that bioturbation ultimately increases rather than decreases time averaging. This result emerges regardless of sediment accumulation rate.
Background: Processes in the Benthic Mixed Layer
Burrowers are both mixers and irrigators of sediment (Boudreau Reference Boudreau1994; Smith and Rabouille Reference Smith and Rabouille2002; Orvain Reference Orvain2005; Teal et al. Reference Teal, Bulling, Parker and Solan2008; Li et al. Reference Li, Cozzoli, Soissons, Bouma and Chen2017; Soissons et al. Reference Soissons, da Conceiçâo, Bastiaan, van Dalen, Ysebaert, Herman, Cozzoli and Bouma2019), and so their net cumulative effect might be to either increase or decrease the preservation potential and time averaging of shell assemblages. The individual effects and interactions comprise several distinct mechanisms.
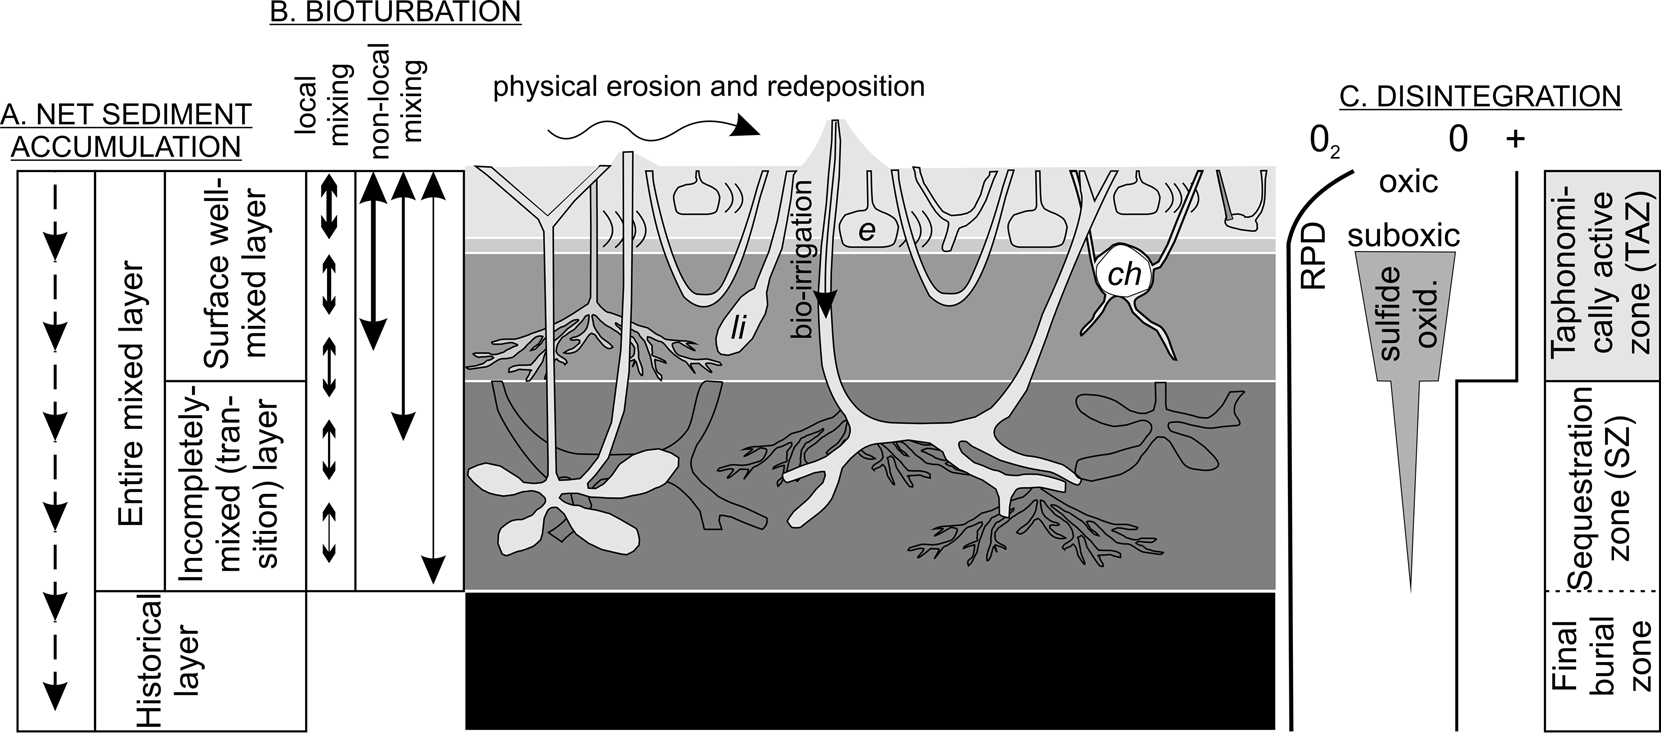
First, bioturbation moves shells upward or downward, either passively (e.g., by preferential movement of fine matrix around the shell) or actively (backfilling of burrows, creation of dens). Young shells can in this way be injected to depths faster than by sediment accumulation alone, and old shells can be exhumed upward into younger increments. This effect enlarges time averaging by increasing the residence time of shells at any given stratigraphic level, both within the SML, which is characterized by bulldozing and diffusive mixing by local feeders, and within the subsurface incompletely mixed layer (IML), which is penetrated by deep burrowers and nonlocal feeders, that is, animals that ingest in one sedimentary increment and defecate in a different one (or otherwise move grains among layers). The IML is conceptually equivalent to the transition layer of Ekdale et al. (Reference Ekdale, Muller and Novak1984) and Savrda (Reference Savrda1995). The base of the entire mixed layer, encompassing both the SML and IML, grades downward into historical layers where shells are, by definition, beyond the reach of the deepest burrowers, that is, are no longer at risk of being moved upward within the sedimentary column (Fig. 2).
Conceptual cartoon of the downcore context and dynamics for the burial of shells. Even in the face of a stochastically constant rate of net sediment accumulation (A), shells will experience downcore changes in ambient conditions triggered by bioturbation (B) and affecting rates of disintegration (C), with a surficial taphonomically active zone (TAZ) and an underlying sequestration zone (SZ). The rate of biological mixing (B; thickness of lines show the frequency of upward and downward movement of shells within the sedimentary column) as well as the mixing depth (depth of penetration of burrowers) also decreases downcore, which effectively partitions the entire mixed layer (EML) into two parts. The surface well-mixed layer (SML), typically defined on the basis of short-lived isotopes such as 210Pb and characterized by thorough, diffusive mixing by polychaetes, echinoids, or deposit-feeding mollusks, usually encompasses the upper 10–20 cm of the sediment–water interface on marine shelves. The underlying incompletely mixed layer (IML, or transitional layer) is characterized by nonlocal mixers that can advect sediment, shells, and pore-water over large distances (e.g., conveyor belt and deep excavators such as shrimps, which can penetrate multiple tens of centimeters to 1–2 m below the sediment–water interface). Fair-weather and storm energy can promote both shell exhumation and burial by winnowing or delivering finer sediments, respectively, at the sediment–water interface, typically on thickness scales ≤10 cm on the open shelf. Shells—or any particle or tracer—can be exhumed from the IML to the SML but not from the layer of final burial (historical layer). The SML typically experiences temporary fluctuations in the depth of the redox potential discontinuity (RPD), leading to oxidation of sulfides and other reduced species; the acids produced promote carbonate disintegration, which is also high within the aerobic uppermost part of the SML, where scavengers and bioeroders are active. The SML can be further subdivided into the portion that is mixed at monthly scales (as detected by 234Th) and the deeper portions mixed at yearly to decadal scales (as reflected by 210Pb) or centennial and millennial scales (as detected by 14C of shells). Burrowers can inject young dead shells below the TAZ, but shells in the IML are less likely to be exhumed back to the TAZ, because bioturbational mixing declines with sediment depth. The SZ provides a diagenetic respite for carbonate shells owing to the net alkalinity sourced by sulfate reduction or anaerobic methane oxidation, and those conditions might also promote diagenetic stabilization; pockets of SZ conditions can also exist within the TAZ. The SZ grades downward into the historical layer, where shells are immune to further exhumation. Abbreviations: e, echinoids; li, echiurian Listriolobus ; ch, chemosymbiotic bivalves.

Second, bioturbation can directly enhance dissolution of carbonate shells by irrigating the sediment with oxygenated overlying waters, thus promoting acidic pore-waters from aerobic decomposition and sulfide reoxidation (Fig. 2). The uppermost upper part of the sedimentary column affected by irrigation and other benthic activities that contribute to skeletal disintegration is the taphonomically active zone (TAZ; sensu Aller Reference Aller1982, Reference Aller1994; term introduced by Davies et al. [Reference Davies, Powell and Stanton1989] and Powell [Reference Powell1992]; extended to the water column for pelagic carbonate and siliceous organisms by Petro et al. [Reference Petro, Ritter M, Pivel and Coimbra2018] and Ragueneau et al. [Reference Ragueneau, Tréguer, Leynaert, Anderson, Brzezinski, DeMaster and Dugdale2000]). Bioirrigation should thus decrease time averaging by increasing the disintegration rate of shells in the segment of the mixed layer that corresponds to the TAZ (Aller Reference Aller1982, Reference Aller1994]; Kidwell et al. Reference Kidwell, Best and Kaufman2005).
Third, bioturbation can increase the probability of disintegration of shells that have already been weakened by dissolution or maceration, such as by the milling associated with vertical advection, especially in siliciclastics (Cherns and Wright Reference Cherns and Wright2009). It additionally promotes disintegration by exhuming shells back near the sediment–water interface, reexposing them to durophagous scavengers and to macroscopic (sponges, worms, barnacles) and microbial borers (Lescinsky et al. Reference Lescinsky, Edinger and Risk2002; Parsons-Hubbard Reference Parsons-Hubbard2005; Powell et al. Reference Powell, Kraeuter and Ashton-Alcox2006; Best et al. Reference Best, Ku, Kidwell and Walter2007; Ritter et al. Reference Ritter, Erthal and Coimbra2019).
An important effect arising from conditions that lead to the formation of the entire mixed layer that exceeds the TAZ thickness is the favored preservation of shells moved downward by burrowers that penetrate below the depth of the TAZ (such as callianassid shrimps; Griffis and Suchanek Reference Griffis and Suchanek1991; Bradshaw and Scoffin Reference Bradshaw and Scoffin2001). Such burial can permit shells to bypass the TAZ into the underlying sequestration zone (SZ; Olszewski Reference Olszewski2004), where shells are not affected by damage induced by borers, burrowers, or sulfide oxidation. Disintegration in the SZ is much slower, even though biogeochemical reactions capable of dissolving carbonate shells (such as methanogenesis) can reappear below the entire mixed layer (Torres et al. Reference Torres, Hong, Solomon, Milliken, Kim, Sample, Teichert and Wallmann2020; Akam et al. Reference Akam, Swanner, Yao, Hong and Peckmann2023). Rapid burial of shells to the SZ is especially likely when burrowers are size selective in moving particles (e.g., preferentially excavating and moving fine grains upward) and/or when the gradual accumulation of coarser shell particles at depth is not counteracted by exhumation (e.g., Meldahl et al. Reference Meldahl, Flessa and Cutler1997; Tomašových et al. Reference Tomašových, Kidwell, Barber and Kaufman2014). This bypassing effect, burying shells to the SZ faster than permitted by the sediment accumulation rate, will not only generate the left tail of AFDs but will also reduce the probability of disintegration, thus increasing time averaging in the lower parts of the entire mixed layer, below the TAZ (Tomašových et al. Reference Tomašových, Kidwell, Barber and Kaufman2014, Reference Tomašových, Kidwell, Alexander and Kaufman2019b; Olszewski and Kaufman Reference Olszewski and Kaufman2015; Dominguez et al. Reference Dominguez, Kosnik, Allen, Hua, Jacob, Kaufman and Whitacre2016; Albano et al. Reference Albano, Hua, Kaufman, Tomašových, Zuschin and Agiadi2020). The vertical segregation between the TAZ and the lower parts of the entire mixed layer means that time averaging of assemblages in the historical layer can become independent of disintegration within the TAZ (Tomašových et al. Reference Tomašových, Kidwell and Dai2023: fig. 7). Even if the rapid burial of shells to the SZ is not permanent, it gives shells a time-out from the TAZ. If exhumed, these shells that are more than 1000 years old can generate the widely observed long right tail in the AFDs encountered in sediments sampled from the SML (most grab samples; Tomašových et al. Reference Tomašových, Kidwell, Barber and Kaufman2014).
Assessing whether (1) the net effects of bioturbation are to increase or decrease time averaging, (2) the disintegration rates covary with mixing rates, and (3) the thickness of the TAZ coincides with that of the SML requires analyses of downcore data on the postmortem ages of carbonate producers. Such data are available for molluscan shells from several settings, including a tropical back-reef lagoon (Kosnik et al. Reference Kosnik, Hua, Jacobsen, Kaufman and Wüst2007, Reference Kosnik, Hua, Kaufman and Wüst2009), the warm-temperate siliciclastic shelves of the northern Adriatic (Tomašových et al. Reference Tomašových, Gallmetzer, Haselmair, Kaufman, Vidović and Zuschin2017, Reference Tomašových, Gallmetzer, Haselmair, Kaufman, Kralj, Cassin, Zonta and Zuschin2018, Reference Tomašových, Gallmetzer, Haselmair, Kaufman, Mavrič and Zuschin2019a), and southern California (Tomašových et al. Reference Tomašových, Kidwell, Alexander and Kaufman2019b); here, we focus on the last.
Study Area: Gradients in Sediment Accumulation and Bioturbation on the Southern California Shelf
Wastewater pollution in the southern California Bight in the late twentieth century represents a nonnatural experiment that generated a geographic gradient in sediment accumulation rate and bioturbation. Bioturbation was strongly depressed by sediment toxicity and H2S at sites affected by the deposition of effluents around the White Point wastewater outfall in the 1940s to 1970s, followed by recovery of infaunal organisms in the late twentieth century (Bandy et al. Reference Bandy, Ingle and Resig1964; Wheatcroft and Martin Reference Wheatcroft, Martin, Drake, Sherwood and Wiberg1994, Reference Wheatcroft and Martin1996; Lee et al. Reference Lee, Sherwood, Drake, Edwards, Wong and Hamer2002; Sherwood et al. Reference Sherwood, Drake, Wiberg and Wheatcroft2002; Ranasinghe et al. Reference Ranasinghe, Schiff, Montagne, Mikel, Cadien, Velarde and Brantley2010). Three coring sites analyzed here are located around this outfall on the Palos Verdes shelf, and one coring site is located on the nearby San Pedro shelf.
The warm-temperate Southern California Bight has a semiarid, Mediterranean climate with little rainfall during the summer. California shelves are wave dominated, with the fair-weather wave base usually at 10–20 m and storm wave base at ~30–40 m (Slater et al. Reference Slater, Gorsline, Kolpack and Shiller2002). However, the fair-weather wave base on the Palos Verdes shelf is probably closer to 30 m based on the well-sorted shelly sands encountered along that isobath (LACSD 2011). Storm wave base is also relatively deep, as molecular stratigraphic evidence (Niedoroda et al. Reference Niedoroda, Swift, Reed and Stull1996) indicates that storms can erode 2–4 cm of surficial sediment per storm, even at 60 m. The Palos Verdes shelf is quite narrow, less than 3.5 km, with a shelf–slope break at 75–100 m depth (Hampton et al. Reference Hampton, Karl and Murray2002), whereas the San Pedro shelf is ~10 km wide, with the shelf break at 50–100 m. Both are bordered by a submarine canyon that routes sediments of the littoral cell out to the abyssal San Pedro Basin. Natural sediment supply is limited mostly to the erosion of local coastal cliffs (Palos Verdes) and highly seasonal river discharge and, starting in the mid-twentieth century, channelized stormwater runoff (San Pedro shelf; Jones et al. Reference Jones, Noble and Dickey2002; Ferré et al. Reference Ferré, Sherwood and Wiberg2010). A northward-flowing current, driven by a counterclockwise eddy associated with the California Current, drives longshore sediment transport (Hickey Reference Hickey1992). The San Pedro shelf is affected by resuspension and offshore transport of fines during high-energy winter storms, with the storm wave base sometimes reaching 80–90 m (Drake et al. Reference Drake, Cacchione and Karl1985), but similar episodic offshore transport of fines probably also applies to the less sandy Palos Verdes shelf. Holocene sediments vary markedly in thickness on both shelves. They attain mostly less than 10 m on the Palos Verdes shelf (locally up to 30 m in depocenters in the SE part), with extensive exposed bedrock in the NW part (Hampton et al. Reference Hampton, Karl and Murray2002). Holocene thickness on the San Pedro shelf is controlled by fault-induced grabens and uplifted regions, varying from very thin relict sands on exposed bedrock to an ~4-m-thick cover in the SE and eastern segments (Wolf and Gutmacher Reference Wolf and Gutmacher2004).
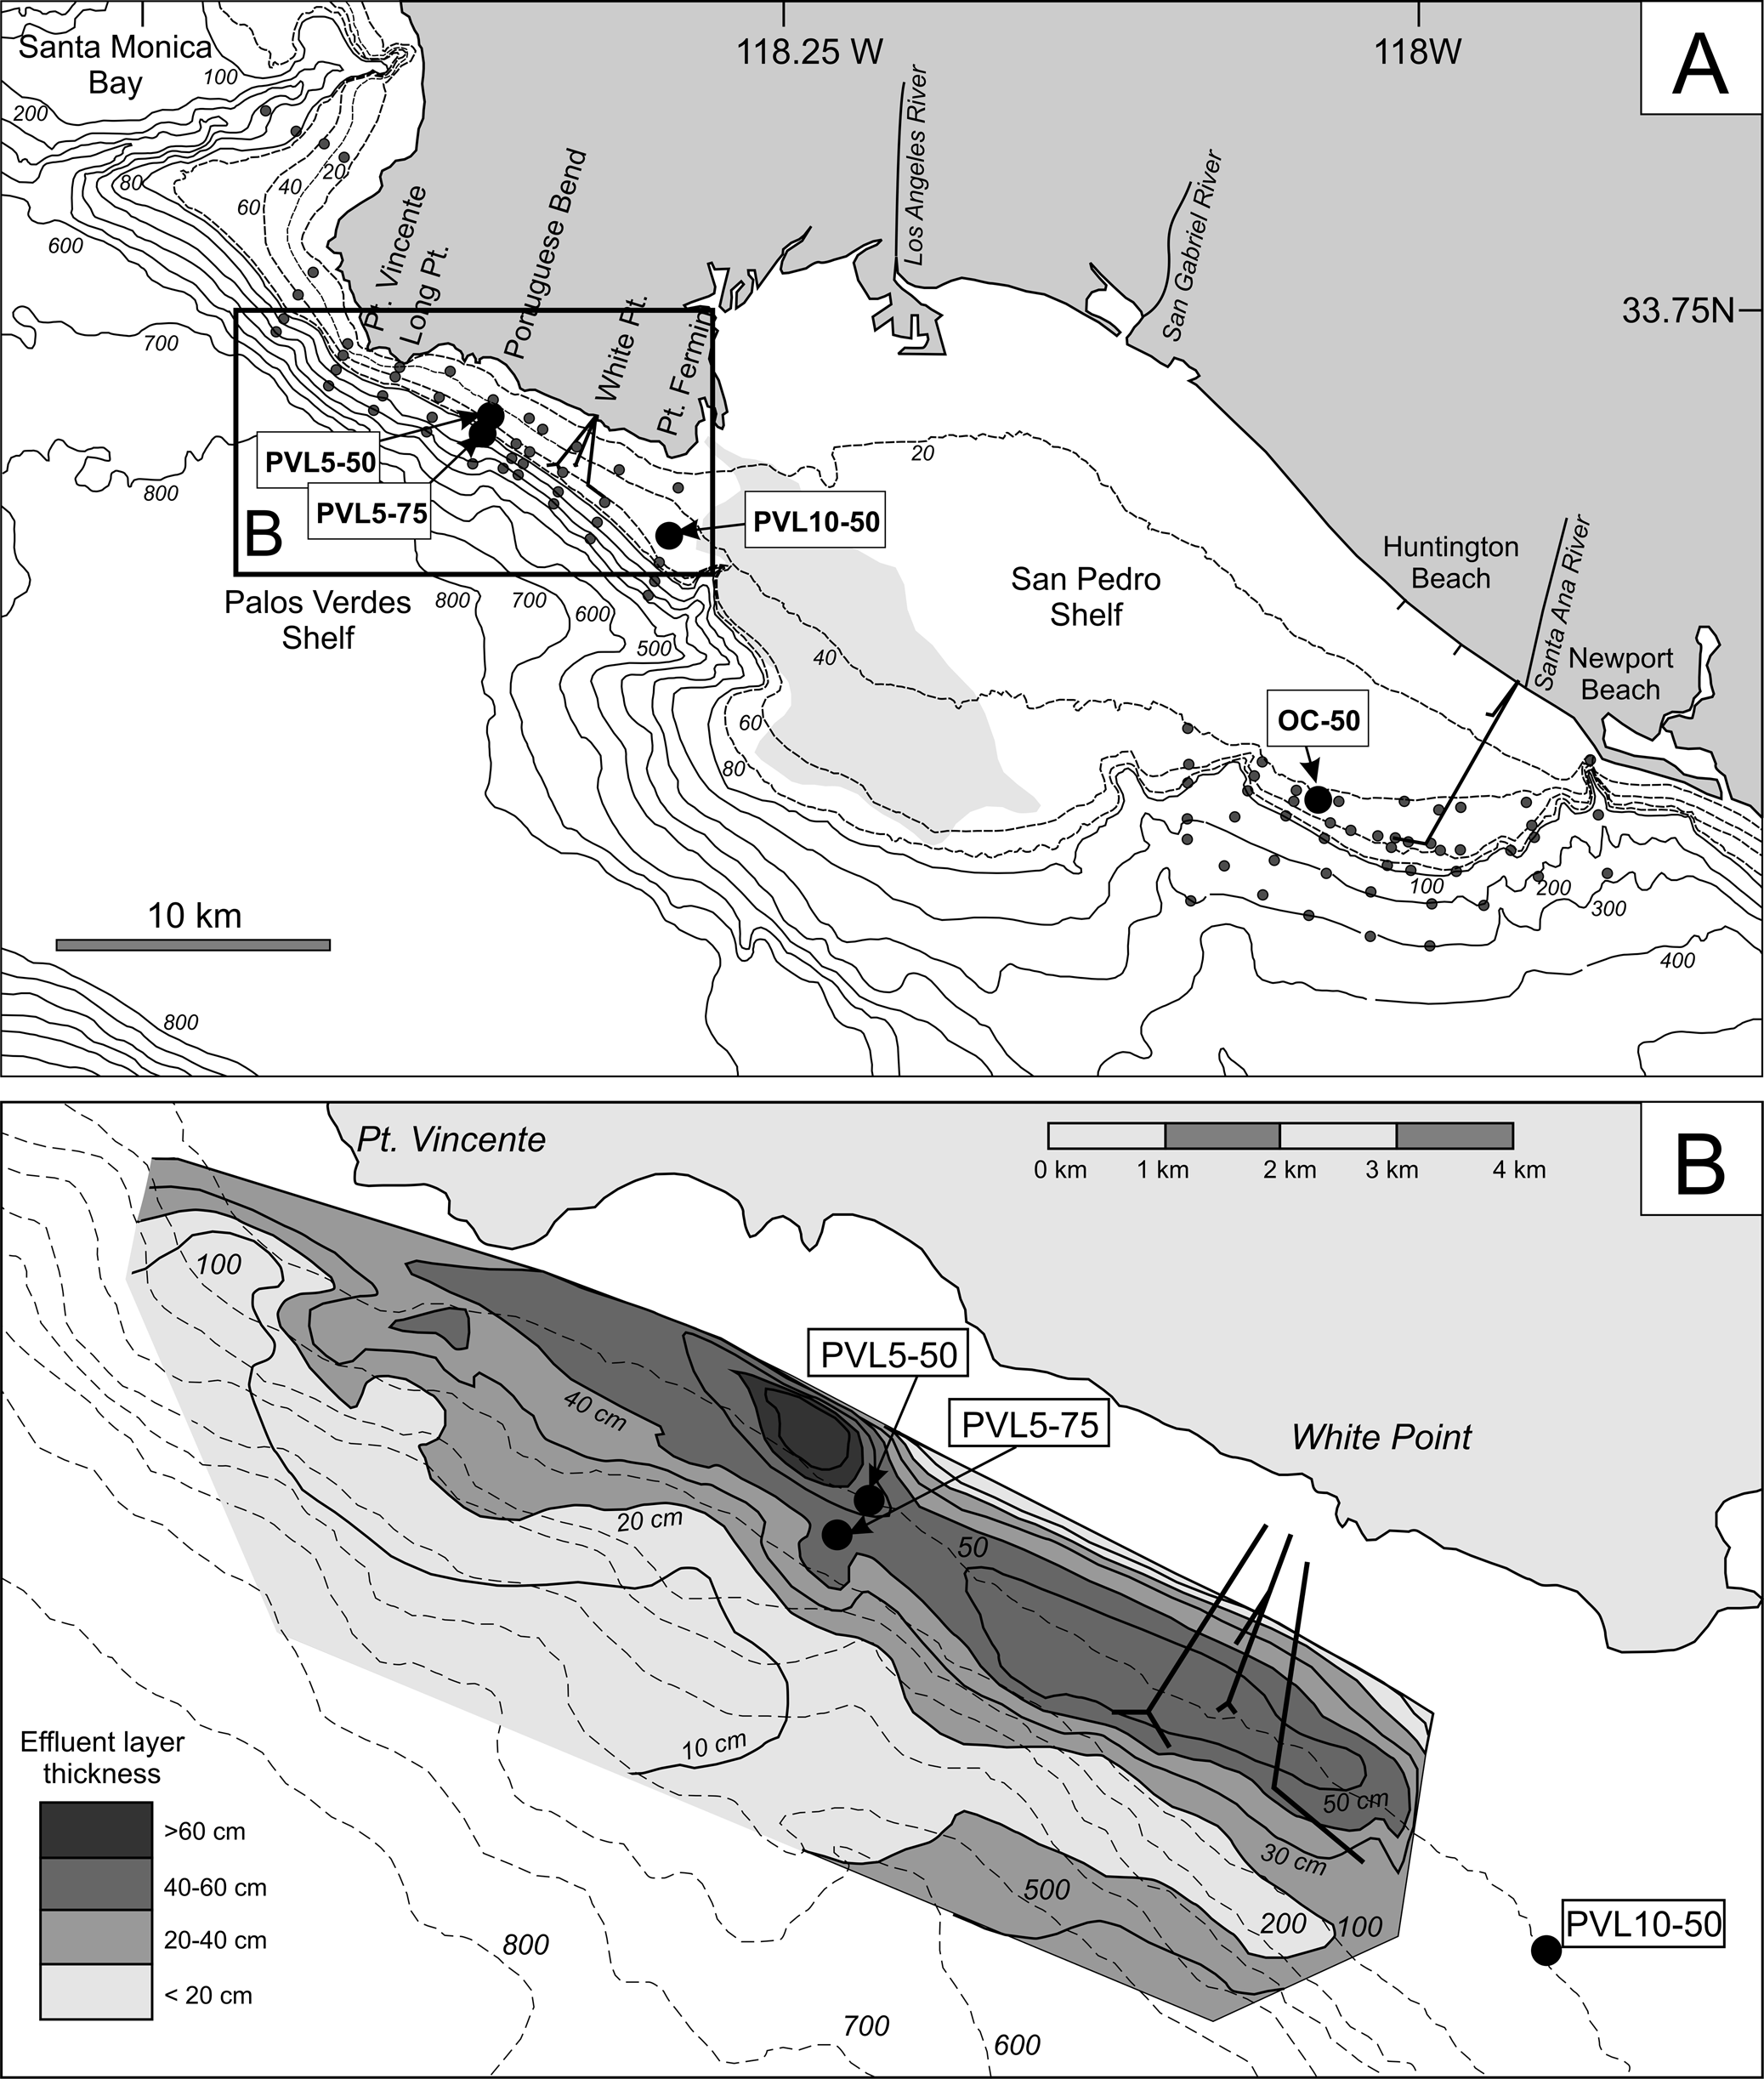
Wastewater outfalls opened on the Palos Verdes shelf and on the San Pedro shelf in the early twentieth century. Before the onset of wastewater outfalls and the even earlier siltation driven by agriculturally induced soil erosion in the nineteenth century (Tomašových and Kidwell Reference Tomašových and Kidwell2017; Kemnitz et al. Reference Kemnitz, Berelson, Hammond, Morine, Figueroa, Lyons and Scharf2020), sediment accumulation rates on the Palos Verdes shelf (Los Angeles County) and nearby San Pedro shelf (Orange County) were low, based on 14C-calibrated amino acid racemization (AAR) and 210Pb dating of seabeds lacking wastewater-associated metals (~0.005–0.2 cm/yr; Santschi et al. Reference Santschi, Guo, Asbill, Allison, Kepple and Wen2001; Sherwood et al. Reference Sherwood, Drake, Wiberg and Wheatcroft2002; Alexander and Lee Reference Alexander and Lee2009; Tomašových et al. Reference Tomašových, Kidwell, Alexander and Kaufman2019b). In contrast, within the solid effluent–affected part of the Palos Verdes shelf, accumulation rates of effluent sediments in the twentieth century were ~10 times higher, attaining ~1–2 cm/yr at sites close to the outfalls and grading laterally to 0.6–1.2 cm/yr at distal sites (Alexander and Lee Reference Alexander and Lee2009). Bottom currents that flow northwestward along the Palos Verdes shelf have deflected twentieth-century effluent deposition westward relative to the location of the outfall (Lee et al. Reference Lee, Sherwood, Drake, Edwards, Wong and Hamer2002; Ferré et al. Reference Ferré, Sherwood and Wiberg2010; Fig. 3A,B).
A, The location of four sediment cores (large filled circles) on the Palos Verdes and San Pedro shelves relative to wastewater outfalls that discharge in 60 m water depth (straight lines; Los Angeles County outfall is offshore of White Point, Orange County outfall is near the mouth of the Santa Ana River). Two cores (OC-50 and PVL10-50) are located in 50 m water depth outside areas affected by deposition of solid-sediment effluent from these outfalls. The other two (PVL5-50 and PVL5-75, in 50 and 75 m water depths, respectively) are located within an extensive effluent zone on the Los Angeles (Palos Verdes) shelf, which was characterized in the mid-twentieth century (1940s–1970s) by an order-of-magnitude higher sediment accumulation rate and by a significant depression of bioturbation related to toxic DDT pollution and high sulfide levels (see Fig. 4). The smaller black circles denote sites where regional agencies regularly sample benthic community composition. Bathymetric contours in meters. B, Spatial gradient in the thickness of the effluent layer (gray scale) on the Palos Verdes shelf with the location of three coring sites within the polygonal area mapped by the U.S. Geological Survey (map adapted from Lee et al. Reference Lee, Sherwood, Drake, Edwards, Wong and Hamer2002). The strong along-shore asymmetry of this mid-twentieth-century effluent mound reflects a dominantly westward-flowing coastal current. Negligible solid effluent has been detected by regional agencies at our up-current coring site PVL10-50 on the Palos Verdes shelf and at OC-50 on the San Pedro shelf (shown in A). Light-gray shaded area: outcropping bedrock.

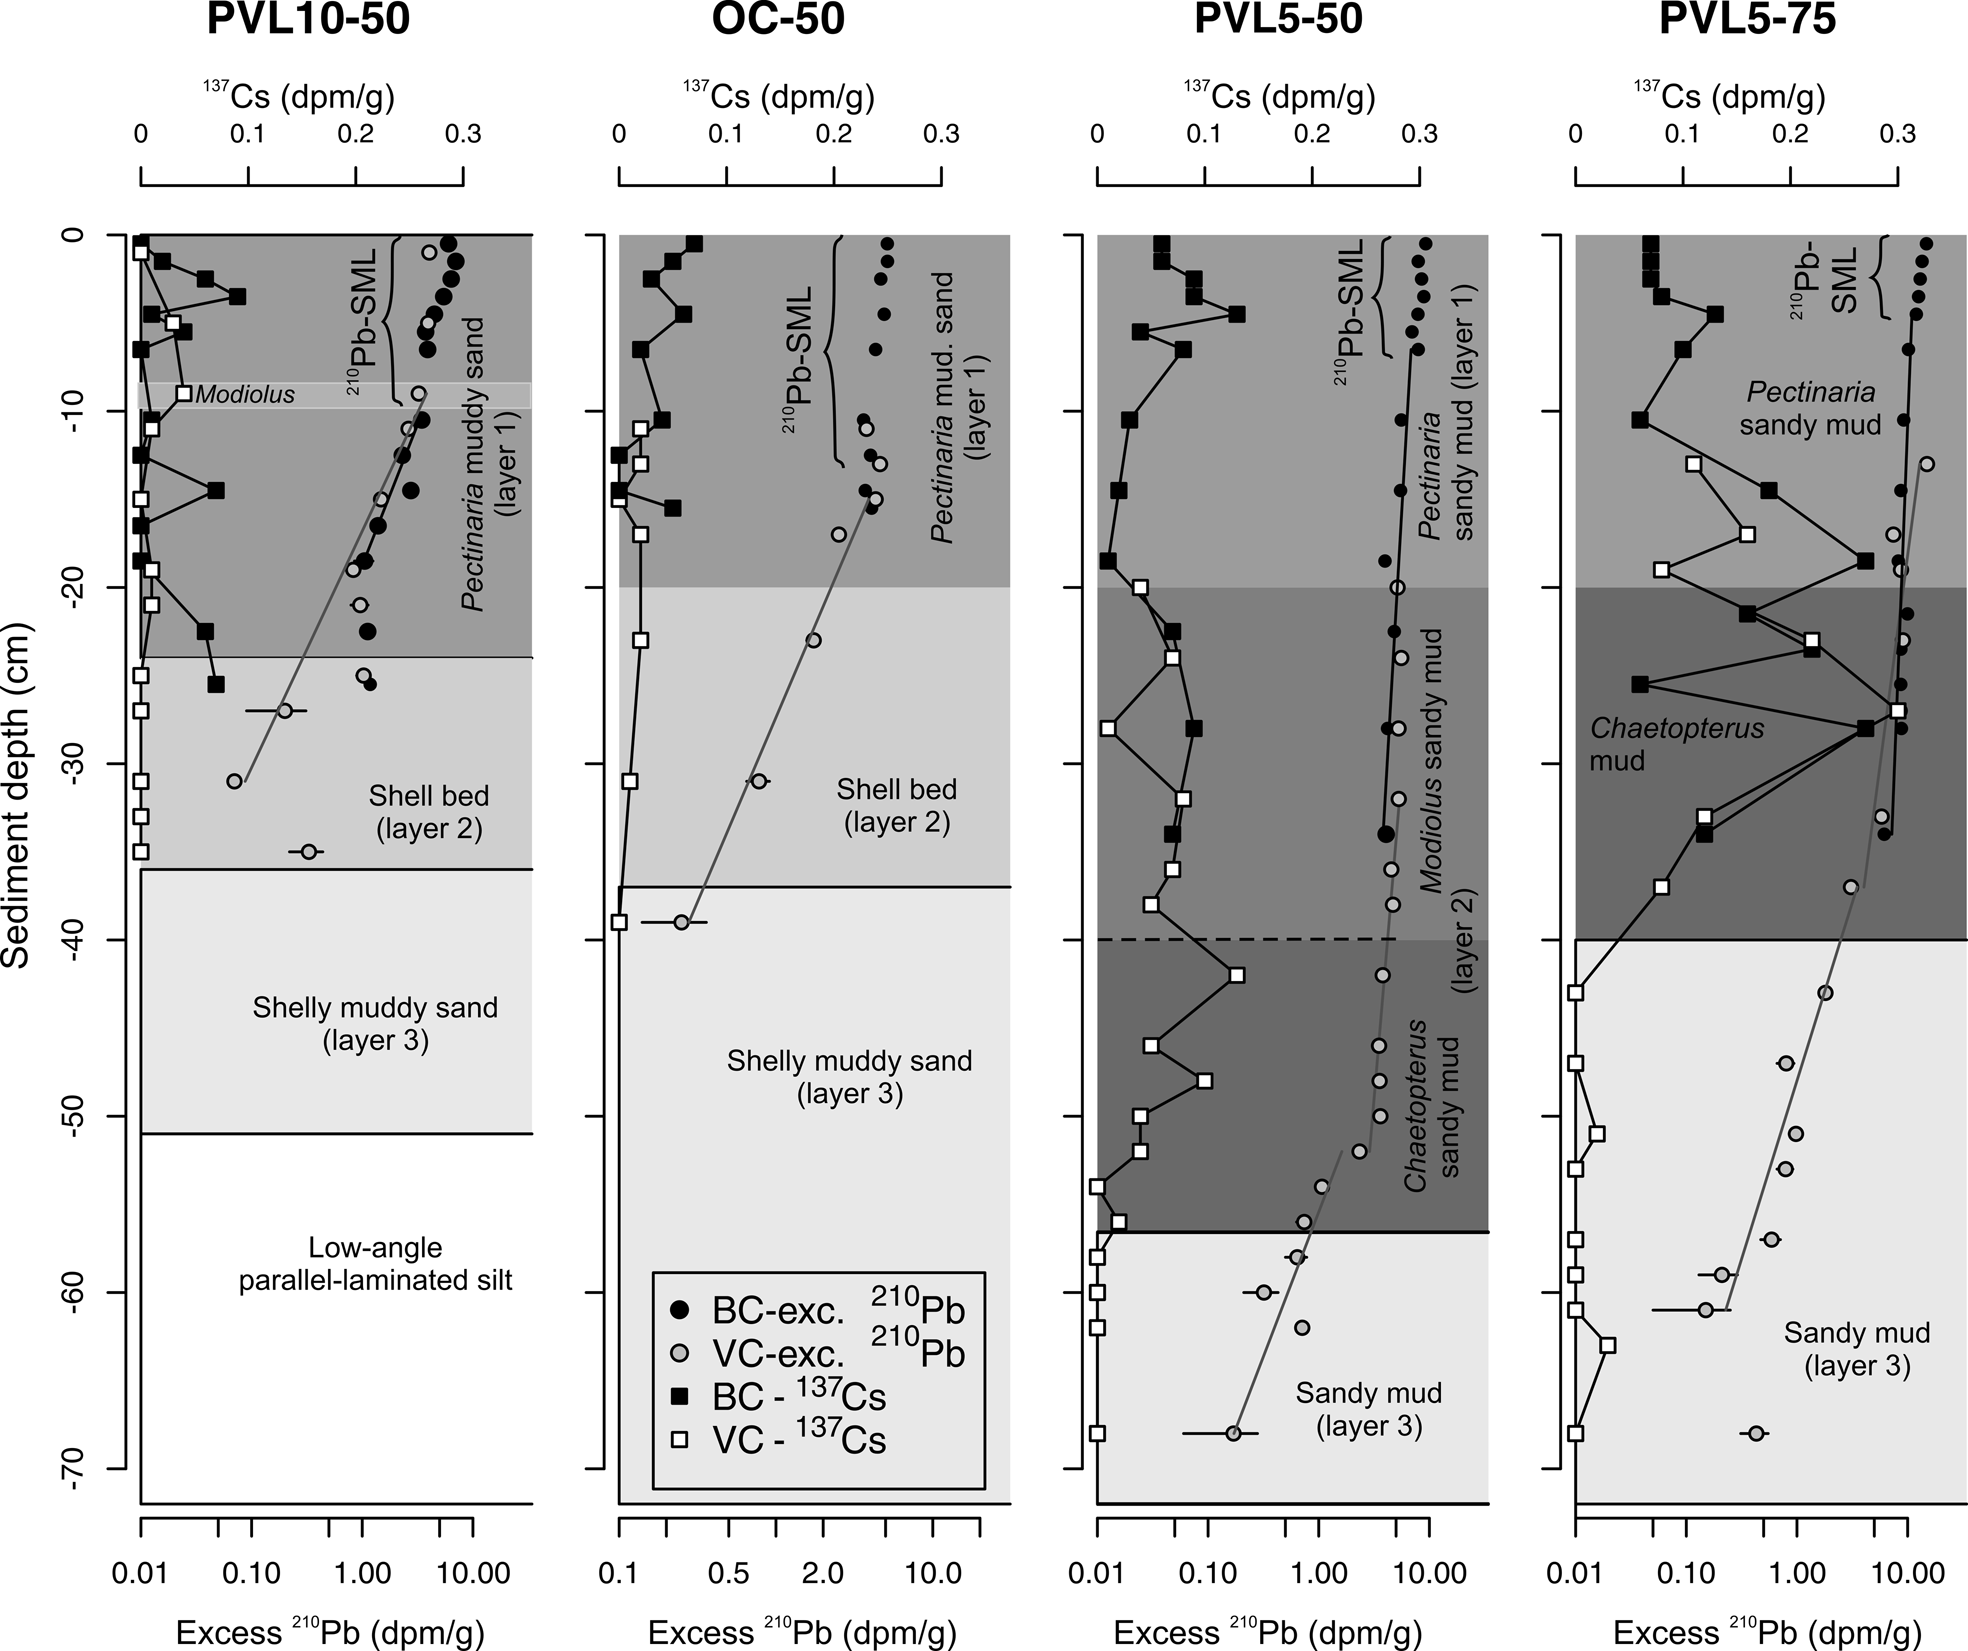
Stratigraphy and downcore profiles of 137Cs and excess 210Pb activity in the upper 70 cm of cores at each site, combining data from boxcores (BC) and vibracores (VC). The steepness of 210Pb profile segments below the uppermost uniform or irregular segments of the surface well-mixed layer (SML) show that sediment accumulation rates in the late twentieth century varied by an order of magnitude between the two core sites outside the wastewater effluent layer (PVL10-50 and OC-50; “native sediments” characterized by slow sediment accumulation) and the two cored sites within it (PVL5-50 and PVL5-75), where fine-grained sediment accumulated at a rapid rate of ~1 cm/yr. Within the effluent layer, the steep slope of the excess 210Pb activity is replaced by a less steep segment at 55–70 cm at PVL5-50 and at ~40–60 cm at PVL5-75, indicating that pre-emission sediment accumulation rates there were 0.22 cm/yr and 0.27 cm/yr, respectively. In those same cores, the peak activity of 137Cs coincides with the top of the early-effluent Chaetopterus layer at 40 cm at PVL5-50 and at 20 cm at PVL5-75. These peaks in bomb-generated radionuclide fallout have previously been shown to date to 1971 CE in southern California marine sediments (Santschi et al. Reference Santschi, Guo, Asbill, Allison, Kepple and Wen2001) and are congruent with independent estimates of the timing of maximum organic enrichment in the cores (Eganhouse and Pontolillo Reference Eganhouse and Pontolillo2000).

The White Point outfall on the Palos Verdes shelf opened in 1937 and initially terminated at 34 m water depth. Two outfall pipes that have operated since 1956 and 1966 terminate at 60-m water depth (Stull et al. Reference Stull, Swift and Niedoroda1996). The maximum emission rate of wastewater suspended solids occurred in 1971, followed by a decline as a result of improved wastewater treatment in response to the Clean Water Act and National Discharge Elimination System (Stein and Cadien Reference Stein and Cadien2009). This history of emissions frames our research design.
Early-Emission Phase
On the Palos Verdes shelf, a dead zone with a dark, sulfide-rich, ~15-cm-thick surficial sludge layer with a radius of 6–7 km developed in water depths of ~30–50 m in the 1940s–1960s; this seabed was dominated by opportunistic sessile tube worms (Chaetopterus) and had a total absence of living foraminifers (Rittenberg et al. Reference Rittenberg, Mittwer and Ivler1958; Bandy et al. Reference Bandy, Ingle and Resig1964; Stull et al. Reference Stull, Haydock, Smith and Montagne1986c; McGann Reference McGann2009). A 20- to 40-cm-thick, black to dark-gray, stiff and plastic early-effluent layer rich in organic carbon, nitrogen, sulfides, and fecal pellets was deposited during this phase (Eganhouse et al. Reference Eganhouse, Pontolillo and Leiker2000; Lee et al. Reference Lee, Sherwood, Drake, Edwards, Wong and Hamer2002; Fig. 3A). This Chaetopterus-rich layer represents a characteristic marker layer of effluent deposition on the Palos Verdes shelf (Drake et al. Reference Drake, Eganhouse and McArthur2002), with the maximum contamination in the uppermost parts at the top of this layer (dated to 1971 CE on the basis of the known date of maximum suspended-solid emissions; Stull et al. Reference Stull, Baird and Heesen1986a; Eganhouse and Pontolillo Reference Eganhouse and Pontolillo2000). Sediment accumulation rates at the two non-effluent sites (PVL10-50, OC-50) were low during this phase, but the sediments at these sites were still enriched in total nitrogen from wastewater emissions.
Late-Emission Phase. Mass emissions declined precipitously from 1971, especially with a shift to advanced primary treatment of wastewater in 1978 and the onset of secondary treatment in 1983, with full (i.e., 100%) secondary treatment of wastewater by 2002 (Stein and Cadien Reference Stein and Cadien2009; Schiff et al. Reference Schiff, Greenstein, Dodder and Gillett2016); these shifts reduced both the total quantity of solid sediment released to the shelf and its level of contamination. A less organic-rich, ~10- to 20-cm-thick late-effluent layer (Sherwood et al. Reference Sherwood, Drake, Wiberg and Wheatcroft2002) was thus deposited after 1971. The first stage of recovery in community composition on these effluent sediments started with the onset of advanced primary treatment. It was represented by chemosymbiotic communities of slow-burrowing infaunal bivalves (Solemya reidi and Parvilucina tenuisculpta) that dominated through the 1970s (Stein and Cadien Reference Stein and Cadien2009). A persistent community shift at 60 m water depth (location of pipe openings) took place in the 1980s, when the chemosymbiotic-dominated benthic communities were replaced by more trophically diverse assemblages of obligate deposit-, facultative deposit-, and suspension-feeding mollusks, crustaceans, echinoids, and asteroids (Stull et al. Reference Stull, Haydock, Smith and Montagne1986c, Reference Stull, Swift and Niedoroda1996; Swift et al. Reference Swift, Stull, Niedoroda, Reed and Wong1996). This second stage of recovery was associated with two gradients in the rate of recovery. First, along the 60 m isobath, distal sites that were less enriched in total organic carbon and H2S were characterized by higher functional diversity than those closer to the outfall (Stull et al. Reference Stull, Swift and Niedoroda1996; distal sites include the PVL10-50 site used here and also analyzed by Leonard-Pingel et al. [Reference Leonard-Pingel, Kidwell, Tomašových, Alexander and Cadien2019]). Second, even when stations at 60 m water depth recovered in the mid-1980s, deeper stations at 150 m water depth only shifted from chemosymbiotic to heterotrophic communities in the mid-1990s (LACSD 2011). In the 1990s, smaller biodiffusion coefficients (slower mixing rates) based on profiles of 234Th were still observed at sites close to the outfall on the Palos Verdes shelf (Wheatcroft and Martin Reference Wheatcroft and Martin1996): those lower mixing rates are expected along gradients of increasing organic content of sediment and thus increased oxygen consumption (Rosenberg Reference Rosenberg1977; Rosenberg et al. Reference Rosenberg, Nilsson and Diaz2001).
On the nearby San Pedro shelf (Fig. 3A), the effects of wastewater were much weaker, with no effluent layer or any large dead zone developing around the Orange County outfall (Watkins Reference Watkins1961). That outfall opened at ~16–18 m water depth in 1954 and produced only a small area of black organic- and sulfide-enriched sediments (Rittenberg et al. Reference Rittenberg, Mittwer and Ivler1958; Watkins Reference Watkins1961). In 1971, this shoreface-depth outfall was replaced by diffusers that opened much farther offshore in 60 m water depth; all water went through secondary treatment by this time, with mass emission rates of solids declining in the early 1980s. Although wastewater emissions from this new diffuser did affect the local composition of benthic communities (Diener et al. Reference Diener, Fuller, Lissner, Haydock, Maurer, Robertson and Gerlinger1995), they did not produce any major gradients in sediment accumulation rate or in bioturbation intensity on the shelf (Rhoads et al. Reference Rhoads, Swanson and Evans1999). Our site OC-50 at 50 m water depth is located on the part of the shelf considered to be “far-field” in the late 1980s (Diener et al. Reference Diener, Fuller, Lissner, Haydock, Maurer, Robertson and Gerlinger1995).
Methods
Data
Our sampling design with four coring sites at 50–75 m water depths, which is well below fair-weather wave base and below average storm wave base, takes advantage of the gradients in sediment accumulation (Lee et al. Reference Lee, Sherwood, Drake, Edwards, Wong and Hamer2002; Ferre et al. Reference Ferré, Sherwood and Wiberg2010) and bioturbation (Wheatcroft and Martin Reference Wheatcroft, Martin, Drake, Sherwood and Wiberg1994; Swift et al. Reference Swift, Stull, Niedoroda, Reed and Wong1996). Two coring sites are outside any effluent deposition or former dead zone (Fig. 3): OC-50 is at 50 m water depth on the San Pedro shelf, 4 km down-current and NW of the Orange County outfall, and PVL10-50 is at 50 m water depth on the Palos Verdes shelf, about 3 km up-current of the White Point outfall (Los Angeles County; same cores used by Leonard-Pingel et al. [Reference Leonard-Pingel, Kidwell, Tomašových, Alexander and Cadien2019] and Tomašových et al. [Reference Tomašových, Kidwell, Alexander and Kaufman2019b]; Fig. 3). Both sites had low (210Pb-based) sediment accumulation rates throughout the twentieth century (0.2 cm/yr; Tomašových et al. Reference Tomašových, Kidwell, Alexander and Kaufman2019b), comparable to pre-1971 estimates of sediment accumulation rates on the Palos Verdes shelf measured by Alexander and Lee (Reference Alexander and Lee2009). Sediment accumulation rates in these same cores based on 14C-dated shells are lower than estimates based on 210Pb, as predicted by the Sadler effect (Sadler Reference Sadler1981): the millennial-scale half-life of 14C permits sediment accumulation rates to be estimated for longer intervals of time than the decadal half-life of 210Pb, permitting inclusion of a greater number of winnowing events and thus reducing long-term sediment accumulation.
The other two coring sites characterized by higher sediment accumulation were located within the effluent layer of the White Point outfall on the Palos Verdes shelf. Both sites were close to the dead zone that existed in the 1960s (Bandy et al. Reference Bandy, Ingle and Resig1964) and were located within the DDT-contaminated area (along Line 5 of the monitoring grid of LACSD; Fig. 3). PVL5-50 is at 50 m water depth ~3 km down-current of the outfall; the effluent layer there was 40–60 cm thick in 1992 (Lee et al. Reference Lee, Sherwood, Drake, Edwards, Wong and Hamer2002). PVL5-75 is less than 1 km farther offshore at 75 m water depth, where the effluent layer in 1992 was 20–40 cm thick (Lee et al. Reference Lee, Sherwood, Drake, Edwards, Wong and Hamer2002). Both sites are thus located within an effluent mound deposited at ~1–2 cm/yr in the late twentieth century (Lee et al. Reference Lee, Sherwood, Drake, Edwards, Wong and Hamer2002), with little sediment accumulation since then owing to a shift to advanced secondary water treatment (Drake Reference Drake and Lee1994).
During a dedicated cruise in 2012 (RV Melville, MV1211), we collected several boxcores (50 × 50 cm cross-section, 20–40 cm penetration) and vibracores (8 cm diameter; for this study we sampled the uppermost 1.5 m section of cores that were 3–4 m long) at each of these four sites for analyses of grain size, 210Pb, and 137Cs; for 14C-calibrated AAR of two bivalve species; and for counts of bivalve species based on dead shells, using a 1 mm mesh size to match the mesh size used in benthic-community monitoring by agencies. For radiochemistry, one 15-cm-diameter PVC subcore of a boxcore and the top 1.5 m of a vibracore were sectioned at 1 cm intervals in the first 10 cm and thereafter at 2 cm intervals at each site. 210Pb and 137Cs were analyzed using gamma spectroscopy as described by Alexander and Lee (Reference Alexander and Lee2009).
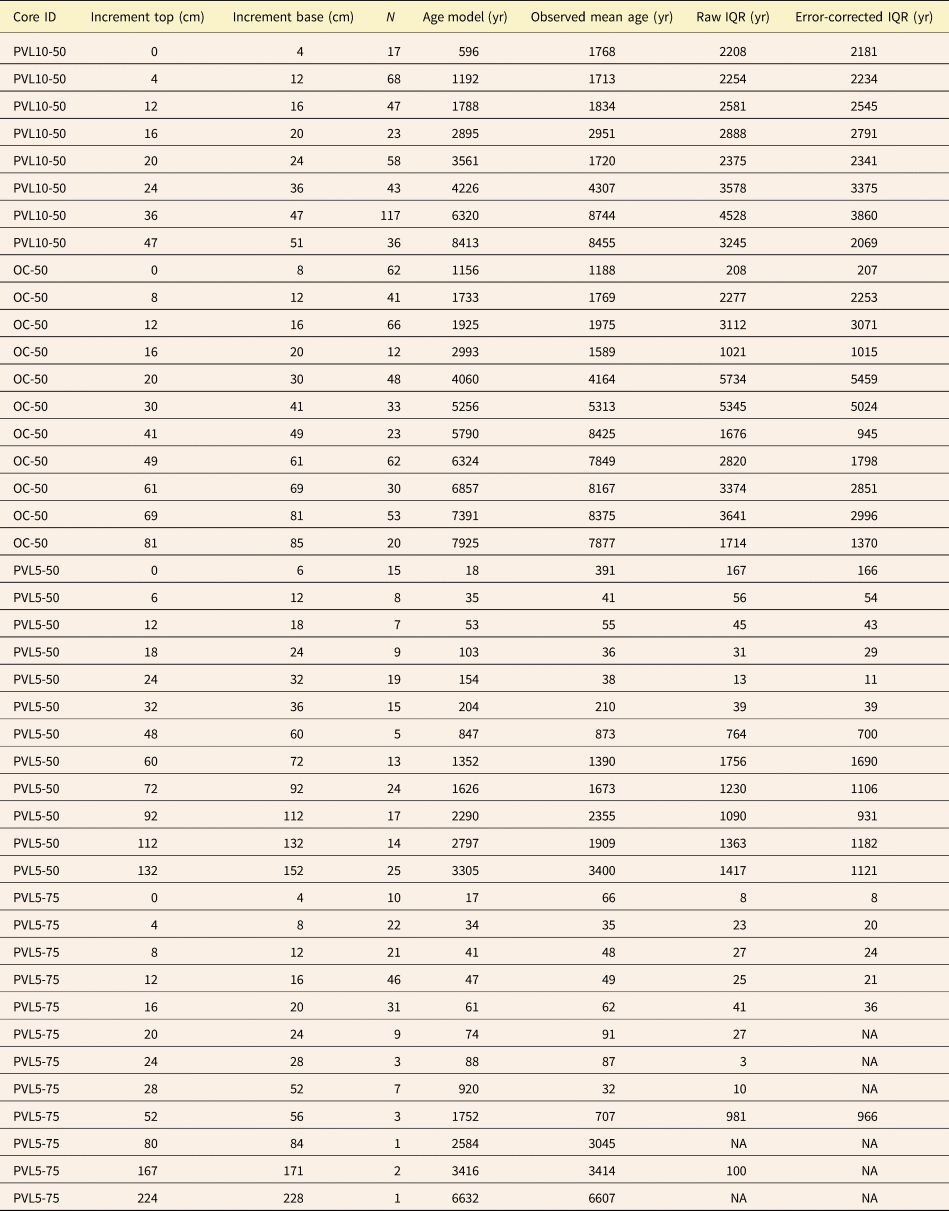
Shell AFDs at each of the four sites are based on composite cores that were stitched from boxcores and vibracores at each site on the basis of lithological, geochronological, and geochemical criteria (Fig. 4). AFDs from the uppermost 20–24 cm at the low-sediment accumulation PVL10-50 and OC-50 sites and from the uppermost 40 cm at the high-sediment accumulation PVL5-50 and PVL5-75 sites are based solely on shells collected from boxcores, which were originally sampled in 2-cm-thick increments. Shells from deeper core increments are from vibracores, which were originally sampled in 4- to 5-cm-thick increments owing to much smaller quantities of sediment and sparse shells (postmortem age data are available from the Dryad Digital Repository: https://doi.org//10.5061/dryad.0vt4b8h54). Shells were pooled to 4-cm-thick increments when fitting AFDs to high-resolution TRMs (except few shell-poor increments at PVL5-50 and PVL5-75 that were pooled into thicker, 8–12 cm-thick increments; see high-resolution binning in the R language scripts). In analyses of time averaging (interquartile age range, IQR), temporal overlap (a proportion of overlapping area between kernel densities of two stratigraphically adjacent AFDS; Pastore Reference Pastore2018), and stratigraphic disorder (Spearman rank correlation between postmortem ages and their stratigraphic positions), shells were pooled into increments with at least 5 shells per increment (standardized binning in the R language scripts).
We pooled shell ages from two aragonitic infaunal bivalve species (Nuculana taphria and Parvilucina tenuisculpta) into increment-specific AFDs to minimize the effects of temporal variability in their abundance over the past centuries. Nuculana taphria was frequent before 1900 in the southern California Bight, but declined in abundance during the twentieth century, whereas P. tenuisculpta attained very large population sizes only in the late twentieth century (Fabrikant Reference Fabrikant1984; Stull et al. Reference Stull, Haydock and Montagne1986b,Reference Stull, Haydock, Smith and Montagnec; Tomašových et al. Reference Tomašových, Kidwell, Alexander and Kaufman2019b). The sample sizes used to produce AFDs in 4- to 5-cm-thick core increments range mostly between 10 and 50 specimens, depending on the total number of shells of both species. Shells of both species are abundant at PVL10-50 and OC-50 (Tomašových et al. Reference Tomašových, Kidwell, Alexander and Kaufman2019b), and so AFDs correspond to random subsets of ~50 shells per increment. Sample sizes are smaller at PVL5-50 (N = 5–15) and PVL5-75 (N = 7–46 in the upper 40 cm, N = 1–3 in three increments below 60 cm) and reflect our dating of all shells of N. taphria and P. tenuisculpta available per increment.
Thickness of the Mixed Layer and Sediment Accumulation Rates
The radionuclide geochronology and shell dating of cores collected at PVL10-50 and OC-50 have already been described by Tomašových et al. (Reference Tomašových, Kidwell, Alexander and Kaufman2019b), and 14C calibrated AAR ages for N. taphria and P. tenuisculpta were described at all four sites by Tomašových et al. (Reference Tomašových, Kidwell, Alexander and Kaufman2019b, Reference Tomašových, Kidwell and Dai2023). 210Pb and 137Cs data for PVL5-50 and PVL5-75 from the effluent layer of the Palos Verdes shelf are published here for the first time. The thickness of the present-day SML is defined on the basis of the upper, age-homogeneous segment of the profiles of two widely used, age-diagnostic radionuclides. Using excess 210Pb activity, the SML is defined as the uppermost increment of the core characterized by an almost-vertical or irregular segment, which overlies an apparent log-linear segment. Using the 14C-calibrated AAR ages of molluscan shells, the SML is defined as the upper portion showing no downcore increase in median shell age. We compare these two empirical estimates against the depth-specific estimates of mixing rates that we derive from TRMs (Fig. 5). To estimate the relative intensity of bioturbational smearing of the record since 1971 in pairs of sites having similar sediment accumulation rates, we used the magnitude of the peak in bomb-generated 137Cs in each core: given similar fallout (starting inventory) at both sites, the narrower and higher the peak, the less the vertical mixing of this tracer. Sediment accumulation rates are estimated on the basis of (1) log-linear declines in excess 210Pb profiles (with one segment at PVL10-50 and OC-50 and with two segments at PVL5-50 and PVL5-75; Fig. 4) and (2) stratigraphic distances among adjacent dated increments divided by the differences in the mean shell ages of those increments, both for subsurface increments deposited during the pre-emission phase and surface increments deposited during the emission phase.
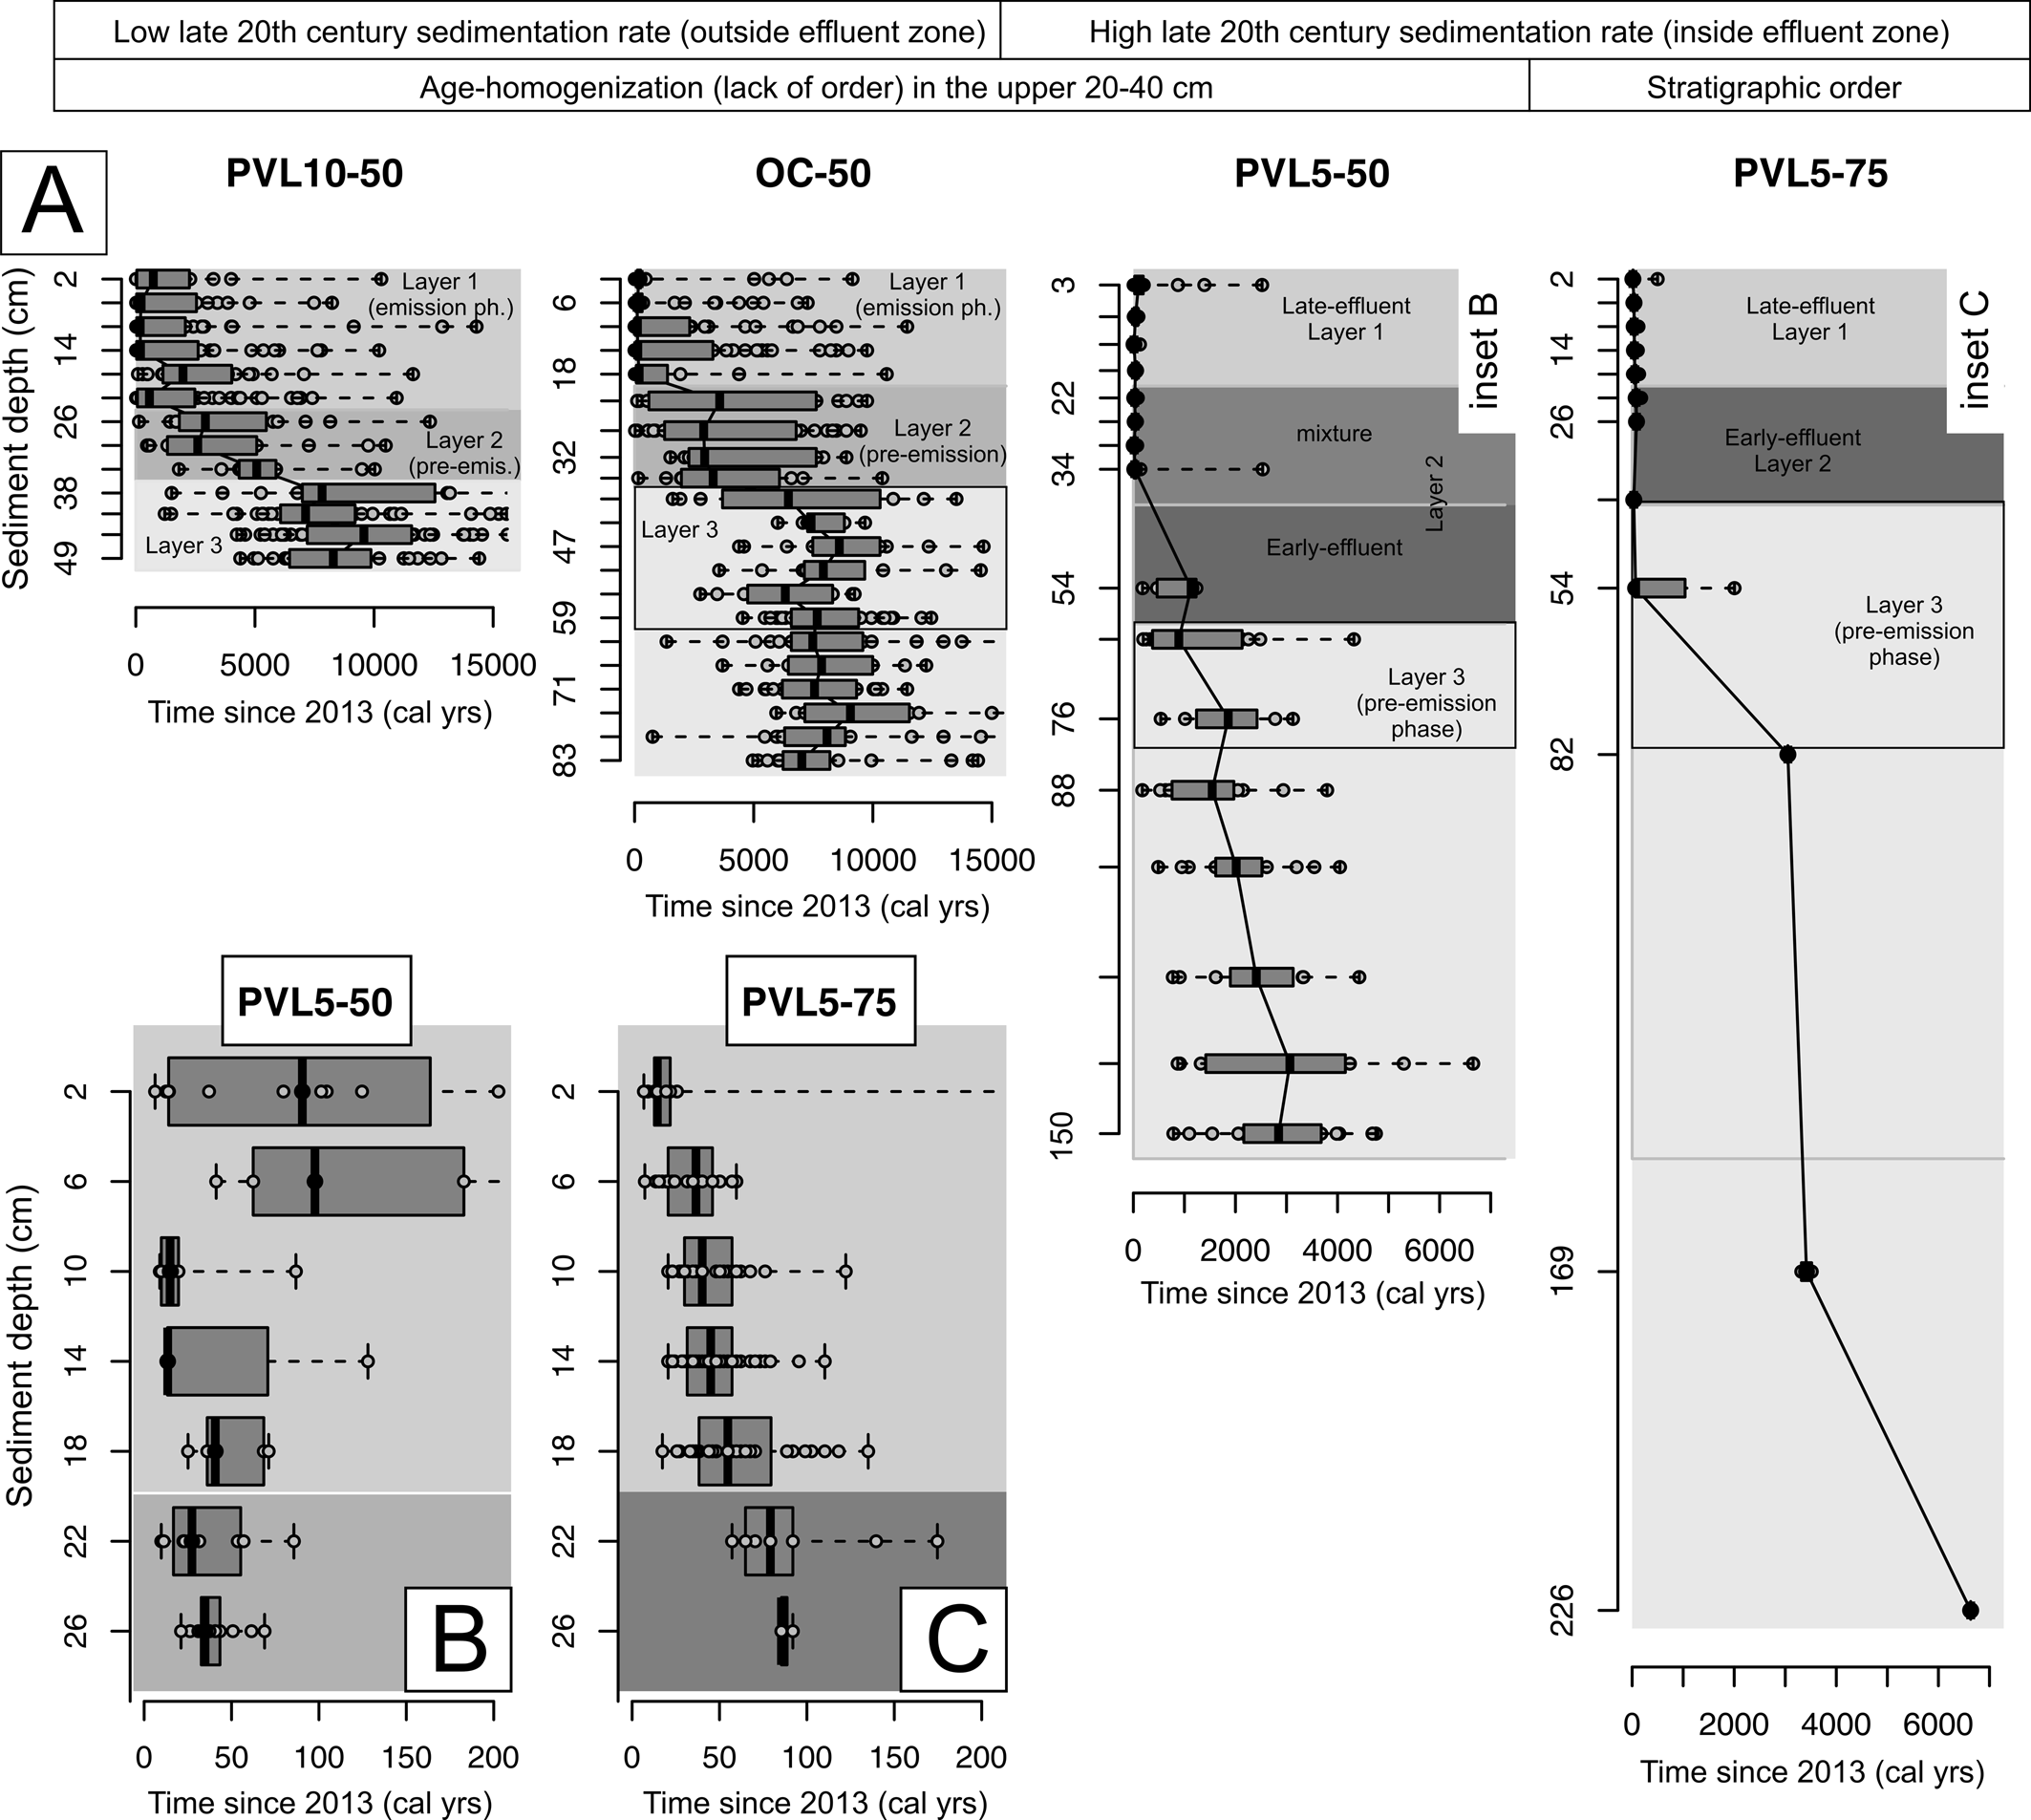
A, The spatial gradient in downcore changes in the time averaging of molluscan assemblages, showing 14C-calibrated amino acid racemization (AAR) shell ages (x-axis, in calibrated years; note the shift in the scale between the sites with low- and high-sediment accumulation, with insets showing the last 200 years) that were collected incrementally downcore (y-axis, cm) at four sites. In each core increment, box midpoints denote median shell ages, and shaded boxes denote the raw interquartile age range (IQR). At the two low-sediment accumulation sites (upper left), shell ages do increase downcore overall, but each increment exhibits a wide range of shell ages, with strong overlap among adjacent increments as well as high time averaging within each increment. In surface layer 1, age–frequency distributions (AFDs) are strongly right skewed (“L-shaped”) in successively deeper layers, median ages increase, and the distributions become more symmetric. At the two high-sediment accumulation sites (right), shells exhibit a much narrower range of ages in the upper part of the core and over a much thicker stratigraphic interval, and IQRs increase notably only at depth (within layer 3, which accumulated before the onset of wastewater emissions). At PVL5-75 (C), where bioturbation was suppressed by DDT poisoning in the mid-twentieth century, downcore stratigraphic ordering of shell ages is preserved even in the uppermost 30 cm, in contrast to the age-homogeneous pattern at PVL5-50 (B).

Time Averaging
Time averaging is measured as an interquartile age range (IQR) corrected for the chronological calibration error, following the approach in Tomašových et al. (Reference Tomašových, Kidwell and Dai2023). The error-free IQR of postmortem ages is estimated by the subtraction of the error component of variance (variance of each shell age estimated on the basis of resampling its underlying age distribution expected under a gamma- (Parvilucina) or lognormally-distributed error (Nuculana) estimated by the AAR-14C calibration, and such per-shell variance estimates are averaged across all shells occurring in an increment; this approach is conceptually equivalent to the age estimation variance based on the mean variance of posterior age distributions in Ritter et al. [Reference Ritter, Erthal, Kosnik, Kowalewski, Coimbra, Caron and Kaufman2023]) from the total variance of calibrated shell age estimates (conceptually equivalent to the total assemblage variance in Ritter et al. [Reference Ritter, Erthal, Kosnik, Kowalewski, Coimbra, Caron and Kaufman2023]). That difference is square-root transformed to obtain an error-free standard deviation. To obtain an error-free IQR, this estimate is then multiplied by the ratio of the IQR to the standard deviation that is observed in the raw (error-uncorrected) AFD.
Stochastic TRMs
A TRM is an array that describes the instantaneous rates at which shells move vertically between stratigraphic increments or disintegrate (Tomašových et al. Reference Tomašových, Kidwell and Dai2023). A continuous-time Markov chain that describes this process consists of the three types of transitions that shells can undergo with respect to stratigraphic increments—they can experience burial, exhumation, or disintegration. Burial denotes any downward movement of a shell, either from bioturbation or from sediment accumulation; exhumation corresponds to any upward movement driven by either biological or physical reworking; and disintegration corresponds to the effective loss of shells from a paleontological perspective, that is, deterioration to a state where the shell has become taxonomically unidentifiable. Although the difference between burial and exhumation can reflect selectivity of upward or downward movements induced by burrowers, this difference can also reflect the contribution of sediment accumulation rate if the burial and exhumation rates induced by burrowers are equal. Therefore, burial and exhumation can be transformed to the geologically more amenable terms of sediment accumulation and symmetric mixing (equal up and down movement). The matrices focus entirely on shell transitions: they are not constrained by the burial, exhumation, or disintegration of other, for example, fine-grained sedimentary particles. For example, burial of a shell by bioturbation can exceed its exhumation by bioturbation if shell burial by burrowers is size selective (including active burial by shelly infaunal organisms to several centimeters below the sediment–water interface where they can enter a death assemblage) and is compensated by the upward transport of fine particles (Wheatcroft Reference Wheatcroft1992; Shull and Yasuda Reference Shull and Yasuda2001; Hupp et al. Reference Hupp, Kelly, Zachos and Bralower2019).
Shells (1) can persist in an individual stratigraphic increment; (2) can be moved up or down by burial and exhumation; (3) can be lost from an increment by disintegration (or by lateral transport or by burial from the lowermost core increment below the base of the core); and (4) can be diagenetically stabilized in the SZ so that, if they are exhumed back into the TAZ, their disintegration rates remain slow, despite the rapid disintegration of other shells that have remained within the TAZ. This stabilization during residence in the SZ—an idea that emerges from evidence of very prolonged time averaging in modern and ancient sediments—can be promoted by any mechanism that reduces the reactivity of carbonate minerals within the SZ. Those mechanisms include the precipitation of authigenic cement in surrounding matrix, and various dissolution–precipitation processes that act on the shell itself, leading to changes in the size, mineralogy, or elemental composition of crystals (e.g., Ostwald ripening, recrystallization induced by bioeroders, precipitation of microbial carbonates; Morse and Casey Reference Morse and Casey1988; Rude and Aller Reference Rude and Aller1991; Reid and MacIntyre Reference Reid and MacIntyre1998; Diaz and Eberli Reference Diaz and Eberli2022; Garuglieri et al. Reference Garuglieri, Marasco, Odobel, Chandra, Teillet, Areias, Sánchez-Román, Vahrenkamp and Daffonchio2024).
The element qij (for i ≠ j) of the TRM Q is the instantaneous rate from state i to state j (e.g., from increment i to the underlying increment j by burial, or from increment i to state of loss j by disintegration). The log-likelihood equations used to estimate the maximum-likelihood parameters of transition rates in a given matrix Q are given in Tomašových et al. (Reference Tomašových, Kidwell and Dai2023) and the R language scripts are available from the Zenodo Digital Repository: https://doi.org//10.5281/zenodo.10070064. We use two types of TRM models: (1) a high-resolution model that estimates sediment accumulation, symmetric mixing, and disintegration of shells in 11- to 13-cm-scale stratigraphic increments (as used in Tomašových et al. Reference Tomašových, Kidwell and Dai2023), and (2) a low-resolution model that estimates burial, exhumation, and disintegration in two (surface and subsurface) layers that are equivalent to the age-homogeneous SML and the underlying IML, which is burrowed but not homogenized (transitional layer). Mixing is permitted to be asymmetric in the low-resolution model. In these models, mixing rates track shell movements and thus do not directly track bioirrigation. However, a positive covariation between mixing and disintegration can be expected when mixing is positively coupled with irrigation, fueling carbonate disintegration.
High-Resolution TRM Model
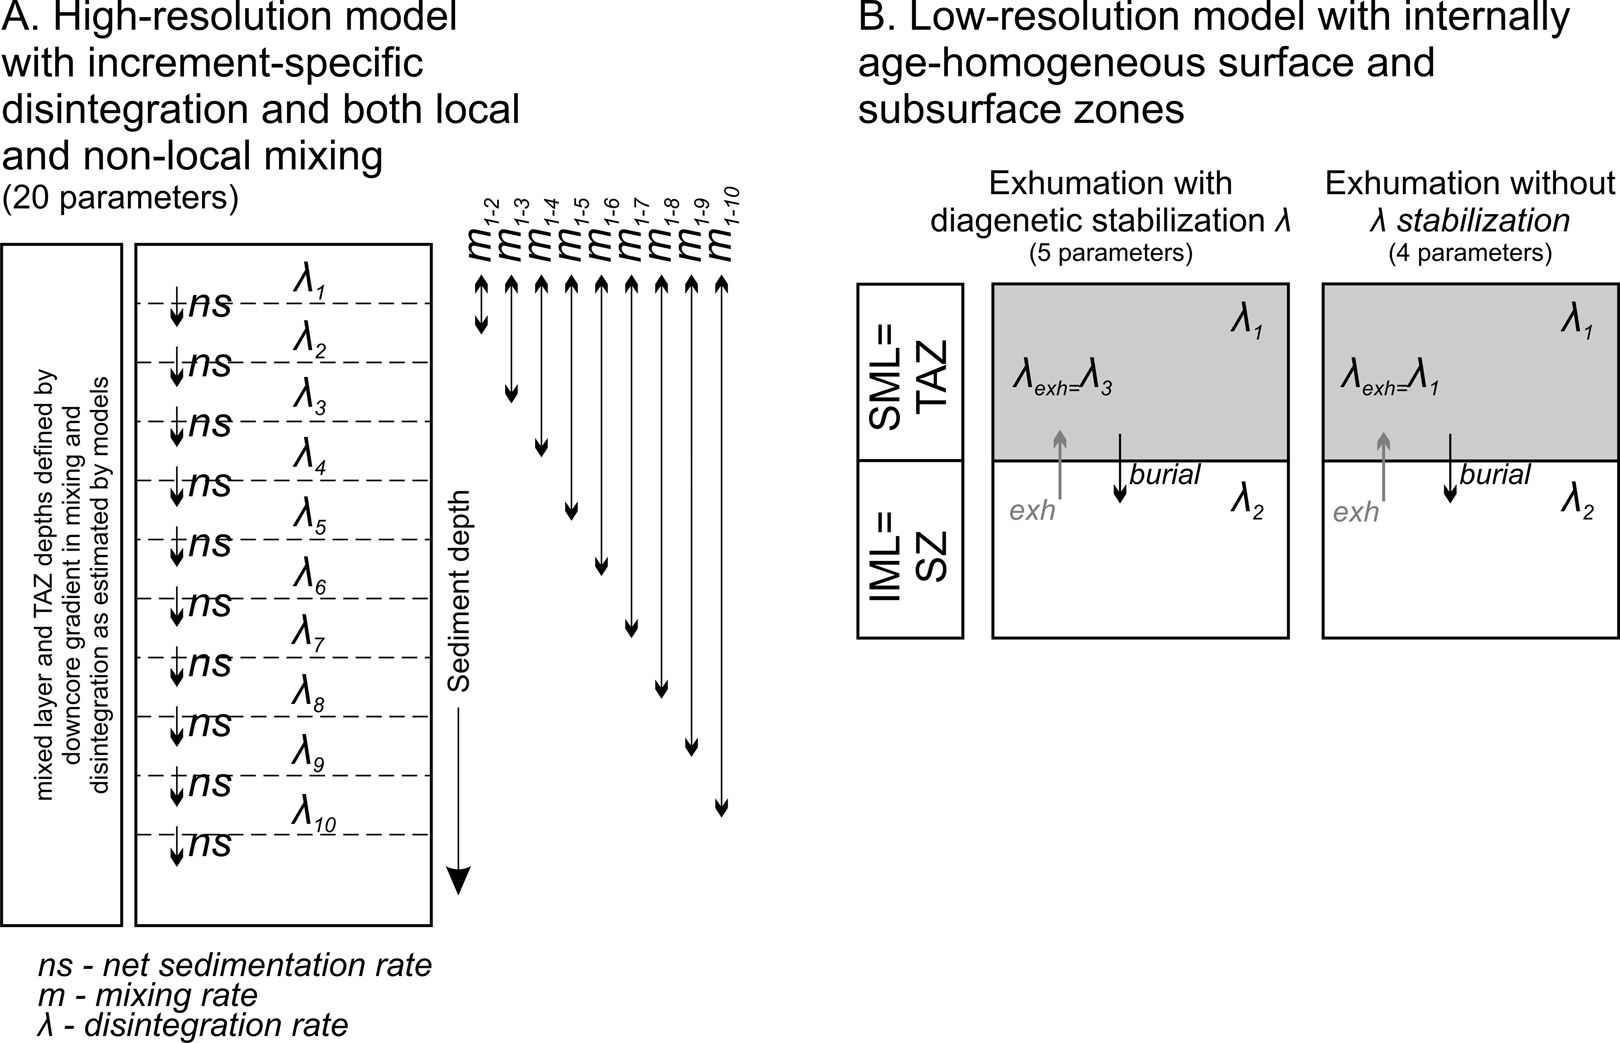
Burial and exhumation rates are converted to sediment accumulation rate and shell mixing rate in a high-resolution model. Mixing in this model version occurs between the uppermost increment and each of the underlying increments, thus allowing for nonlocal mixing (Boudreau Reference Boudreau1986; Shull Reference Shull2001; Meysman et al. Reference Meysman, Boudreau and Middelburg2003); disintegration is allowed to vary among increments (Fig. 6A). Shells subject to nonlocal mixing are instantaneously moved vertically across a significant distance, which we operationally define here as 10 cm. That is, they are not simply shifted between adjacent 5 cm increments, but skip an entire increment, such as moving from 2.5 to 12.5 cm (skipping the 5–10 cm increment). Such a feat could be achieved by callianassid shrimp or by Arenicola over the course of one season. Twenty parameters at minimum can be estimated in a model with 10 increments, including 10 disintegration rates, 9 mixing rates, and 1 sediment accumulation rate (Fig. 6A). This version can thus identify the depths at which mixing and disintegration rates decline. In our former study (Tomašových et al. Reference Tomašových, Kidwell and Dai2023), mixing rates between adjacent increments and disintegration rates were set to be the same for the entire SML; nonlocal mixing was ignored. Although this former approach successfully replicated downcore changes in the shapes of AFDs, it did not allow us to estimate centimeter-scale variability in disintegration and mixing among increments. In our cores, the high-resolution model version has 11–13 increments. Emission-phase increments at all sites are 4–5 cm thick. Pre-emission-phase increments at PVL10-50 and OC-50 are also 4–5 cm thick, but they are analytically pooled to 10–20 cm thick to enlarge sample sizes to be comparable to those at PVL5-50 and PVL5-75.
A, Transition-rate matrix (TRM) with 10 increments to accommodate an approach where mixing rates refer to the movements between the topmost increment and any of the successively underlying increments (mixing rates, m 1-2 to m 1-10) as well as increment-specific variability in disintegration (λ1–λ10); this approach does not require an a priori definition of the depth of the taphonomically active zone (TAZ) and surface well-mixed layer (SML). B, TRM simplified to two layers (zones) in scenarios where the age-homogeneous SML can be equal to the TAZ and the underlying incompletely mixed layer (IML) can be equal to the sequestration zone (SZ). In this simple approach, the transit of shells through either of the two layers is modeled using a layer-specific rate of disintegration (λ, where the subscript denotes layer), and permitting both upward (exhumation e) and downward (burial b) movements of shells between the two layers. Shells can retain the low disintegration rates they experienced in the SZ even after exhumation into the TAZ, where ambient disintegration rates are higher (left column in B). In the absence of diagenetic stabilization in the SZ, shells revert to a high disintegration rate upon exhumation into the TAZ (right column in B).

At PVL10-50 and OC-50, we estimate a single sediment accumulation rate (ns) for the entire core. At PVL5-50 and PVL5-75, which were already known to be characterized by a significant twentieth-century increase in sediment accumulation rate (effluent layer), the surface and subsurface increments are allowed to be deposited under two different sediment accumulation rates (ns 1 and ns 2). We fit TRMs to core data both without diagenetic stabilization (i.e., all shells in the TAZ disintegrate at the same rate, regardless of whether they have been diagenetically stabilized in the SZ and exhumed to the TAZ) and with diagenetic stabilization (i.e., shells exhumed into the TAZ from the underlying SZ, where they became more resistant to disintegration, disintegrating at a lower rate than shells that have resided continuously in the TAZ).
An example of a high-resolution transition matrix without diagenetic stabilization and with a single sediment accumulation rate is as follows (qi refers to all rates in an increment i, ns refers to burial induced by sediment accumulation, mi-j refers to bioturbation-induced burial from increment i to j, mj-i refers to bioturbation-induced exhumation from increment j to i, λi refers to disintegration in increment i, and the boundary between the TAZ and the SZ does not need to be specified a priori):

In the stabilization model, shells exhumed from the subsurface SZ increments to the surface TAZ increments do not disintegrate any more (their λ = 0). An example of a transition matrix with diagenetic stabilization, with increments 3 and 4 assigned to the SZ, is as follows:

Low-Resolution TRM Model
Estimates of disintegration and mixing produced by the high-resolution model can be sensitive to small-scale noisiness in the shape of AFDs in individual centimeter-thick increments. To reduce this patchiness effect and to estimate the asymmetry between exhumation and burial within the entire mixed layer, we pool individual increments that do not differ in age to two layers, and fit TRMs to just two, surface and subsurface layers that can capture the SML/IML boundary (a decline in mixing) and the TAZ/SZ boundary (a decline in disintegration). These two layers are operationally equivalent to the internally age-homogeneous SML layer (or to any uppermost increment, in the absence of evidence for age homogenization) and the underlying IML layer (as detected by the high-resolution model or estimated on the basis of independent ichnological or geochronological criteria). At PVL10-50, OC-50, and PVL5-50, we assigned the upper, age-homogeneous 20- to 35-cm-thick SML to the model surface layer and the underlying, equally thick interval to the model subsurface layer (we note that the maximum depth of the IML is not well constrained; the IML is assumed here to be as thick as the SML). Because the PVL5-75 site does not exhibit any segments of downcore age homogeneity, its upper 6 cm were assigned to the surface layer of the model and the 6–12 cm core interval was assigned to the subsurface layer.
In the diagenetic stabilization scenario, shells are reset to a lower disintegration rate by residence in the subsurface SZ, regardless of how long they spend in the subsurface or whether they are exhumed to the surface TAZ (Fig. 6B). Such shells become permanently locked into a low disintegration rate as soon as the reside in the SZ. This stabilization scenario has five parameters: disintegration λ1 in the surface layer (TAZ) and λ2 in the subsurface layer (SZ), burial b 12 from TAZ to SZ, exhumation e 21 from SZ to TAZ, and disintegration λexh of shells exhumed from the SZ to the surface TAZ layer. Diagenetic stabilization occurs when λexh is smaller than λ1 and similar to λ2, and the disintegration of shells exhumed to the TAZ thus follows λexh and not λ1 (in contrast to the high-resolution TRM model, λexh is free to vary and disintegration of shells exhumed to the TAZ is not set to zero in the low-resolution TRM model):

In the scenario without diagenetic stabilization, the disintegration rate depends purely on the layer in which it resides (Fig. 6B):

The R language scripts are available from the Zenodo Digital Repository: https://doi.org//10.5281/zenodo.10070064.
Results
Downcore Changes in Lithology and in Shell Age at Non-effluent Sites
The two cores at the low-sediment accumulation, non-effluent sites (PVL10-50, OC-50; Figs. 4, 5) comprise, from their bases, a several decimeter-thick unit of muddy sand with loosely packed shells (layer 3 deposited during the pre-emission phase; per-increment median age is ~7000–10,000 years at both sites). This layer is overlain by a 12- to 17-cm-thick, loosely packed molluscan shell bed at both sites (layer 2 during the pre-emission phase, median age ~2600–5000 years), with encrusting and erect bryozoans (Nevianipora, Cellaria) and serpulids. The uppermost 20–25 cm at both sites is composed of shell-poor muddy sand. Median age within this emission-phase layer 1 varies between ~180 and 2000 years at PVL10-50 and between ~100 and 200 years at OC-50. Each of these three layers is internally fairly age homogeneous in median shell age, with median ages increasing abruptly across layer boundaries (Figs. 4, 5).
Downcore Changes in Lithology and in Shell Age at Effluent Sites
The two high-sediment accumulation, effluent-site cores comprise, from their bases, bioturbated sandy mud between 60 and 150 cm (PVL5-50) and between 40 and 150 cm (PVL5-75), with dispersed shells and echinoderm debris (layer 3 deposited during the pre-emission phase; per-increment median age is 1000–3000 years). This layer is sharply overlain by a 20-cm-thick black, organic-rich sandy mud with parchment tubes of the detritus-feeding polychaete Chaetopterus and extremely rare molluscan shells and echinoderm ossicles (early-effluent layer 2, 40–60 cm core depth at PVL5-50 and 20–40 cm core depth at PVL5-75). At PVL5-50, Parvilucina shells are absent in the Chaetopterus layer, and several Nuculana shells sampled from its base are 500–1200 years old. This dark Chaetopterus layer at PVL5-50 is overlain by a Modiolus-rich sandy mud (20–40 cm depth). At both sites, the upper 20 cm is a sandy mud rich in the infaunal deposit-feeding polychaete Pectinaria (late-effluent layer 1). Both effluent layers are age homogenized at PVL5-50 (per-increment median age is equal to 17–35 years in layer 2 and 14–91 years in layer 1). In contrast, the effluent layers exhibit stratigraphic order at the legacy-toxicity site PVL5-75: median ages increase monotonically downcore from 15 years at 0–4 cm to 55 years at 16–20 cm and to 80–85 years at 20–30 cm. However, shell ages at this site exhibit disorder at 44 cm, with a few quite young (25–30 years old) Parvilucina shells.
Fitting High-Resolution TRM Models to AFDs
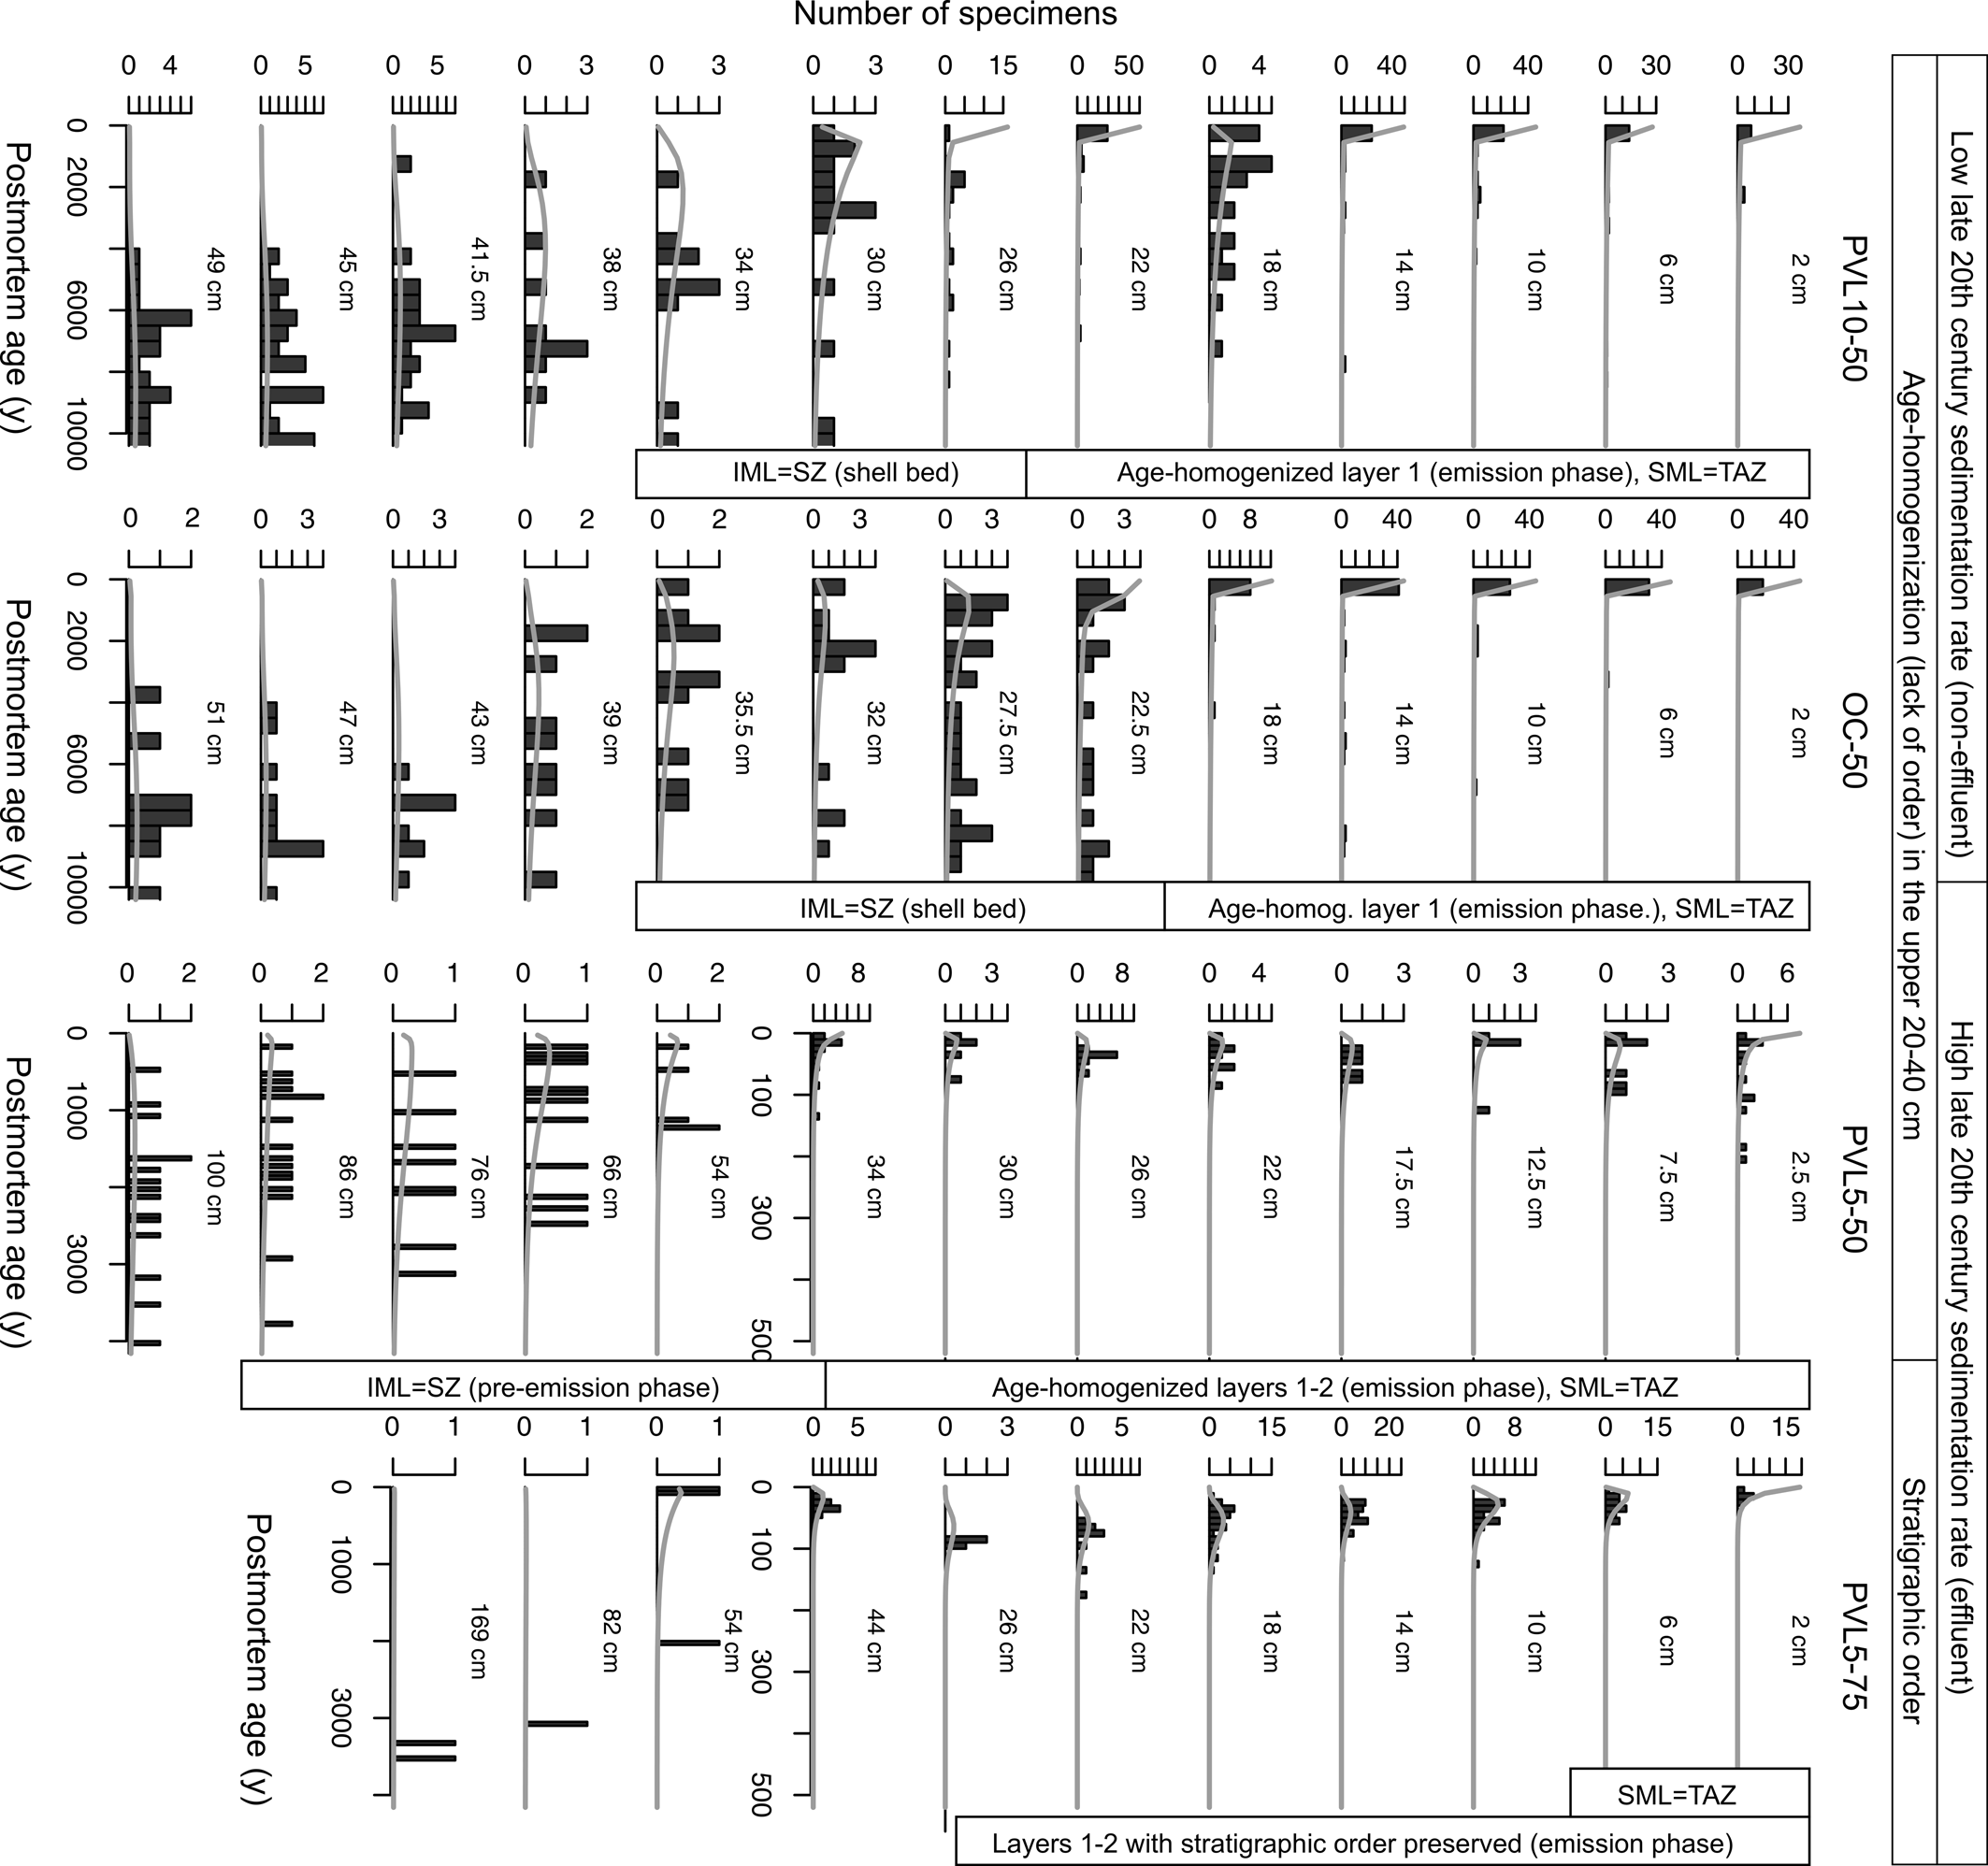
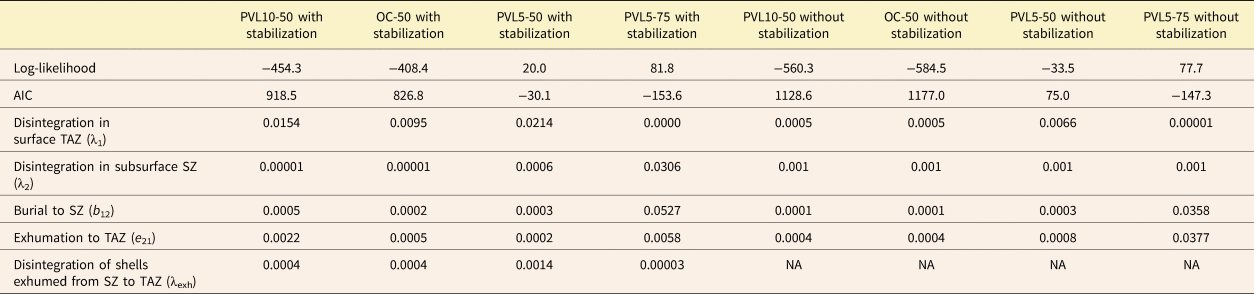
The models with diagenetic stabilization and a single sediment accumulation rate show the best fit to the AFDs at the low-sediment accumulation, non-effluent sites (Table 1), whereas the models without diagenetic stabilization and with two distinct sediment accumulation rates (during the pre-emission and emission phases) show the best fit at effluent sites (Table 1). The models with the best fits capture the downcore shift in the shape of AFDs (Fig. 7), from strongly heavy-right-tailed (L-shaped) AFDs in the surface increments to more symmetric and platykurtic AFDs in the subsurface increments at low-sediment accumulation sites (Fig. 7). The heavy-tailed AFDs are characterized by a mixture of abundant very young (<100 years) cohorts and rare but persistent old cohorts (>1000 years). These older cohorts are common in immediately deeper, pre-emission-phase increments in the 20–40 cm subsurface shell beds (compare Figs. 4 and 7). At the high-sediment accumulation site PVL5-50, the shapes of AFDs in the upper, emission increments are variable: some of these are right-skewed L-shaped AFDs (with some shells older than 200 years) and others are more simple exponential or uniform AFDs (with most shells younger than 50 years). AFDs from the subsurface increments deposited during the pre-emission phase have more symmetric and platykurtic shapes in all cores. At the other high-sediment accumulation, legacy toxicity site PVL5-75, AFDs in the surface increments tend to be right skewed but not heavy tailed and do not contain any cohorts older than 100 years. Few shells were available to date in pre-emission-phase increments from this site.
The high-resolution transition-rate matrices (TRMs) show that the non-effluent (PVL10-50, OC-50) sites are better supported by models with diagenetic stabilization, whereas the effluent sites (PVL5-50, PVL5-75) are better supported by models without diagenetic stabilization. AIC, Akaike information criterion.

Fitting a transition-rate matrix (TRM) model composed of 11–13 layers (gray curves) to the age–frequency distributions (AFDs) observed in 4-cm-thick increments (black histograms) in the four sediment cores does a good job of capturing the downcore shift from the L-shaped AFDs that characterize the upper 20–25 cm (cm labels inside each histogram denote core depth) to the more symmetric and platykurtic AFDs that characterize subsurface increments (sample sizes of deeper increments at PVL5-75 are too small). Note differences in y-axis scales among plots and within the successions at PVL5-50 and PVL5-75, which are the two sites with higher sediment accumulation (and, at PVL5-75, with low twentieth-century bioturbation from DDT). Abbreviations: IML, incompletely mixed layer; SML, surface well-mixed layer; SZ, sequestration zone; TAZ, taphonomically active zone.

Downcore Gradients in Mixing and Disintegration Based on High-Resolution TRM Models
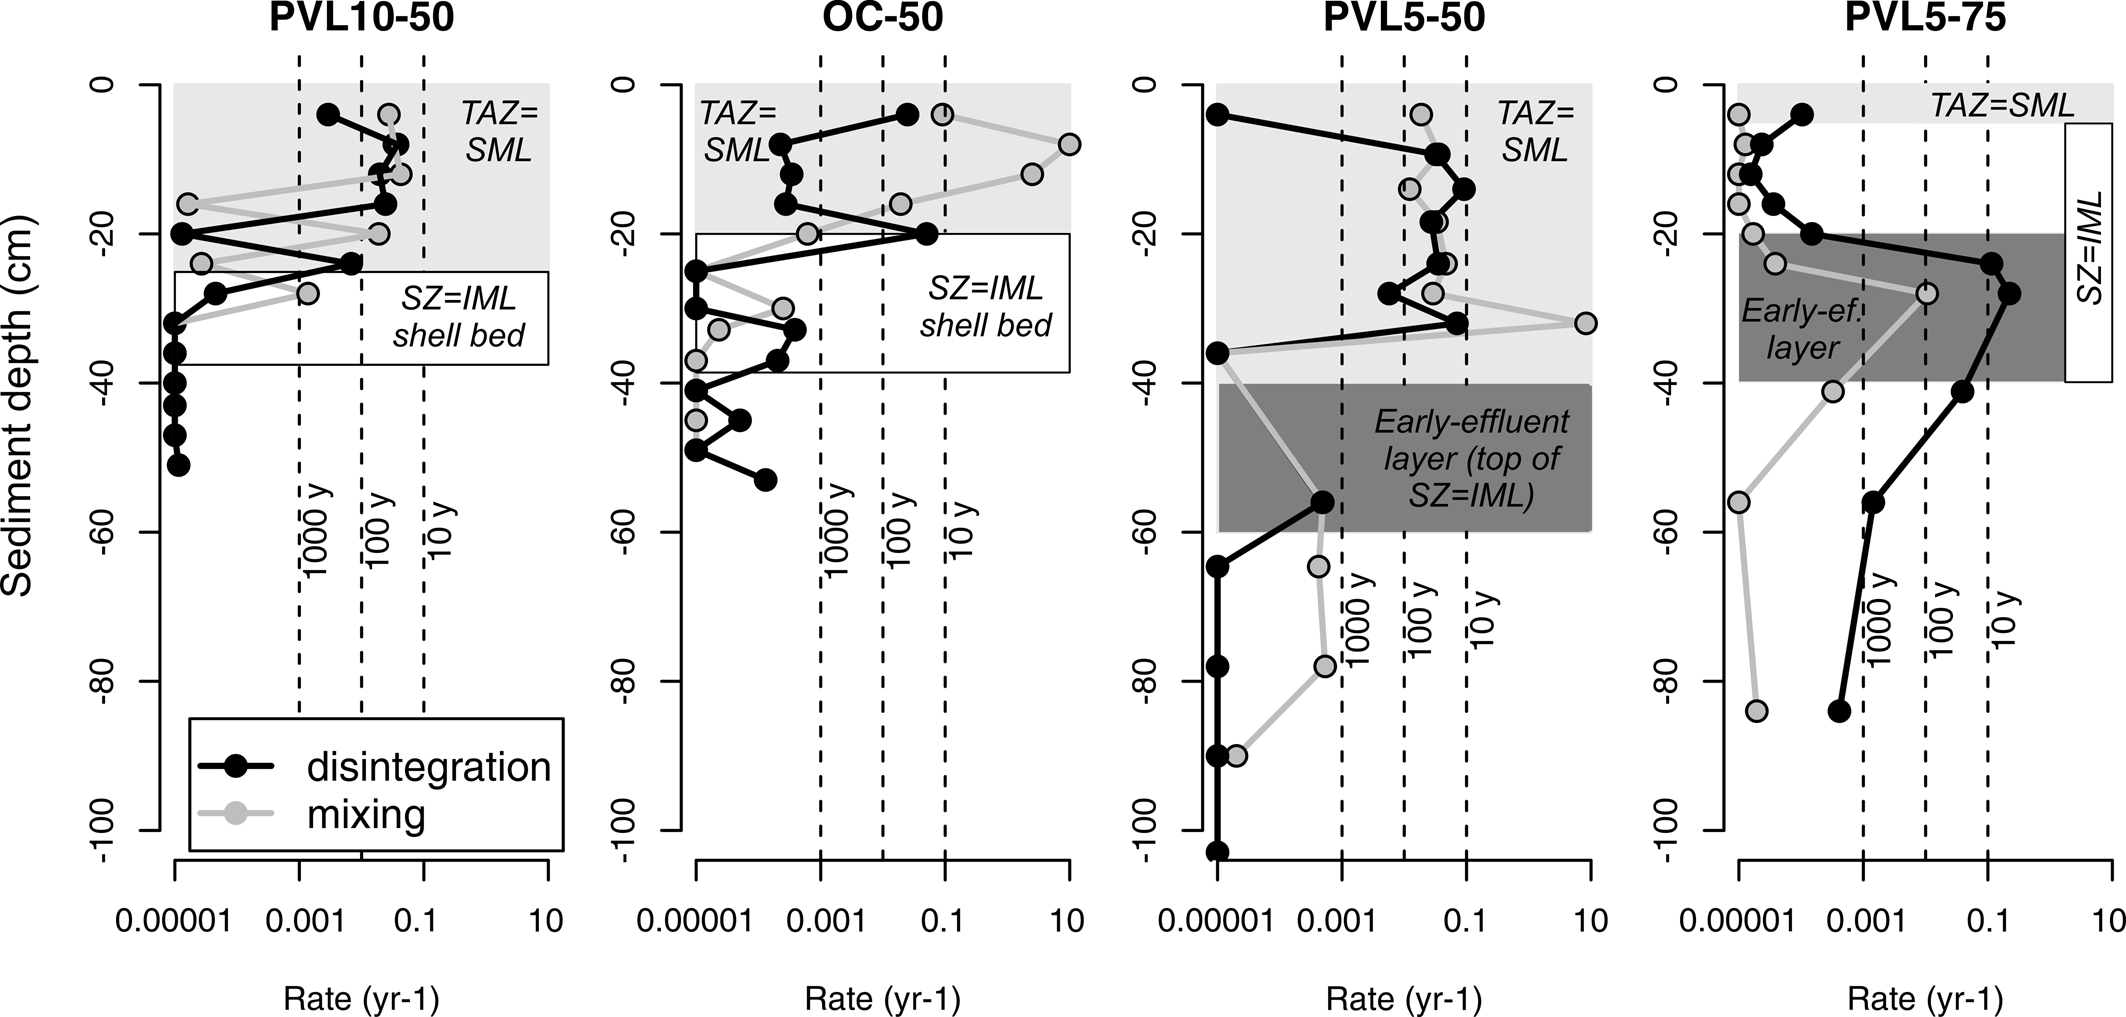
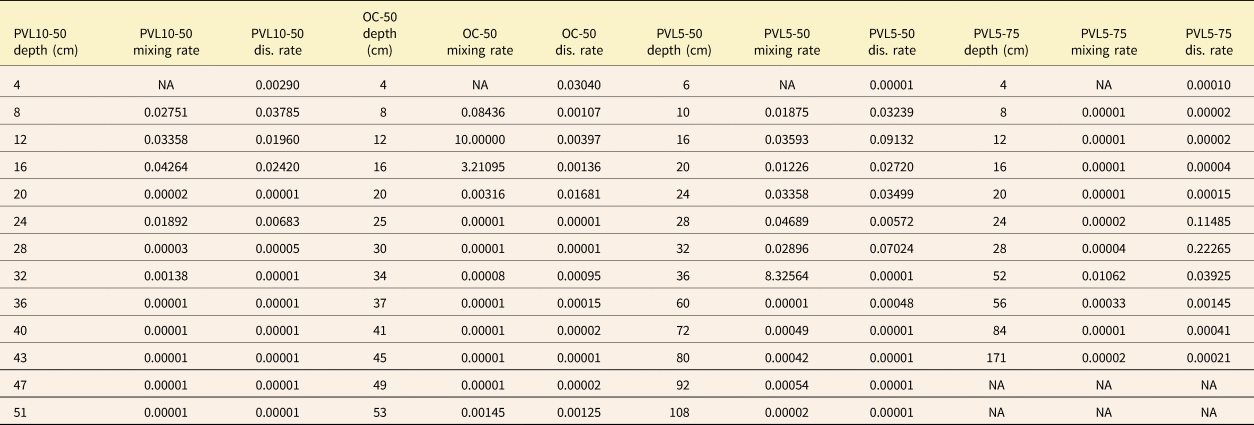
At all sites except PVL5-75, both disintegration and mixing rates are highest and relatively uniform in the topmost decimeters of the cores, and then decline downcore abruptly rather than gradually to negligible values (Fig. 8, Table 2). Rates of disintegration of bivalve shells to non-identifiable fragments exceed 0.1–0.01/yr (decadal to centennial scale) in the surface layer but decline abruptly to rates <0.001/yr at 20–25 cm at both PVL10-50 and OC-50 (coinciding with top of the subsurface shell bed; low sedimentation sites) and at 35 cm at PVL5-50 (high sedimentation), thus defining the depths of the TAZ at those sites. At the same sites, frequency of mixing transitions between the uppermost increment and successively deeper underlying increments are higher in the upper part of the cores, varying between 0.1/yr and 0.01/yr, and decline abruptly to rates <0.0001-1 at the same depth as the base of the TAZ. Estimates of sediment accumulation rates based on the high-resolution TRM resemble estimates based on downcore changes in shell median ages (Table 3).
Downcore decline in mixing (between the uppermost increment and successive underlying increments) and in per-increment disintegration occurs abruptly at 20–25 cm at the low-sediment accumulation PVL5-10 and OC-50 sites and abruptly at 35 cm at PVL5-50 (much higher sediment accumulation rate), indicating that the depth of the taphonomically active zone (TAZ) coincides with the depth of the surface well-mixed layer (SML) at all three sites (light-gray shaded rectangles correspond to the SML as defined using 14C-calibrated amino acid racemization (AAR), dark-gray shaded rectangles correspond to the early-effluent layers). At PVL5-75, with high-sediment accumulation rates but a legacy of DDT poisoning, the uppermost 20 cm of the core (which shows stratigraphic ordering of shell ages) is characterized by low disintegration and low mixing. The underlying 25–60 cm core interval yields higher disintegration and higher mixing, which we interpret as having been induced by nonlocal mixing of young shells down into pre-emission increments. Abbreviations: IML, incompletely mixed layer; SZ, sequestration zone.

Estimates of mixing and disintegration rate (per year) at four sites (non-effluent: PVL10-50, OC-50; effluent: PVL5-50, PVL5-75) with 11–13 increments, estimated on the basis of the high-resolution transition-rate matrices (TRMs), show that both shell disintegration within increments and mixing of shells from the topmost increment decline markedly in the upper 25–40 cm at three sites, except PVL5-75, where disintegration and mixing are very low in the uppermost increments. Mixing rates refer to symmetric mixing between the uppermost increment and the increment at the given sediment depth (cm).

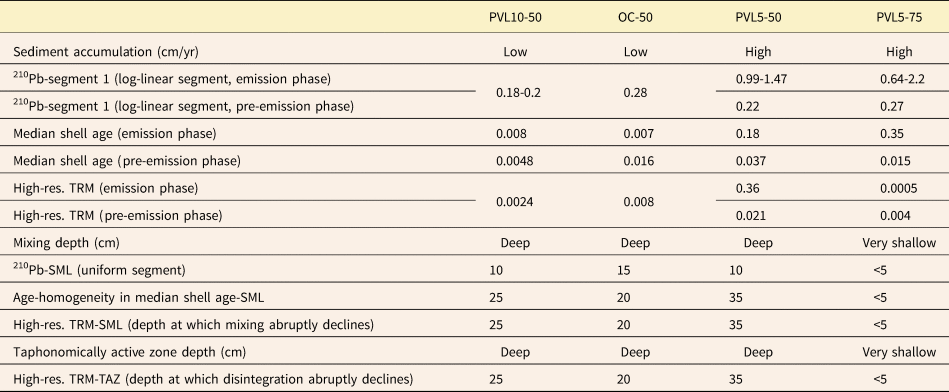
Estimates of sediment accumulation rate and the surface well-mixed layer depth based on different criteria for four sites (non-effluent: PVL10-50, OC-50; effluent: PVL5-50, PVL5-75). Sediment accumulation rate (in cm/yr) estimated on the basis of the high-resolution transition matrices (estimated as the inverse of time [in years] it takes for a shell to be buried into an underlying increment) is scaled relative to the increment thickness in this table. High-res. TRM, high-resolution transition-rate matrix model; SML, surface well-mixed layer; TAZ, taphonomically active zone.

Exceptionally, at the legacy-toxicity site PVL5-75, both disintegration and mixing rates are low in the uppermost 20–40 cm (both λ1 and m are <0.0001; Fig. 8). A spatial gradient thus exists between this site that exhibits unusually low mixing and disintegration within the upper 20–30 cm and the much higher rates found within the upper 20–40 cm at the other three sites. These low-disintegration and low-mixing surface increments at PVL5-75 are underlain by subsurface increments at 20–40 cm core depth characterized by a higher, decadal-scale disintegration rate, which is comparable to that observed in the upper increments of the other three sites; these subsurface increments are also characterized by relatively high nonlocal mixing of shells sourced from the uppermost increments. Below 55 cm, in the pre-emission-phase increments, disintegration and mixing rates drop back to low levels. Notwithstanding these intersite differences in the magnitudes of disintegration and mixing rates and in their downcore trajectories, mixing rates and disintegration rates are positively and significantly rank correlated at all sites. At PVL10-50, the r is 0.82, p = 0.001; at OC-50, r is 0.5, p = 0.09; at PVL5-50, r is 0.75, p = 0.005; and at PVL5-75, r is 0.76, p = 0.01.
Assessing Exhumation by Fitting Low-Resolution TRM Models to AFDs
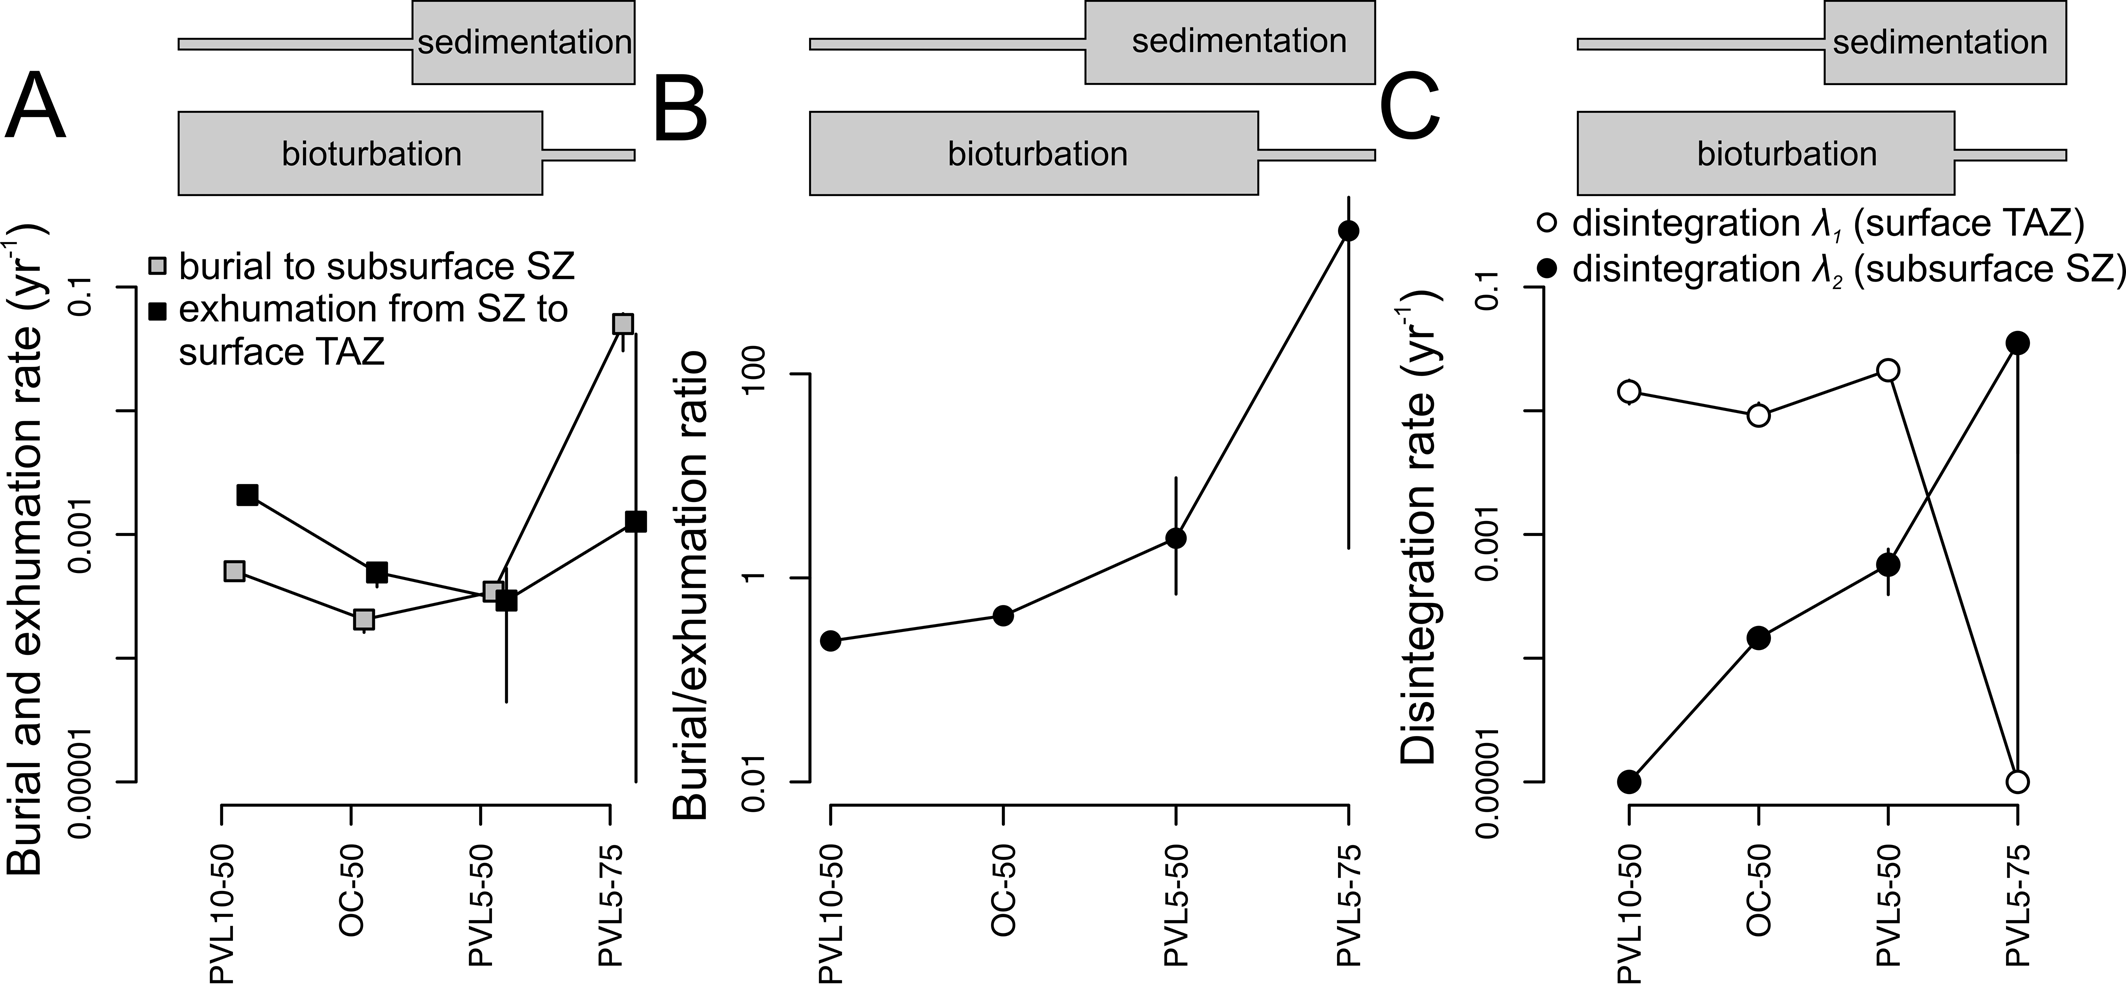
The low-resolution models that can discriminate between the burial and exhumation—that is, permitting asymmetry in mixing—detect spatial variation in exhumation rates, with a major decline in exhumation toward the high-sediment accumulation effluent sites (Fig. 9). Shell exhumation exceeds shell burial at both non-effluent sites (OC-50, PVL5-50), whereas burial equals exhumation at the effluent site PVL5-50, and burial exceeds exhumation at the legacy-toxicity site PVL5-75 (Fig. 9A,B). These results indicate that shell mixing is asymmetric at the non-effluent sites that are characterized by slow sediment accumulation, with old shells brought upward more frequently than young shells are moved downward. Although input of shells from adjacent habitats (“exogenous shells”) is not particularly likely at this water depth, it is possible that some older shells were imported to this site from areas where older strata are located closer to the sediment–water interface or that such a dynamic might be important in other study systems.
Geographic variation in burial, exhumation, and surface and subsurface disintegration among the four coring sites, based on the low-resolution transition-rate matrix (TRM) models with two layers (Fig. 6). A, The rate of exhumation of a shell to a surface taphonomically active zone (TAZ) of the seabed exceeds that of burial to a subsurface sequestration zone (SZ) at PVL5-10 and OC-50, which are characterized by low-sediment accumulation and high bioturbation outside the effluent zone. Inside the effluent zone, exhumation is approximately equivalent to burial at PVL5-50, where effluent deposits are thickest, and is much smaller than burial at PVL5-75 on the margin of the effluent zone, where sediment accumulation was similarly high but burrowers were slower to recover from toxic conditions. B, Same information as A but displayed as a ratio. C, Disintegration rates in the TAZ are similar among the first three sites but very low at PVL5-75, where mixing (bioturbation) is low.

This model also agrees with the results of the high-resolution model on downcore trends in disintegration. First, disintegration does decline from the surface layer to the subsurface layer at PVL10-50, OC-50 (both low-sediment accumulation), and PVL5-50 (high-sediment accumulation; all three have high bioturbation; Fig. 8, Table 3): λ1 values indicate that disintegration proceeds at multidecadal scales in the TAZ and then declines by one to two orders of magnitude to very low λ2 values in the underlying SZ (Fig. 9C, Table 4). In contrast, at the high-sediment accumulation, low-bioturbation site PVL5-75, disintegration λ1 is very low in the surface 20 cm, as also seen in the high-resolution model. Second, diagenetic stabilization occurs in the subsurface layer (SZ) at both of the non-effluent sites and at PVL5-50. At PVL5-75, the surface–subsurface shift in AFD shapes is also better supported by the model with diagenetic stabilization, but the TAZ is effectively absent because λ1 is extremely low.
Model fit and estimates of burial, exhumation, and disintegration rates (per year) at four sites (non-effluent: PVL10-50, OC-50; effluent: PVL5-50, PVL5-75) with two layers (taphonomically active zone [TAZ] and sequestration zone [SZ]), estimated on the basis of the transition-rate matrices (TRMs) of the low-resolution model. Exhumation exceeds burial at the non-effluent sites PVL10-50 and OC-50, whereas burial markedly exceeds exhumation at the effluent site PVL5-75. AIC, Akaike information criterion.

Spatiotemporal Gradients in Sediment Accumulation Rate
All methods of estimating sediment accumulation rate—median shell ages, the log-linear portions of profiles in excess 210Pb, and high-resolution TRMs—indicate that rates in the increments deposited during the pre-emission phase were low at all four sites, both outside the effluent zone (<0.02 cm/yr, OC-50 and PVL10-50) and inside the effluent zone (<0.04 cm/yr, PVL5-50 and PVL5-75). During the 1940s–1970s, sediment accumulation rate increased at the two effluent sites, where a distinct mound is still present. Excess 210Pb profiles from our cores preserved in emission-phase layers 1 and 2 (Fig. 4) indicate that the apparent sediment accumulation rates of effluent fines were ~1–2 cm/yr (Table 3), similar to those found by earlier studies focused on the rate of deposition of the effluent mound (Eganhouse and Pontolillo Reference Eganhouse and Pontolillo2000). Sediment accumulation rates for the emission-phase layers 1 and 2 at our two effluent sites are somewhat smaller when calculated from shell ages and from TRMs, but are still relatively high (Table 3). At the two non-effluent sites, sediment accumulation rates were an order of magnitude lower during the same phase: the log-linear profiles of excess 210Pb (preserved in the lowermost parts of layer 1 and penetrating into the underlying pre-emission-phase layer 2) indicate that fines accumulated at 0.18–0.2 cm/yr at PVL10-50 and 0.28 cm/yr at OC-50. Estimates based on median shell ages in layer 1 or based on high-resolution TRMs are lower by two orders of magnitude (<0.008 cm/yr; Table 3).
Spatial Gradients in Mixing and Disorder in the Increments Deposited during the Twentieth-Century Emission Phase
Downcore profiles in 210Pb and 137Cs and in median shell ages show that the upper 20–40 cm are well mixed at both of the non-effluent sites (OC-50, PVL10-5) and at PVL5-50 from the effluent zone. In contrast, the same three metrics as well as TRMs find that the thickness of the entire mixed layer is very limited at the legacy-toxicity site PVL5-75 (<5 cm in Table 3). PVL5-75 thus represents the site with the least mixing of fine-grained sediment and of shells by bioturbation, differing qualitatively from the other three sites. For example, the thickness of the present-day SML is 10–15 cm at PVL10-50 and OC-50 and is ~8 cm at PVL5-50 when defined on the basis of the vertical or irregular segments in the excess 210Pb activity, whereas the vertical segment in the excess 210Pb is not thicker than few centimeters at PVL5-75 (Fig. 4). Differences in mixing are also evident in the stratigraphic profiles of 137Cs. These peaks are most smeared at the two non-effluent sites (maxima = 0.07–0.09 dpm/g; Fig. 4) and exhibit two muted peaks in the upper part of the Chaetopterus layer at 40 cm and a third peak at 10 cm at PVL5-50 in the effluent zone (maximum 137Cs = 0.13 dpm/g). In contrast, a single high-magnitude 137Cs peak of 0.3 dpm/g occurs at 20–25 cm at the legacy-toxicity site PVL5-75, positioned at the top of the organic-rich early-effluent layer (Fig. 4).
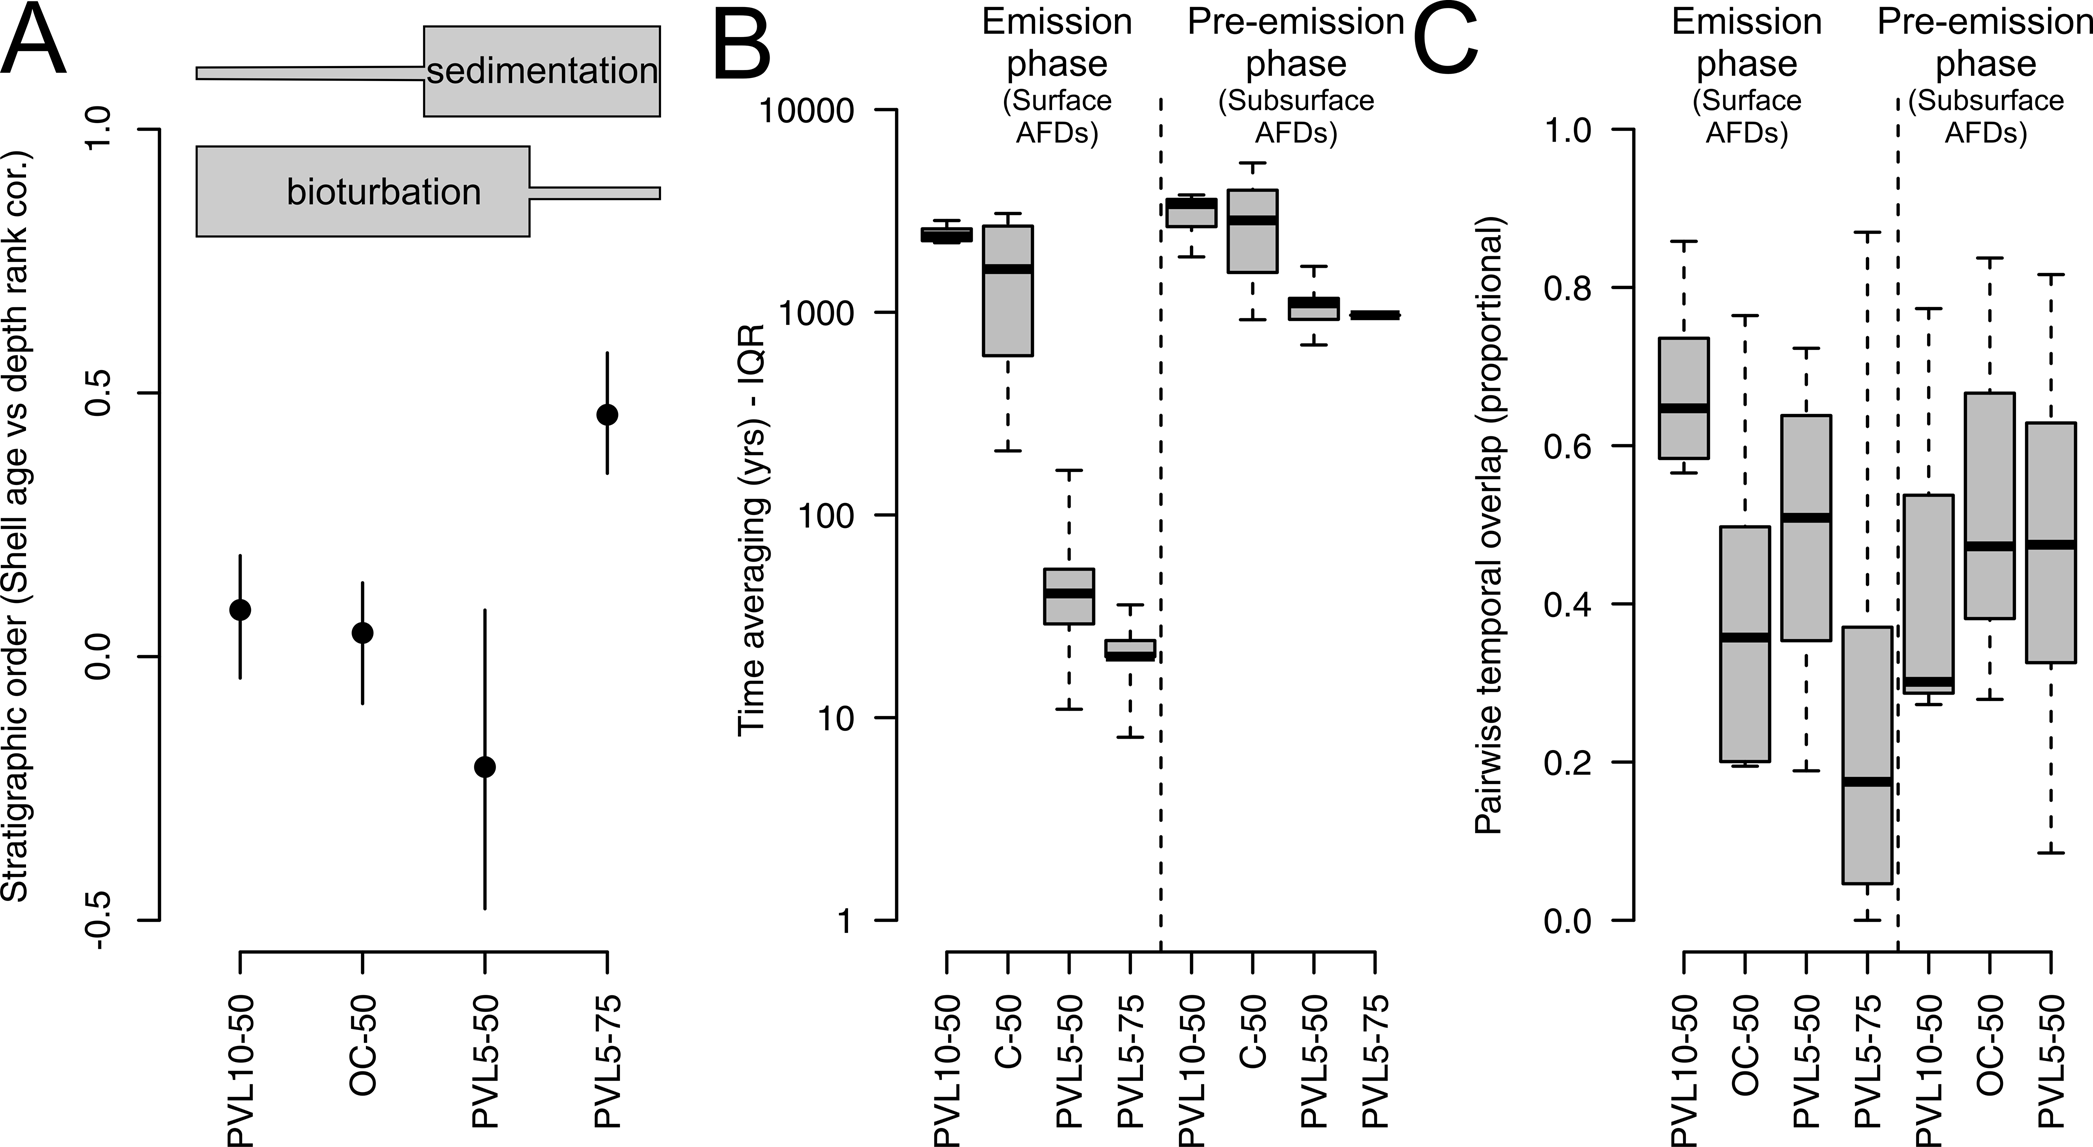
Finally, median shell ages show no downcore increase within the upper 20–25 cm at either of the non-effluent sites (PVL10-50, OC-50) or in the upper 35 cm at PVL5-50 (Fig. 5). Within these upper 20- to 40-cm-thick SMLs, shell median age and core depth thus do not correlate (Spearman rho values of ~0; Fig. 10A). In contrast, shell ages increase downcore and exhibit significantly positive Spearman rank correlation with core depth even within the upper 30 cm at the legacy-toxicity site PVL5-75 (Fig. 10A).
A, Spatial gradient in the stratigraphic ordering of shells within the surface well-mixed layer (SML; top 20–40 cm) defined on the basis of 14C-calibrated amino acid racemization (AAR) ages, as measured by the Spearman rank-order correlation coefficient between a shell age (years) and its stratigraphic position (cm downcore) at four sites. Stratigraphic order is poorly preserved—i.e., incremental assemblages exhibit low temporal distinctness—in all records except at the site with a DDT-created legacy of low bioturbation (PVL5-75). High sediment accumulation rate alone, such as at the PVL5-50 site, thus cannot overwhelm the vertical mixing effects of bioturbation. B, Spatiotemporal gradient in the time averaging of shell assemblages, displayed as the per-increment (error-corrected) interquartile age range (IQR) among the four sites along our gradient (x-axis), both within deposits that accumulated during the phase of wastewater emission in the 1940s–1970s (corresponding largely to the SML, uppermost 20–40 cm; only the PVL5-50 and PVL5-70 received solid sediment from wastewater emissions) and during the pre-emission phase (largely encompassed by the incompletely mixed layer [IML] and historical-layer increments) of each core. Within the emission-phase increments, time averaging is much larger at the low-sediment accumulation sites (PVL10-50, OC-50) than at the high-sediment accumulation sites (PVL5-50, PVL5-75). This spatial contrast is strongly damped among assemblages from the pre-emission increments, which record pre–twentieth century, late-highstand conditions when rates of net sediment accumulation and bioturbation were spatially more uniform. C, Spatiotemporal gradient in the pairwise proportional overlap of increment ages (as measured by their full age–frequency distributions [AFDs]) in sediments from the emission and pre-emission phases. Within emission-phase increments, the smallest temporal overlap detected is at PVL5-75, where mixing is most limited (median overlap = 0.18; site with legacy DDT), and the highest is at PVL10-50 (median overlap = 0.65; scant effluent, intense bioturbation). In pre-emission increments, median temporal overlap varies between 0.3 and 0.5; no value is given for pre-emission increments at PVL5-75 owing to small sample sizes for those age distributions.

Spatial and Temporal Gradients in Time Averaging and in Temporal Overlap
Assemblages in increments deposited during the pre-emission phase—which, on the basis of mixing rates, comprise the IML and some historical layers—extend to 150 cm core depth and exhibit quite small among-site differences in time averaging. The median IQR of these subsurface assemblages is multimillennial at the two non-effluent sites (3420 years at PVL10-50 and 2840 years at OC-50) and is multicentennial or millennial at the two effluent sites (1110 years at PVL5-50 and 970 years at PVL5-75; Fig. 10B).
In contrast, assemblages in the upper 20–40 cm of cores deposited during the emission phase exhibit a strong spatial gradient in time averaging, associated with the spatial gradient in sediment accumulation and biomixing. The median per-increment IQR of these shell assemblages ranges from millennial scale in the non-effluent zone (2370 years at PVL10-50 and 1630 years at OC-50) to decadal to centennial scale at PVL5-50 inside the effluent zone (40 years, range = 11–170 years), and yearly to decadal scale at the legacy-toxicity PVL5-75 site inside the effluent zone (20 years, range 8–36 years; Fig. 10B).
A strong spatiotemporal gradient also exists in the pairwise temporal overlap among increments both within the layers deposited during the emission and the pre-emission phase (Fig. 10C). The smallest overlap between adjacent increments is detected within the emission phase (effluent) layer at PVL5-75 (median overlap = 0.18), where sediment accumulation is high and bioturbation is low. The median temporal overlap among emission-phase increments at the other three sites, all characterized by high mixing but different sediment accumulation rates, varies between 0.35 and 0.65 (Fig. 10C). The median temporal overlap of assemblages from pre-emission-phase increments, when sediment accumulation and mixing rates would have been spatially homogeneous, shows little variation among sites (0.30–0.65), although shells from the pre-emission record at PVL5-75 were too scarce for calculation.
Discussion
Biomixing and Bioirrigation Boost Disintegration
Shell disintegration and mixing can be patchy both temporally and spatially within mixed layers (e.g., Zhu and Aller Reference Zhu and Aller2013). However, an overall downcore decline in disintegration and mixing is still expected owing to a downcore decrease in biological activity and O2 penetration. The many processes affecting disintegration that decline downcore include durophagous predation and other bioerosion that typically occur at or near the sediment–water interface (Parsons-Hubbard et al. Reference Parsons-Hubbard, Callender, Powell, Brett, Walker, Raymond and Staff1999; Walker and Goldstein Reference Walker and Goldstein1999; Wapnick et al. Reference Wapnick, Precht and Aronson2004); microbial maceration of shells that would be fastest in the surficial aerobic zone (Simon et al. Reference Simon, Poulicek, Velimirov and MacKenzie1994); and dissolution that to a first order would decline along with the decline in pore-water carbonate saturation (e.g., Aller Reference Aller1982, Reference Aller2004; Swift et al. Reference Swift, Stull, Niedoroda, Reed and Wong1996; Olszewski Reference Olszewski2004). That undersaturation is related to metabolic CO2 produced by aerobic organic matter degradation and the reoxidation of reduced species produced by anaerobic mineralization, especially sulfides. In subtidal granular seabeds, these biogeochemical processes typically occur just below the sediment–water interface, above or within the spatially and temporally variable redox interface. Additional diagenetic reactions such as methanogenesis that are antagonistic to shell preservation can also reduce pore-water saturation state, especially below the entire mixed layer (Munnecke et al. Reference Munnecke, Wright and Nohl2023). However, on the southern California shelf, our scenario where disintegration tends to decline downcore and where disintegration and bioturbation are tightly coupled is supported here by transition-rate modeling of the entire mixed layer. Namely, (1) disintegration and mixing are uniformly high in the uppermost decimeters, (2) the declines in disintegration and mixing are abrupt rather than gradual, and (3) these abrupt declines in disintegration and mixing occur at the same depth.
Although biomixing alone can either decrease (rapidly sequester shells below the TAZ) or increase carbonate disintegration (maintain shells within or exhume them to the TAZ), and biomixing can reduce O2 penetration rather than extending it downcore (e.g., Van de Velde and Meysman Reference Van De Velde and Meysman2016; Tarhan et al. Reference Tarhan, Zhao and Planavsky2021), the positive coupling between disintegration and mixing observed in southern California ultimately reflects conditions where bioirrigation is necessary but insufficient in inducing disintegration, and its association with significant sediment mixing ultimately leads to fast carbonate disintegration. For example, during the emission phase in southern California, the nonlocal deposit-feeding echiuroid polychaete Listriolobus (the spoon-shaped burrows in Fig. 2) that colonized the effluent mound at high abundances in the 1970s contributed to both mixing and irrigation (Stull et al. Reference Stull, Haydock and Montagne1986b). In contrast, the opposite is not necessarily true, as the chemosymbiotic infaunal bivalves (Solemya, Parvilucina, Thyasira, Lucinoma; Fig. 2) that have been abundant since then (Fabrikant Reference Fabrikant1984; Stull et al. Reference Stull, Haydock, Smith and Montagne1986c) tend to be stationary and thus can boost sediment bioirrigation and sulfide oxidation without significant biomixing.
The strong coupling between mixing and disintegration is also supported by the relative depths of the TAZ and redoxcline. The base of the TAZ is at 20–40 cm on this shelf (similar to the 20–40 cm depth observed in sediment cores from the northern Adriatic Sea; Tomašových et al. Reference Tomašových, Gallmetzer, Haselmair and Zuschin2022), but this depth exceeds the ~5–10 cm depth of the redoxcline observed at these same sites. Disintegration can thus occur at places where the redoxcline is pushed deeper along burrow boundaries, as also observed by Aller (Reference Aller1994). The low disintegration rates in the underlying IML indicate that the frequency of irrigation and sulfide oxidation at those depths is apparently too low to trigger significant dissolution. In contrast, the downcore decline in disintegration at the two non-effluent sites, coinciding with the abrupt increase in median age, matches the boundary between the shell-poor surficial zone and the subsurface shell bed. High abundance of molluscan remains in shell beds can partly buffer pore-water pH and reduce net carbonate dissolution, and thus shallow the base of the TAZ (Tribble Reference Tribble1993; Tomašových and Schlögl Reference Tomašových and Schlögl2008; Lange et al. Reference Lange, Krause, Ritter, Fichtner, Immenhauser, Strauss and Treude2018; Sulpis et al. Reference Sulpis, Agrawal, Wolthers, Munhoven, Walker and Middelburg2022; van de Mortel et al. Reference van de Mortel, Delaigue, Humphreys, Middelburg, Ossebaar, Bakker, Alexandre, van Leeuwen-Tolboom, Wolthers and Sulpis2024).
At the high-sediment accumulation, low-bioturbation PVL5-75 site, some dissolution does occur in surface sediments. For example, articulated valves of dead Parvilucina individuals are softened and chalky and live-collected individuals of Parvilucina archived by the Los Angeles County Sanitation Districts exhibit in vivo dissolution of outer layers on their external umbones. However, the processes contributing to this partial dissolution were not sufficiently great to lead to the loss of taxonomic identifiability of dead Parvilucina individuals, and so the overall disintegration rate is not enhanced: disintegration at this site is in fact slower than the decadal-scale values typical of other sites (and slower than in other bioturbated shelf environments; e.g., Tomašových et al. Reference Tomašových, Gallmetzer, Haselmair, Kaufman, Mavrič and Zuschin2019a, Reference Tomašových, Gallmetzer, Haselmair and Zuschin2022). Parvilucina here and elsewhere is most abundant living at sediment depths between 0 and 6 cm but can burrow up to 18 cm (Swift et al. Reference Swift, Stull, Niedoroda, Reed and Wong1996). However, lucinids are generally slow burrowing or almost stationary (Jones and Thompson Reference Jones and Thompson1984; Hickman Reference Hickman1994), and thus their total effect on mixing sedimentary particles, including shells, is smaller than that of more actively burrowing infaunal organisms (such as the infaunal echinoids illustrated in Fig. 2). The effective absence of a TAZ at PVL5-75 thus indicates that bioirrigation is, by itself, not sufficient to significantly increase the disintegration of this ecologically important and relatively thick-shelled taxon, even though dissolution alone might still lead to significant loss of mollusks that are smaller or thinner than Parvilucina. Death assemblages forming in sediments affected by bioirrigation but not subjected to biotic or physical mixing thus can remain relatively intact and weakly time averaged.
The Transitional IML as a Source of Old, Diagenetically Stabilized Shells Encountered in the SML
Although the base of the TAZ does not extend deeper than 20–25 cm at the non-effluent sites and is not thicker than 40 cm at the effluent sites, bioturbation is still able to move shells upward and downward below the base of the TAZ/SML. This movement is documented by the left tail of very young shells in AFDs collected from the IML (or transitional layer), as well as by the presence of some very old shells in AFDs from the SML. Shells residing in the IML—an effective SZ—are the most likely source of old shells encountered in the TAZ: the shells that form the long right tail of old shells in the SML at PVL10-50 and OC-50 (with ages ranging up to ~5000 years), and to some degree also in the SML at PVL5-50 (with ages ranging up to ~500–1000 years), belong to the same age cohorts that have their maximum abundance in the deeper, 20–60 cm (IML) core increments at those same sites (Fig. 7). The SZ at these three sites on the southern California shelf is located in the subsurface (IML) increments below the 20- to 40-cm-thick SML. In contrast, at the legacy-toxicity PVL5-75 site, where sediment accumulation is relatively high and exhumation of shells by burrowers is low, the SZ effectively exists within surface sediments, with the SML and TAZ not thicker than ~5 cm.
Time averaging of skeletal remains requires both opportunity, that is, high mixing and/or low sediment accumulation, and means, that is, skeletal remains must be supplied (from production locally or in nearby habitats) and able to avoid disintegration if the full duration of time averaging is to be realized. Diagenetic stabilization of temporarily or permanently buried shells in the subsurface SZ is one long-suspected means of increasing the persistence of shells exhumed back to the TAZ through Ostwald ripening (crystallite coarsening), mineral coatings, or micritization both in siliciclastic and carbonate environments (Jenkyns Reference Jenkyns, Hsü and Jenkyns1975; Kidwell Reference Kidwell1989; Reid et al. Reference Reid, MacIntyre and James1990; Rivers et al. Reference Rivers, James and Kyser2008; Tomašových et al. Reference Tomašových, Kidwell, Barber and Kaufman2014; Munnecke et al. Reference Munnecke, Wright and Nohl2023). This stabilization can take place either in the IML or below it, wherever shells are not exposed to O2, so that pore-water alkalinity can increase via anaerobic degradation of organic matter and/or alkalinity can be sourced by downward flux of bicarbonate ions from carbonate dissolution in the TAZ. Because shells below the TAZ will exhibit negligible disintegration rates regardless of whether they have been diagenetically stabilized, the detection of diagenetic stabilization requires that AFDs in the TAZ incorporate shells exhumed from the SZ. The presence of unusually old shells close to the sediment–water interface (forming the long right tails of AFDs) and the slow disintegration of exhumed shells (as opposed to younger shells that did not reside in the SZ) at non-effluent sites indicate that some diagenetic stabilization takes place in favorable microenvironments already within the IML.
Access to old shells residing in the IML should be relatively easy for bioturbators at the non-effluent sites owing to very slow sediment accumulation: the shell bed that contains relatively old shells is located only 20–25 cm below the sediment–water interface, which is at the base of the SML. That shell bed is thus protected from most burrowers that might disperse shells upward, and might in part reflect concentration from the preferential upward movement of fines (biogenic stratification sensu Meldahl [Reference Meldahl1987]), but it is still well within the reach of deeper burrowers (i.e., those characterizing the IML). A similar situation exists in the inner shelf of the northeastern Adriatic Sea, where storm reworking is more frequent. There, subsurface shell beds preserved at either 10–30 cm or 90 cm core depths were formed under slow net accumulation (sediment winnowing and bypassing during maximum postglacial flooding) combined with high productivity of mollusks and bryozoans. The Adriatic subsurface shell beds represent a primary source of the very old shells that now occur in the surficial TAZ and differ from younger shells by being coated with early-diagenetic micro-cements (Tomašových et al. Reference Tomašových, Gallmetzer, Haselmair, Kaufman, Mavrič and Zuschin2019a, Reference Tomašových, Gallmetzer, Haselmair and Zuschin2022; Nawrot et al. Reference Nawrot, Berensmeier, Gallmetzer, Haselmair, Tomašových and Zuschin2022).
Even though diagenetic stabilization is supported by our transition matrix modeling, it does not always attain a magnitude to create a long right tail of old shells. The effluent sites on the southern California shelf provide examples. Slow disintegration is implicated at the high-bioturbation PVL5-50 site on the basis of the low-resolution TRM, but not on the basis of the high-resolution TRM, and diagenetic stabilization of shells below the SML has had little effect on AFDs in the SML at effluent sites. At both effluent sites, older shells are located deeper than 40–60 cm, well below the reach of nonlocal burrowers, and the IML increments (early-effluent layer) are moreover shell-poor, a legacy of highly polluted past conditions. Under these conditions, shells are thus exhumed infrequently up into the SML or not at all, especially given the low mixing rates at the legacy-toxicity PVL5-75 site. Such dynamics can translate to the fossil record, where underlying strata are shell-poor owing to sediment dilution, fast disintegration in the TAZ, and/or ecological limits on abundance.
The Downcore Decline in Time Averaging Reflects a Combination of Mixing Effects (Null Model) and Historical Changes in Both Sediment Accumulation and Mixing
In our earlier work on cores from southern California (Tomašových et al. Reference Tomašových, Kidwell and Dai2023), we found that the downcore increase in time averaging (normalizing and flattening of AFDs) was expected from the effects of bioturbation acting on skeletal remains transiting toward the historical layer alone (Tomašových et al. Reference Tomašových, Kidwell and Dai2023). This same trend has been observed in other core-based studies of bivalve assemblages from coastal environments (estuaries, back-reef and other lagoons; Kosnik et al. Reference Kosnik, Kaufman and Hua2013; Olszewski and Kaufman Reference Olszewski and Kaufman2015; Dominguez et al. Reference Dominguez, Kosnik, Allen, Hua, Jacob, Kaufman and Whitacre2016) and the open shelf (Tomašových et al. Reference Tomašových, Gallmetzer, Haselmair, Kaufman, Mavrič and Zuschin2019a, Reference Tomašových, Gallmetzer, Haselmair and Zuschin2022). This trend thus does not require a temporal change in sediment accumulation or mixing—although such changes could produce it—and is thus a null model. The L-shaped, right-skewed AFDs that characterize the SML—both here and pervasively in shallow-marine settings (Kidwell Reference Kidwell2013) dominated by very young shells—acquire a left tail and thus a more symmetric shape as they enter the transitional IML: assemblages at depth acquiring a subset of young shells that have been injected from surface increments through bioturbation-induced burial (Tomašových et al. Reference Tomašových, Kidwell and Dai2023; see also Olszewski Reference Olszewski2004; Terry and Novak Reference Terry and Novak2015). The distinctive right tail in the AFDs of surface (SML) assemblages and the well-defined left tail in the AFDs of subsurface (IML) assemblages (Fig. 7) indicate that both burial and exhumation of shells by burrowers modulate the shape of subsurface AFDs. The low-resolution TRM models further indicate an asymmetry between exhumation and burial, as exhumation exceeds burial at the non-effluent sites with slow sedimentation.
The simple null model that does not invoke any temporal change in sedimentation or mixing can fully account for the downcore increase in time averaging at the two non-effluent sites, where the increase in IQRs is only a few-fold (Fig. 10, Table 5). At the two effluent sites where sediment accumulation is known to have increased by more than two orders of magnitude in the twentieth century and where bioturbation was locally strongly suppressed by sediment toxicity for decades (PVL5-75), the downcore increase in time averaging still exists but is much magnified beyond that predicted by the null model: time averaging increases by two orders of magnitude when passing from the effluent layers downward into the layer deposited during the pre-emission phase, as expected when pre-emission phase sediment accumulation was smaller by two orders of magnitude (Fig. 10). At the non-effluent sites, the null model predicts that the combination of high disintegration rates in the TAZ coupled with slow sediment accumulation can generate a marked decline in time averaging by a few orders of magnitude between the SML and IML (see Tomašových et al. Reference Tomašových, Kidwell and Dai2023: fig. 7). However, where disintegration rates are small, as at PVL5-75, the decline in time averaging predicted by the null model would be smaller than by two orders of magnitude. The downcore decline in time averaging at this site thus cannot be fully accounted for by the null model and rather can be also explained by a temporal decline in mixing driven by wastewater contamination of sediments.
Mean ages (in calibrated years relative to time of sampling in 2012) and time averaging of increments (fit to high-resolution transition-rate matrices [TRMs]) based on the 14C-calibrated amino acid racemization (AAR) ages of Nuculana taphria and Parvilucina tenuisculpta, a simplified age model (avoiding stratigraphic disorder and informed also by 210Pb), and raw and error-corrected interquartile age ranges (years).

The Spatial Gradient in Time Averaging Related to Sediment Accumulation and Mixing Rates
Time averaging in surficial death assemblages on the southern California shelf varies by two orders of magnitude and quantitatively matches the difference in twentieth-century sediment accumulation rates between the two non-effluent sites (~0.01 cm/yr), which were beyond the direct impact of wastewater emissions, and the two effluent sites (~1 cm/yr), which were in the solid-sediment effluent zone of an outfall. This spatial difference in sediment accumulation is similar in magnitude to that observed temporally at the effluent sites, where cores include low-sediment accumulation pre-emission-phase layers that are overlain by high-sediment accumulation emission-phase layers (Table 5). During the pre-emission phase, the spatial gradient in time averaging along this shelf was weaker: time averaging of ~1000 years at effluent sites was smaller by just a factor of two relative to time averaging of ~3000 years at non-effluent sites (Fig. 10B), and all sites experienced relatively low rates of native sediment accumulation. Similar spatiotemporal variability in time averaging can be expected to be found in other modern and ancient settings that vary in sediment accumulation in time and space.
The southern California shelf includes 20- to 25-cm-thick subsurface shell beds at the two non-effluent sites (layer 2 in Fig. 4). The downcore distributions of shell ages indicate that these shell beds formed under a phase of very slow sediment accumulation (~0.01 cm/yr) and correspond to a hiatal concentration sensu Kidwell (Reference Kidwell, Allison and Briggs1991). The hiatal conditions were most likely dynamic bypassing rather than sediment starvation, given the middle-shelf position, that is, above the wave base of extreme storms that permit winnowing of fines; the muddy siliciclastic matrix includes fine sand, which would have been delivered in traction during the waning phases of storms. The contrast between relatively slow long-term (14C-based, multicentennial, millennial) and faster short-term (210Pb-based, decadal) estimates of sedimentation on the pre-effluent shelf (~0.2–0.3 cm; Alexander and Lee Reference Alexander and Lee2009) indicates erosional removal of sediment, most likely via low-frequency storm winnowing of the transient, relatively water-rich, and fine-grained sediment top (e.g., model of Sadler [Reference Sadler1993]). The long-term accumulation of these shell beds thus likely integrated across conditions characterized both by phases with higher sedimentation and by phases with stronger bypassing and winnowing.
Time averaging also varies with mixing rate, here mainly determined by bioturbation. Within the effluent zone, where both sites experienced similarly high sediment accumulation rates (Table 3), the contrast between centennial and decadal scales of time averaging within surficial death assemblages has been triggered primarily by the contrast in bioturbation: if anything, sediment accumulation is slightly higher at PVL5-50, where time averaging is larger. The sites that are closest to the outfall, at 50–60 m water depth (including our station PVL5-50), were densely colonized by the deep-burrowing, conveyor belt–feeding echiurian worm Listriolobus pelodes in 1970s, whereas this species was absent in deeper-water parts of the effluent mound (Stull et al. Reference Stull, Haydock and Montagne1986b). The 2-cm-diameter burrows of Listriolobus extended to 6 cm below the sediment–water interface on average and to 15–20 cm at maximum, thus contributing to intense sediment mixing and bioirrigation at PVL5-50 but not at legacy-toxicity PVL5-75. The absence of such mixing at PVL5-75 is thus the most likely explanation for the preservation of stratigraphic order and the much lower time averaging of shells, in contrast to the other effluent site (PVL5-50; Table 5).
Turning this around, we infer that time averaging will increase with increasing bioturbation, even though disintegration covaries positively with mixing: a geographic decline in mixing will lead to the spatial decline in time averaging, as observed over time among the increments deposited during the emission phase at the effluent sites. This finding is further evidence that the negative effect of bioirrigation on time averaging—by increasing shell disintegration—is overwhelmed by the positive effects of sediment accumulation and biomixing. Because the thickness of the entire mixed layer on the southern California shelf is greater than that of the TAZ (i.e., a transitional IML exists below the TAZ that coincides with the SML) and because SMLs tend to be deeper than the depth of redoxcline in most marine settings (e.g., Teal et al. Reference Teal, Parker and Solan2013; this study) shells can become sequestered below the TAZ and can be moved vertically into and within the IML. The corollary of this dynamic is that, although more intense bioirrigation can increase disintegration rates as it makes pore-waters of the surface TAZ more corrosive, disintegration rates in the subsurface IML (that corresponds to the SZ) are much lower, thus allowing for longer residence time and higher time averaging of shells in the subsurface layers of the IML than in the SML.
We stress that these positive effects of biomixing may not always outweigh the negative effects of bioirrigation, even in modern-day systems that are part of the same evolutionary fauna. For example, where overlying waters are colder or more acidic and thus less saturated with respect to calcium carbonate, or where a combination of high organic input and ventilation fuels higher (aerobic) benthic respiration than in southern California, bioirrigation should promote much higher disintegration rates and thus might overcome the positive mixing effects of bioturbation. Such conditions might occur in some Arctic seabeds where preliminary data indicate little time averaging despite low sedimentation and high bioturbation (Meadows et al. Reference Meadows, Grebmeier and Kidwell2023). Year-round and especially deep bioturbation and irrigation of tropical carbonate shelves might also curtail time averaging compared with counterpart siliciclastics, as in Caribbean Panama, owing to heightened carbonate dissolution (Kidwell et al. Reference Kidwell, Best and Kaufman2005; Best et al. Reference Best, Ku, Kidwell and Walter2007). Nonetheless, shallow-marine siliciclastic seabeds under normoxic, saturated, or supersaturated mesotrophic waters as on the southern California open shelf are common, both in modern and ancient settings, and so we suggest that our finding that the effects of biomixing on time averaging outweigh those of bioirrigation will apply fairly broadly.
Implications: Bioturbation Increases Time Averaging
Discriminating whether the thickness of the TAZ (where disintegration rates are highest) coincides with the thickness of the entire mixed layer (where vertical mixing of shells is possible) is important for paleoecological evaluation of how Phanerozoic changes in the depth and intensity of bioturbation might have affected the time averaging of fossil assemblages, with implications for assemblage-level alpha and beta diversity (Bush and Bambach Reference A. M. and Bambach2004; Tomašových and Kidwell Reference Tomašových and Kidwell2010; Brasier et al. Reference Brasier, Antcliffe, Callow, Allison and Bottjer2011; Gougeon et al. Reference Gougeon, Mángano, Buatois, Narbonne and Laing2018; Finnegan et al. Reference Finnegan, Gehling and Droser2019). A major increase in sediment mixing by bioturbation has likely occurred at least since the Cretaceous (Thayer Reference Thayer, Tevesz and McCall1983; Zhang et al. Reference Zhang, Fan and Gong2015; Buatois et al. Reference Buatois, Mángano, Desai, Carmona, Burns, Meek and Eglington2022). Wright and Cherns (Reference Wright and Cherns2016) suggested that an increase during the early Paleozoic in the depth and degree of bioturbation would have increased the depth of the redoxcline, thus leading to the deepening of the TAZ as well as of the SML. Such an increase in bioturbation can deepen the locus of early calcite cementation within the sediment and/or increase its patchiness and can also reduce the preservation potential of thin and weakly averaged event shell beds, which are common in the pre-Cenozoic stratigraphic record (Sepkoski et al. Reference Sepkoski, Bambach, Droser, Einsele, Ricken and Seilacher1991; Kidwell and Brenchley Reference Kidwell and Brenchley1994).
The observed secular increase in bioturbation can, however, be expected to have dual effects on the residence time of shells in surface increments and thus on their time averaging. Increasing disintegration rates via stronger bioirrigation should reduce the median residence time of shells in the subset of the mixed layer that coincides with the TAZ, and the positive correlation between mixing and disintegration (Fig. 8) observed at each of our sites supports this expectation. On the other hand, increasing the thickness of the entire mixed layer (deepening the SML and/or adding an IML) will increase the residence time of shells in a stratigraphic increment below the TAZ because some shells can achieve a temporary refuge and can become diagenetically stabilized in deeper IML. If an evolutionary increase in the depth of bioturbation also increases the distinction between the SML and the IML—for example, deep, nonlocal feeders become increasingly abundant, diverse, or environmentally widespread—then this partitioning would induce sequestration, allowing the buildup of strongly time-averaged assemblages below the TAZ, with normal-shaped and platykurtic AFDs, as we see in the IML today. It would thus also promote more time-averaged, albeit L-shaped, AFDs in the TAZ via exhumation of shells that had been diagenetically stabilized during residence in the SZ.
Relevant to these long-standing uncertainties in the time averaging of deep-time fossil assemblages—are they more or less time averaged than modern Holocene assemblages?—we find in the southern California open shelf that, first, in the absence of exhumation to the sediment–water interface, bioirrigation alone did not lead to large-scale dissolution of molluscan shells. Second, despite finding a positive covariation between mixing and disintegration, time averaging is ultimately higher at sites that experience the higher rates of shell mixing promoted by burrowers: a temporal decline in mixing by bioturbation leads to a decrease in time averaging, as does a spatial decline. The positive effects of increasingly intense and deep bioturbation on the time averaging of shells, providing spatial or temporal sequestration refugia from the corrosive conditions in the TAZ, thus outweigh the negative effects of greater bioirrigation of substrata occupied by shelly macrobenthos on the southern California shelf.
The net effect of bioturbation—as it increases over ecological or evolutionary time or along spatial gradients—can thus be to increase the extent of time averaging of fossil assemblages rather than decrease it. On the normoxic, warm-temperate, siliciclastic southern California shelf, encompassing areas of both high and low sedimentation and both high and suppressed bioturbation, the net effect of bioturbation is clearly to increase time averaging. Studies quantifying bioturbation and disintegration in other settings, such as seagrass ecosystems affected by rhizome respiration or affected by deep crustacean burrows, or areas subject to hypoxia or sustained very rapid sedimentation, would be valuable to further test this conjecture actualistically.
Conclusions
This analysis of empirical field data on how bivalve shell AFDs change in shape downcore applies TRM models to quantify how rates of disintegration and mixing vary with depth below the sediment–water interface throughout the entire mixed layer. It thus permits us to assess, for the first time, how disintegration varies with bioturbation and what the net consequences of bioturbation are for time averaging under real-world field conditions. We focus on an open siliciclastic shelf to maximize the relevance to deep-time shallow-marine fossil records and use sediment cores acquired along anthropogenic gradients of sediment accumulation and bioturbation created by twentieth-century wastewater pollution to explore the effects of rates that are beyond the scope or ethics of experimental manipulation.
We find, first, that, on the southern California shelf, the rate of shell disintegration is high in the uppermost part of the seabed but declines sharply at 20–25 cm at sites with low-sediment accumulation rates and at 40 cm at sites with higher sediment accumulation. This base of the TAZ coincides with the depth of the SML, that is, the surficial increment of the seabed characterized by the most intense mixing of sediment and shells. At the base of this layer, shell AFDs shift from having a strongly right-skewed, heavy-tailed (“L”) shape, dominated by recently input shells—these are the dead-shell assemblages that are the primary focus of actualistic studies—to AFDs having a more symmetric and flatter shape below the TAZ/SML, a transition in AFD shape that has been observed in other temperate and tropical environments (Kosnik et al. Reference Kosnik, Hua, Jacobsen, Kaufman and Wüst2007; Olszewski and Kaufman Reference Olszewski and Kaufman2015; Tomašových et al. Reference Tomašových, Gallmetzer, Haselmair, Kaufman, Vidović and Zuschin2017, Reference Tomašových, Gallmetzer, Haselmair, Kaufman, Kralj, Cassin, Zonta and Zuschin2018; Ritter et al. Reference Ritter, Erthal, Kosnik, Kowalewski, Coimbra, Caron and Kaufman2023). The association between the TAZ and the well-mixed surface layer found here has been suggested previously on the basis of pore-water profiles (Aller Reference Aller1982), but we document here that biological mixing of shells extends below the base of the TAZ into an IML (transition layer in ichnological studies) characterized by nonlocal feeders. This extension of mixing below the TAZ means that the mixing of shells and thus their time averaging continues under less antagonistic conditions in an SZ below the SML, decoupling shell accumulation in the IML from the time averaging that occurs under conditions of intense disintegration within the TAZ.
Second, we document that old shells exhumed upward from the IML, which is a zone of low disintegration and sequestration, back into the TAZ do not resume the high rates of disintegration experienced by freshly produced shells there, but rather retain the slow rate of disintegration that they acquired while residing in the SZ. This finding from transition matrix models supports the long-standing idea that shells can become diagenetically stabilized during prolonged time averaging via residence in an SZ, increasing their preservation during exhumation: time spent in the SZ is not simply a time-out from high disintegration, but an opportunity for resetting the inherent reactivity of the shells. This resistance of exhumed shells to disintegration contributes to the development of a long tail of relatively old shells in the SML; biological mixing is the means to exhume those shells.
Third, at the effluent site PVL5-75, we document the lowest rate of mixing: this reflects a legacy of sediment toxicity and should be relevant to shell assemblages in seabeds of any geologic age with little or very shallow burrowing. This site also has the highest ratio of burial to exhumation rates and has low disintegration rates, even within the SML. In the near absence of bioturbation, the TAZ thus does not fully develop, and indeed most shells here remain taxonomically identifiable. The toxic PVL5-75 site, characterized by abundant bioirrigating lucinids but not by deep or fast mixers, approximates the conditions thought to exist in early Paleozoic seabeds (e.g., Tarhan Reference Tarhan2018). In the absence of major biological or physical sediment mixing, such conditions allow the preservation of weakly averaged assemblages.
The net effects of bioturbation, especially in healthy ecosystems with mobile burrowers (Queirós et al. Reference Queirós, Stephens, Cook, Ravaglioli, Nunes, Dashfield and Harris2015; Gogina et al. Reference Gogina, Morys, Forster, Gräwe, Friedland and Zettler2017; Wrede et al. Reference Wrede, Dannheim, Gutow and Brey2017), can thus increase time averaging, notwithstanding the higher rates of shell disintegration promoted by bioirrigation and by exhumation to the sediment–water interface where a host of other biological and physical taphonomic processes are active. That balance may be different in some unusual settings, such as where disintegration rates are especially high owing to undersaturated overlying waters or very high rates of benthic respiration. We stress that the order-of-magnitude spatial differences in time averaging between non-effluent and effluent sites on the California shelf are, to a first order, determined by order-of-magnitude differences in sediment accumulation rates: prolonged time averaging is associated with low sediment accumulation, as also seen in the strong association of taphonomically complex and/or condensed assemblages with sedimentary hiatuses in marine macrobenthic records of all ages. The order-of-magnitude difference in time averaging between the two, high-sediment accumulation effluent sites—one more contaminated than the other—is, on the other hand, determined by severalfold differences in the rate and depth of bioturbation comparable to evolutionary changes recognized in the stratigraphic record, from mixing depths <5 cm to ones ≥10 cm. This latter finding is all the more thought-provoking because it arises despite the clear capacity of bioturbation to promote shell disintegration, acting against shell preservation and thus against time averaging.
Acknowledgments
We thank NSF-EAR reviewers and panelists who approved this actualistic analysis in an urban setting; K. Whitacre, J. Bright, A. Hopkins, and C. Meadows for laboratory assistance; and R. Foygel Barber for additional statistical advice. For ship-based assistance, we thank University of Chicago volunteers N. Bitler Kuenle, K. Jenkins Voorhies, A. Mine, and M. Baris, and from UCSD, J. Moore; undergraduates from both the University of Chicago and Savannah State University; and professional colleagues R. Cipriani (Santa Monica); L. DeLeo, M. Robinson, and C. Venherm (Skidaway); D. Cadien and C. McDonald (Los Angeles County Sanitation Districts), B. Edwards (U.S. Geological Survey); C. Hintz (Savannah State); and R. Norris, A. Hangsterfer, and the crew of the RV Melville out of Scripps Institution of Oceanography (UCSD). We thank C. Brett, M. do Nascimento Ritter, and L. Tarhan for their detailed and helpful reviews. This work reflects support from a National Oceanic and Atmospheric Association SeaGrant administered by the University of Southern California (NA07OAR4170008; S.M.K.); the National Science Foundation NSF EAR-112418 (S.M.K. and C.R.A.); the Slovak Research and Development Agency (APVV17-0555, APVV22-0523; A.T.); and the Slovak Scientific Grant Agency (VEGA 02/0106/23; A.T.).
Competing Interest
The authors declare no competing interests.
Data Availability Statement
Data available from the Dryad Digital Repository: https://doi.org//10.5061/dryad.0vt4b8h54. Scripts available from the Zenodo Digital Repository: https://doi.org//10.5281/zenodo.10070064.