I. INTRODUCTION
Nanoindentation is becoming an increasingly popular materials characterization tool in the biomaterials field because of its ability to measure local mechanical properties in small, irregularly shaped or heterogeneous samples.Reference Ebenstein and Pruitt1 This technique has been used extensively in the study of stiff biological materials (E > 1 GPa), including bone, teeth, and exoskeletons.Reference Ebenstein and Pruitt1–Reference Lewis and Nyman3 Traditional nanoindentation techniques, which were developed for metals and ceramics, could be readily adapted to these materials. The recent rise in the use of nanoindentation to study compliant, hydrated biomaterials such as soft tissues and hydrogels has led to the identification of numerous challenges ranging from instrumentation needs to data acquisition, analysis, and interpretation issues.Reference Ebenstein and Pruitt1, Reference Ebenstein and Oyen4–Reference Kaufman and Klapperich6 Three key concerns associated with nanoindentation testing of compliant, hydrated biomaterials are surface detection, adhesion, and fluid interactions.
Surface detection issues arise when performing indents with many commercial indentation systems. Typically, a surface is detected by the “set-point” method, where the indenter is stepped toward the surface until a small force, typically between 0.1 and 2 μN, is detected. For stiff materials, the displacement into the surface is negligible at such low loads, but for compliant materials, the tip can displace several microns into the surface.Reference Kaufman and Klapperich6–Reference VanLandingham, Villarrubia, Guthrie and Meyers9 As traditional analysis methods rely on the displacement of the probe to determine contact area, modulus, and hardness, underestimating displacements due to surface detection errors leads to overestimation of modulus and hardness values.Reference Kaufman and Klapperich6, Reference Deuschle, Enders and Arzt7
Adhesive force between the tip and sample is another factor that complicates modulus measurements in compliant materials. Traditional indentation analysis, such as the Oliver and Pharr method,Reference Oliver and Pharr10 is based on elastic–plastic models and assumes that adhesion is negligible. However, when indenting a compliant material with a blunt (e.g., spherical) tip, adhesion forces can be quite substantial, and failing to use analysis methods that account for adhesion in these situations also leads to overestimation of the modulus of the material.Reference Carrillo, Gupta, Balooch, Marshall, Marshall, Pruitt and Puttlitz11–Reference Gupta, Carrillo, Li, Pruitt and Puttlitz14
When testing hydrated materials, additional challenges in surface detection and data analysis can be caused by fluid interactions with the tip. When testing a submerged sample, a high set-point force or manual approach is required to penetrate the fluid layer without incorrectly detecting surface contact.Reference Kaufman, Miller, Morgan and Klapperich5, Reference Franke, Goken and Hodge15 After penetration, variable capillary forces act on the indenter shaft because of the formation of a fluid meniscus.Reference Mann and Pethica16–Reference Tang and Ngan18 To reduce or stabilize capillary forces on the tip, special fluid extender tips with long shafts of small diameter are typically used for indentation testing in fluids.Reference Mann and Pethica16 Even with these special tips, however, a load hysteresis of several micro-Newtons has been observed during movement of partially submerged shafts,Reference Mann and Pethica16, Reference Gauthier and Nourine19 which could interfere with accurate force measurement during indentation testing.
To overcome the first two issues of surface detection and adhesion when testing compliant polymers, several studies have used analysis methods based on the Johnson–Kendall–Roberts (JKR) adhesion model.Reference Ebenstein and Wahl13, Reference Johnson, Kendall and Roberts20–Reference Sun, Akhremitchev and Walker22 These studies have used the force curve approach, where the indenter tip begins and ends above the surface of the sample to capture the full interaction as the tip approaches the surface, jumps into contact, indents, and withdraws from the sample. Data may then be analyzed using just two or three points on the load–displacement curve to calculate a reduced modulus based on JKR theoryReference Ebenstein and Wahl13, Reference Sun, Akhremitchev and Walker22, Reference Grunlan, Xinyun, Rowenhorst and Gerberich23 or using full curve-fitting approaches that also identify the point of initial contact with the sample.Reference Ebenstein and Wahl13, Reference Cao, Yang and Soboyejoy21 This technique of combining force curve data collection with JKR analysis will subsequently be referred to as the nano-JKR force curve method.
An alternate JKR approach corrects traditional quasi-static indentation data (where indents start in contact with the sample) with an independent measure of the pull-off force acquired using atomic force microscopy (AFM).Reference Carrillo, Gupta, Balooch, Marshall, Marshall, Pruitt and Puttlitz11, Reference Carrillo, Gupta, Balooch, Marshall, Marshall, Pruitt and Puttlitz12, Reference Gupta, Carrillo, Li, Pruitt and Puttlitz14 However, pull-off forces can vary with unloading rate and contact time,Reference Carrillo, Gupta, Balooch, Marshall, Marshall, Pruitt and Puttlitz11 as well as by position within a sample because of local variations in surface energy, and so measuring pull-off forces in an independent test can introduce an additional source of error into the data analysis process. The nano-JKR force curve approach improves upon this method because all necessary data are collected in a single test, allowing the pull-off force to be uniquely identified for each indent performed. In addition, using force curves instead of quasi-static indents eliminates errors associated with surface detection using set-point loads.
In spite of these advantages and the known challenges of indentation testing in a hydrating fluid, the nano-JKR force curve method has not been fully validated for indentation of compliant materials in fluids, a necessary step before this technique can be applied to hydrogels and other hydrated biomaterials. The goals of this study were, therefore, to validate the nano-JKR force curve method for nanoindentation of a compliant polymer in both air and water and to compare multiple methods of JKR model–based data analysis. Both quasi-static and force curve indents were performed in air, water, and a detergent solution on poly(dimethyl siloxane) (PDMS) samples, with detergent used to reduce interfacial forces. Testing under these different conditions allowed separation of errors in modulus determination because of surface detection, adhesion, and capillary forces. Finally, to identify the most suitable JKR analysis methods, several JKR curve-fitting techniques and a 2-point method were also compared.
II. MATERIALS AND METHODS
A. Sample preparation
Two PDMS samples were prepared with different cross-link ratios, 10:1 and 20:1, to result in different moduli. Samples were prepared using Sylgard 184 (Dow Corning, Midland, MI) following the manufacturer’s instructions. After mixing the desired ratios of polymer to the cross-linking agent, 10:1 or 20:1, PDMS solutions were placed in a vacuum chamber for 15 min to remove air bubbles. Solutions were then poured into glass molds and cured at 70 °C for 2 h. The resulting PDMS samples were between 0.5 and 1 mm thick. The surface roughness of the samples was not measured because surface roughness was not found to be a confounding factor in a previous indentation study of Sylgard 184 samples with the same cross-link ratios using a 100-μm-diameter tip.Reference Carrillo, Gupta, Balooch, Marshall, Marshall, Pruitt and Puttlitz11
For indentation testing, 6-mm-diameter PDMS samples were cut with a biopsy punch and placed in fluid cells created by gluing a 1-cm-inner-diameter Teflon O-ring to a glass slide that had been treated with plasma oxygen to provide a clean, hydrophilic surface with a contact angle of <30°. To attach each sample to the slide, the bottom of the sample was placed on Scotch tape for 30 s before transferring the sample to the hydrophilic glass slide. This method provided secure attachment through several hydration–dehydration cycles with different hydrating fluids.
B. Indentation testing
All indentation experiments were performed using a Hysitron TI750 instrumented indentation system (Hysitron, Inc., Minneapolis, MN) using custom conospherical fluid cell tips prepared in-house. These tips were constructed from a 1-cm-long segment of 0.016" diameter tungsten wire (Small Parts, Indianapolis, IN) glued into an existing hole in an indenter tip holder using a high viscosity cyanoacrylate-based adhesive (Loctite 454; Loctite Corp., Rocky Hill, CT). A borosilicate glass microsphere with a diameter between 150 and 300 μm (Corpuscular, Cold Spring, NY) was glued to the free end of the tungsten wire using a small amount of the same adhesive. Optical micrographs were used to evaluate the radii of the tips used in this study. The tips used for indentation of the 10:1 and 20:1 samples had nominal radii of curvature of 130 and 94 μm, respectively.
Each sample was tested under three hydration conditions: air, water, and detergent. For the three conditions, the fluid cell remained empty, was filled with deionized water, or was filled with an 8 mM solution of sodium lauryl sulfate detergent in deionized water to achieve critical micelle concentration (CMC). The purpose of the detergent was to reduce capillary forces on the indenter shaft and adhesion forces at the tip–sample contact. After adding the detergent solution to the fluid cell, a wait period of 10 min was imposed to allow detergent molecules to coat all surfaces before indentation tests were performed. After any testing in detergent, the sample and tip were rinsed vigorously several times to remove any detergent residue. Before indenting in water or detergent solution, air indent calibrations were performed with the indenter shaft submerged within the fluid to correct for forces due to the fluid.
Both traditional quasi-static indents (i.e., starting with the tip in contact with the sample after using the set-point method for surface detection) and force curve indents (i.e., starting with the tip above the surface of the sample) were performed under each hydration conditions. All indents were placed at least 150 μm apart on the sample surface, and a minimum of 5 indents were performed for each test type and hydration condition on each sample.
Force curve indents were performed following the method described by Ebenstein and Wahl.Reference Ebenstein and Wahl13 This sample approach method is similar to the “manual method” of surface detection used in several other studiesReference Kaufman, Miller, Morgan and Klapperich5, Reference Kaufman and Klapperich6, Reference Cao, Yang and Soboyejoy21, Reference Galli, Comley, Shean and Oyen24 and illustrated effectively by Kaufman and Klapperich.Reference Kaufman and Klapperich6 First, the tip was brought into contact with the sample with a set-point force of 2 μN for air and detergent indents or a set-point force of 10 μN for water indents. The higher set-point force for water indents was required to avoid false surface detection because the monitored load drifted upwards as the tip stepped towards the surface, likely because of capillary forces on the indenter shaft.Reference Mann and Pethica16, Reference Tang and Ngan18 The tip was then manually withdrawn from the surface until the detected force returned to zero, ensuring that the tip was fully out of the adhesive interaction zone. The tip was withdrawn 4 μm above the surface for the 10:1 sample and 6 μm above for the more compliant 20:1 sample. After withdrawing from the surface, an indent was performed in displacement control at a rate of 100 nm/s to a maximum tip displacement of 4500 nm for the 10:1 sample and 8000 nm for the 20:1 sample. A larger travel distance was used for the 20:1 sample to achieve similar peak loads in both samples (>40 μN) because the tip had to begin at a higher position above the 20:1 sample to be fully out of the interaction zone. The loading rate of 100 nm/s was selected following a preliminary loading rate analysis that showed that force curves performed at rates of 100 nm/s or less showed good agreement in modulus and pull-off force (maximum adhesive force) values for each sample (data not shown).
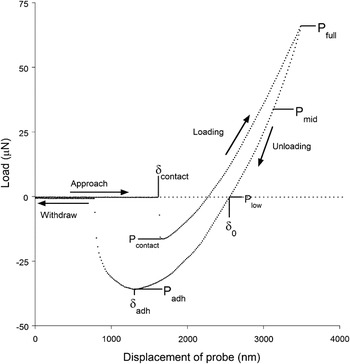
Because the indenter tip begins above the sample, load–displacement data for a full force curve is collected using this technique as illustrated in Fig. 1, including the jump-to-contact (at δ contact) and the pull-off from the surface (at δ adh) in addition to the penetration into the sample. Knowledge of the pull-off force (P adh) is needed to analyze indentation data using adhesion models,Reference Ebenstein and Wahl13 and beginning with the tip out of contact avoids surface penetration due to the preload force.
Example load–displacement data for a poly (dimethyl siloxane) (PDMS) force curve illustrating points used in Johnson–Kendall–Roberts (JKR) analyses. δ contact is the displacement at the jump-to-contact point; P contact is the maximum adhesive force reached during the jump-to-contact; δ adh and P adh are the displacement and load at the point of maximum adhesive force, or pull-off; δ 0 is the displacement at zero applied load (P = 0 or P low) during unloading; P low (the point where the unloading curve crosses zero load) is the highest load used for the low-range fit; P mid (the point where the load reaches the magnitude of P adh but in compression) is the highest load used for the mid-range fit; and P full (or P max, the point of peak load on the unloading curve) is the highest load used for the full-range fit.

Traditional quasi-static indents were also performed under each hydration condition for comparison with the force curve results. All quasi-static indents were performed in displacement control at a rate of 100 nm/s to a peak displacement of 1500 nm for the 10:1 sample and 3000 nm for the 20:1 sample, starting from surface contact with a set-point force of 2 μN. These travel distances were selected to achieve peak loads and sample penetration depths similar to those reached by the force curves in each sample. Although a 10 μN set-point force was required to successfully engage the surface in water, as described earlier, the tip was withdrawn to a load of 2 μN before performing a quasi-static indent to ensure that the increased set-point in water would not result in an increased error in penetration depth relative to the other hydration conditions.
C. Data analysis
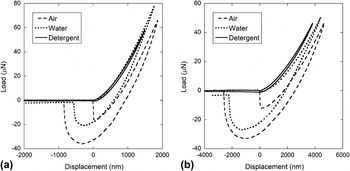
Figure 2 shows representative force curves for each PDMS sample in air, water, and detergent. The force curves in air and water in both samples showed evidence of significant adhesion, as indicated by the large pull-off forces (≥20 μN). In contrast, detergent reduced the pull-off forces to less than 1 μN, essentially eliminating the effects of adhesion. As a result, only force curves in air and water were analyzed using the nano-JKR adhesion analysis; force curves in detergent were instead analyzed using the Oliver and Pharr method.
Sample force curves in air, water, and detergent for (a) the 10:1 PDMS sample with a 130-μm radius tip and (b) the 20:1 PDMS sample with a 94-μm radius tip.

The unloading curves from the force curve indents in air and water were analyzed using several methods based on the JKR adhesion model equations.Reference Johnson, Kendall and Roberts20 When analyzing adhesive contacts involving spherical tips, JKR theoryReference Johnson, Kendall and Roberts20 is valid for contact conditions involving low modulus samples, large tip radii, and high surface energy, while the alternative Derjaguin–Muller–Toporov (DMT) theoryReference Derjaguin, Muller and Toporov25 is used to describe contact conditions involving high modulus samples, small tip radii, and low surface energy. A model for the transition regime between these two limits has also been developed by Maugis.Reference Maugis26 The appropriate theory to apply for a particular set of experimental conditions can be determined by the calculation of the dimensionless Tabor parameter, μ, given byReference Tabor27
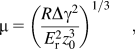
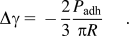
where R is the radius of curvature of the tip, Δγ is the work of adhesion, E r is the reduced modulus of the sample, and z 0 is the equilibrium separation of the samples. For μ > 5, JKR theory applies, for μ < 0.1, DMT theory applies, and the transition model is used in between. For the JKR model, the work of adhesion, which provides a measure of the energy needed to pull two surfaces apart,Reference Carrillo, Gupta, Balooch, Marshall, Marshall, Pruitt and Puttlitz11 can be calculated from measured pull-off forces using the following equationReference Johnson, Kendall and Roberts20:
For the experimental conditions in this study, using z 0 = 0.3,Reference Ebenstein and Wahl13 the Tabor parameter is greater than or equal to 600 for all air and water indents. Since μ >> 5, JKR analysis is appropriate.
The specific JKR analysis methods used in this study were described in detail by Ebenstein and Wahl.Reference Ebenstein and Wahl13 The first method, a 2-point method, requires knowledge of only two points in the unloading curve, which are labeled in Fig. 1: the point where the load crosses zero in the unloading curve (with displacement defined as δ 0) and the point where the load reaches its minimum, also known as the pull-off point (with load defined as P adh and displacement defined as δ adh). Using loads and displacements from these two points, the reduced modulus can be calculated using the following equationReference Ebenstein and Wahl13, Reference Grunlan, Xinyun, Rowenhorst and Gerberich23:

where R is the radius of curvature of the indenter tip. This simple method requires accurate identification of only two points in the unloading curve.
As a more rigorous approach, the following equation, also based on the JKR model, was fit to the unloading curve load–displacement (P–δ) data using Mathcad (PTC, Needham, MA)Reference Ebenstein and Wahl13:
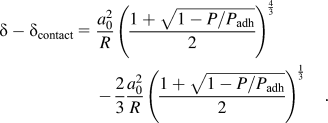
The curve fit returns δ contact, a 0, and P adh. Knowledge of δ contact allows for the identification of the effective point of initial contact between the tip and the sample, while a 0 (the contact radius between the tip and the sample at P = 0 or δ 0) and P adh (the pull-off force) are used to calculate the reduced modulus of the sample using the following equationReference Ebenstein and Wahl13:
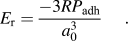
To investigate the robustness of these curve-fitting techniques, curve fits were performed over three different load ranges for each set of data. The low-range curve fit included the data from the pull-off force (P adh in Fig. 1) to the point where the load crosses 0 μN (labeled P low in Fig. 1). The full-range curve fit included the data from the pull-off force through the maximum force (labeled P full in Fig. 1). Finally, the mid-range curve fit, which was selected to provide an intermediate range between the low- and full-range curve fits, was defined as the range from the pull-off force to the point where the load reached the magnitude of P adh but in compression (labeled P mid in Fig. 1).
Because the force curves in detergent showed no adhesion and very little hysteresis, they were instead analyzed using the Oliver and Pharr method.Reference Oliver and Pharr10 Before applying a power law fit to the unloading data, curves were manually shifted based on identification of the initial surface contact point where the load data began to monotonically increase. All quasi-static indents were also analyzed using the Oliver and Pharr method. Fit ranges of 20–95% and 70–90% of the unloading data were performed, but few significant differences were found between the results using the two ranges. Hence, only results from the power law curve fit in the range of 20–95% are reported here.
All data analysis methods yield values of “reduced modulus,” which include contribution of material properties for both the sample and the indenter tip.Reference Oliver and Pharr10 For very compliant materials being indented by very stiff tips, the contribution of the indenter tip is negligible and the elastic modulus of the tested material (E) can be related to the reduced modulus (E r) by the following relationship:

where ν is the Poisson’s ratio of the tested material. Although reduced modulus values are generally reported in this study, elastic modulus values can be determined using Eq. (6) if a Poisson’s ratio is assumed. Poisson’s ratios ranging from 0.42Reference Deuschle, Buerki, Deuschle, Enders, Michler and Arzt28 to 0.5Reference Carrillo, Gupta, Balooch, Marshall, Marshall, Pruitt and Puttlitz11, Reference Gupta, Carrillo, Li, Pruitt and Puttlitz14 have been used in previous indentation studies of PDMS. A value of 0.5 was used in this study wherever elastic moduli are reported.
D. Statistical analysis
Statistical analysis was performed to identify differences in reduced modulus values as a function of environment (air, water, and detergent), indent method (quasi-static indents and force curves), and data analysis method (2-point method, curve fitting over each range) within each sample. When comparing more than two groups, a generalized linear model was used instead of analysis of variance because of unequal sample sizes. Post hoc analysis was performed using Tukey multiple comparison tests when all pairwise comparisons were of interest and using Dunnett’s tests when comparing against a single control group. A p value less than 0.05 was considered significant for all tests.
III. RESULTS
A. Effects of water and detergent on force curves
Figure 2 shows representative force curves for each PDMS sample in air, water, and detergent that illustrate the trends observed in load–displacement behavior. The jump-to-contact (P contact) and pull-off forces (P adh) for each experimental condition are summarized in Table I, along with the work of adhesion (Δγ) values calculated using Eq. (2). Performing force curve indents in water reduced but did not eliminate adhesion effects relative to indents in air, as indicated by the 90% reduction in jump-to-contact forces during loading but only 40% reduction in pull-off forces and work of adhesion during unloading for each sample. In contrast, the detergent essentially eliminated adhesive effects during loading and unloading, with no detectable jump-to-contact forces, mean pull-off forces of less than 0.4 μN, and mean work of adhesion values of less than 1 mJ/m2 for both samples. The detergent also eliminated almost all the hysteresis in the load–displacement curve, suggesting that the majority of the hysteresis observed in the force curves in air and water was caused by adhesion and other surface forces.
Summary of jump-to-contact forces, pull-off forces, and work of adhesion values from analysis of force curves of PDMS samples in air, water, and detergent.

Values reported as mean ± standard deviation.
a Jump-to-contact forces in detergent force curves were not detectable.
Force curves in air began and ended at zero load. In contrast, the force curves in water failed to return to zero load after retraction of the tip from the sample, with the system reporting a residual load value between −3 and −10 μN at the end of the test. This same effect was observed when performing calibration indents with the tip submerged in water without indenting a sample, suggesting that this phenomenon is due to fluid interactions with the tip rather than any interaction with the sample. Indenting in a detergent solution greatly reduced or eliminated this effect, as indicated by the reduced zero load hysteresis observed in the detergent force curve for the 20:1 sample and the lack of observed zero load hysteresis for the 10:1 sample.
B. Comparison of quasi-static and force curve results in air, water, and detergent
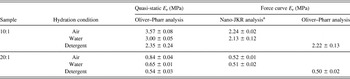
Since adding detergent to the water bath eliminated adhesion and other surface forces, resulting in nominally elastic indentation curves, analyzing the force curves in detergent using the Oliver and Pharr analysisReference Oliver and Pharr10 yielded a reduced modulus value to use as a baseline for comparison with other experimental results. The baseline modulus values from the detergent force curve analyses were 2.22 ± 0.13 MPa for the 10:1 sample and 0.50 ± 0.02 MPa for the 20:1 sample. These correspond to mean elastic modulus values of 1.67 and 0.38 MPa, assuming a Poisson’s ratio of 0.5.
Table II compares the modulus values measured by quasi-static indents and force curve analysis in air, water, and detergent. Quasi-static indents in the detergent solution yielded mean reduced modulus values of 2.35 and 0.54 MPa for the 10:1 and 20:1 samples, respectively, which were slightly higher than, but not statistically significantly different from, the values measured from the detergent force curves (6% and 8% higher, respectively). Reduced moduli from quasi-static indents performed in air and water, in contrast, were significantly higher (p < 0.001) than the baseline detergent values for both the 10:1 sample (3.6 MPa in air and 3.0 MPa in water) and the 20:1 sample (0.84 MPa in air and 0.65 MPa in water). For both samples, these quasi-static indents in air and water overestimated the reduced modulus values by approximately 60% and 30%, respectively, when compared with the baseline detergent force curve values.
Summary of reduced modulus data for quasi-static indents and force curve analysis of PDMS samples in air, water, and detergent.

Values reported as mean ± standard deviation.
a Results of mid-range curve fit method.
Although the quasi-static modulus results were significantly different as a function of hydration environment for each sample (p < 0.001), the force curve analyses yielded more consistent results, as shown in Table II. Despite clear differences in load–displacement behavior and the different data analysis methods used, force curves under all three hydration conditions yielded comparable reduced modulus values of 2.1–2.2 MPa for the 10:1 sample and 0.50–0.52 MPa for the 20:1 sample (using the mid-range curve fit for air and water curves), with no significant differences detected among conditions. Note also that the force curve moduli for indents in water were not consistently higher or lower than those in detergent, whereas those in air were always slightly higher.
C. Comparison of different nano-JKR force curve analysis methods
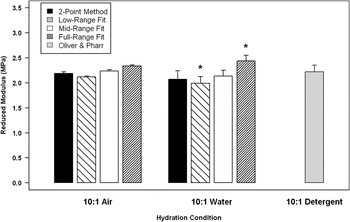
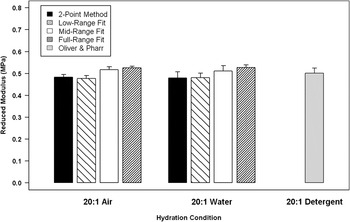
Figures 3 and 4 summarize the results of the different nano-JKR force curve analysis methods in air and water for the 10:1 and 20:1 samples, respectively. For reference, the baseline reduced modulus values from analysis of the detergent curves are also included in the figures. The analysis methods being compared were the 2-point method and curve-fitting the JKR load–displacement equations over three different ranges of data (low, mid, and full), as described previously. No significant differences were detected between mean reduced modulus values determined by the mid-range curve fit or 2-point method relative to the detergent baseline values for any samples. The only statistically significant differences that were detected when comparing the results from the different JKR analysis methods against the baseline detergent moduli were for the analysis of force curves in water for the 10:1 sample. For those indents, the full-range curve fit overestimated the modulus by 0.22 MPa and the low-range fit underestimated the modulus by 0.23 MPa. Given that the baseline reduced modulus was 2.22 ± 0.13 MPa, these errors (∼10%) would likely be considered acceptable for most indentation applications.
Comparison of force curve data analysis methods for 10:1 PDMS sample in air, water, and detergent. For air and water data, force curves were analyzed using four different JKR methods: the 2-point method, the low-range curve fit (to Plow), the mid-range curve fit (to P mid), and the full-range curve fit (to P full). For detergent data, force curves were analyzed using the Oliver and Pharr method after manual identification of the point of surface detection. Significant differences from the detergent baseline modulus are indicated by an *.

Comparison of force curve data analysis methods for 20:1 PDMS sample in air, water, and detergent. For air and water data, force curves were analyzed using four different JKR methods: the 2-point method, the low-range curve fit (to Plow), the mid-range curve fit (to P mid), and the full-range curve fit (to P full). For detergent data, force curves were analyzed using the Oliver and Pharr method after manual identification of the point of surface detection.

In general, full-range curve fitting yielded small increases in reduced modulus relative to baseline detergent values (with errors between 5 and 10%). The curve fits over the mid-range were the most similar to the detergent force curve analysis, with between 1 and 4% difference in reduced modulus values for force curves in air and water relative to the detergent (≤0.09 MPa for the 10:1 sample and ≤0.02 MPa for the 20:1 sample). These differences were within a single standard deviation of the mean detergent reduced modulus for each sample. The 2-point method, which is the simplest method to implement as it does not require curve fitting or identification of the initial contact point, also had relatively low variation from the detergent values of under 5% for all groups except the 10:1 sample tested in water (which had an error of 7%). Both the 2-point method and the low-range fit also consistently underestimated the modulus relative to the detergent baseline values.
IV. DISCUSSION
The results presented here demonstrate that the nano-JKR force curve method can be used to accurately and effectively measure reduced modulus values in a compliant polymer in air and in water. While traditional quasi-static indentation in air and water resulted in significant overestimation of the modulus of each sample, using the JKR adhesion model to analyze force curves collected in air and water resulted in moduli consistent with those measured by force curves in detergent, where adhesion force and capillary force errors were eliminated. Further, a variety of different JKR model–based analysis methods (including 2-point methods and curve-fitting) were found to provide acceptably consistent modulus results in air and in water, indicating the robustness of the nano-JKR method.
Although large variations were seen in quasi-static indentation results in air, water, and detergent, the use of the nano-JKR force curve method brought both the air and water force curve results into alignment with the baseline detergent force curve data by accounting for the effects of adhesion. Errors in nano-JKR force curve analysis due to capillary forces were apparently negligible because comparable modulus values were measured in air and in water. Hence, this method can effectively compensate for errors due to adhesion under both dry and hydrated conditions. The ability of JKR modeling to correct for adhesion that we demonstrated is also consistent with a previous PDMS study by Carillo et al.,Reference Carrillo, Gupta, Balooch, Marshall, Marshall, Pruitt and Puttlitz11, Reference Carrillo, Gupta, Balooch, Marshall, Marshall, Pruitt and Puttlitz12 where post hoc JKR correction of quasi-static indents resulted in comparable moduli in air and water, eliminating the significantly higher overestimation of modulus in air than in water resulting from Oliver and Pharr analysis. The JKR-corrected moduli in that study, however, were significantly lower than unconfined compression results for most samples because of the errors associated with tip calibration, surface detection, and the use of independent adhesion force measurements from an AFM.Reference Carrillo, Gupta, Balooch, Marshall, Marshall, Pruitt and Puttlitz11, Reference Carrillo, Gupta, Balooch, Marshall, Marshall, Pruitt and Puttlitz12 Our study overcomes those potential sources of error by using a single tip for all measurements in a given sample and using force curves to avoid surface detection errors and allow measurement of indent-specific adhesion forces.
Therefore, these results suggest that failure to account for adhesion is the dominant source of error in traditional quasi-static indentation of compliant polymers, with errors due to fluid effects negligible in comparison. The errors due to surface detection were also small in comparison as seen by the lack of significant differences between quasi-static and force curve results in detergent (where adhesion and capillary forces are minimized). The slight overestimation of modulus by quasi-static indents in detergent remained nonsignificant but increased with decreasing sample stiffness, which is consistent with the results of previous studies.Reference Kaufman and Klapperich6, Reference Deuschle, Enders and Arzt7 A larger initial displacement due to the set-point force would be expected in a more compliant sample, which would in turn lead to a larger error in penetration depth and a greater overestimation of the modulus. Our conclusion that adhesion is a dominant source of error in modulus determination and should be accounted for in nanoindentation analysis of compliant polymers is also consistent with the previous study by Carillo et al.Reference Carrillo, Gupta, Balooch, Marshall, Marshall, Pruitt and Puttlitz11, Reference Carrillo, Gupta, Balooch, Marshall, Marshall, Pruitt and Puttlitz12
We demonstrated the robustness of the JKR adhesion model by comparing several applications of the JKR model to analyze force curves, including a 2-point method and curve-fitting over three load ranges. The lack of significant differences for results from the mid-range fit and 2-point method relative to the detergent baseline modulus values suggest that these two would be the most accurate and reliable methods to use in future studies. However, all the force curve analysis methods yielded moduli within 10% of the detergent force curve results, a level of error that would likely be considered acceptable for most indentation applications. The poorest fit for the JKR adhesion model was seen using the full range, and this may be attributed to the effects of hysteresis (because of adhesion and/or viscoelasticity) on the initial portion of the unloading curve, as was observed for a previous study of PDMS samples with reduced moduli near 3 MPa.Reference Ebenstein and Wahl13 It is possible that by including a suitable hold period before unloading, the results from curve fits over the full range could be improved.
We observed that variation in capillary forces as the tip moved through the water greatly interfered with surface detection using the set-point method and the ability to perform automated testing, consistent with previous studies,Reference Kaufman, Miller, Morgan and Klapperich5, Reference Franke, Goken and Hodge15, Reference Mann and Pethica16, Reference Tang and Ngan18 and caused zero force hysteresis of several micro-Newtons. Testing in air or detergent solution above the CMC avoided these difficulties, allowing surface detection with low set-point forces (≤2 μN) and reducing or eliminating zero force hysteresis. Detergents or surfactants can therefore be used to reduce interfacial forces and to facilitate high throughput testing of hydrated samples. Note that detergents or surfactants that are appropriate and safe for specific materials may vary, particularly for the study of biological materials.
A limitation of this study is that viscoelastic, or time-dependent, properties were not investigated. In a previous nano-JKR study of PDMS samples with reduced moduli near 3 MPa, force curves performed at a rate of 100 nm/s measured an equilibrium (i.e., relaxed) modulus even for a Sylgard 184 sample exhibiting frequency-dependent moduli during high frequency (≥25 Hz) oscillatory loading.Reference Ebenstein and Wahl13 Hence, the values measured in this study, which used the same loading rate, are expected to represent the equilibrium modulus of each PDMS sample. Tests performed at higher rates would be expected to result in higher modulus values if these samples exhibit significant time-dependent behavior.Reference Ebenstein and Wahl13 Future work will focus on testing this method on hydrogels and evaluating viscoelastic and equilibrium properties by combining this method with viscoelastic analysis techniques.Reference Kaufman, Miller, Morgan and Klapperich5, Reference Ebenstein and Wahl13, Reference Franke, Goken and Hodge15, Reference Galli, Comley, Shean and Oyen24
Although some of the experimental parameters (such as tip radius and maximum displacement) varied between the 10:1 and 20:1 PDMS samples, consistent load functions and tip radii were used for all tests within each sample. Since the goal of this study was not to compare results between materials but rather to compare the results of different analysis methods within each sample, the conclusions drawn from this study about the effects of hydration and adhesion on modulus measurement, and the effectiveness of the nano-JKR method, are still meaningful despite these variations in experimental conditions. However, since only one material chemistry (PDMS) was analyzed and spherical glass indenter tips with tungsten shafts were used for all tests, it should be acknowledged that specific results may vary depending on the chemistry of tip and shaft materials (which can affect the magnitude of adhesive and capillary forces, respectively).
Despite these limitations, the strength of this study was that the robustness of the nano-JKR technique for measuring modulus was demonstrated in both air and water for two PDMS materials with different moduli. The nano-JKR force curve method is expected to be applicable for analysis of other compliant polymers that exhibit significant tip-sample adhesion. Some practical considerations should be followed for applying this technique to new material systems. For example, selection of appropriate lift-off heights, tip travel, tip diameter, and loading rates is needed to capture a full force curve with clearly measurable pull-off forces (i.e., significantly higher than the effective noise floor of the instrument) within the displacement, load, and drift limitations of the indentation system. In addition, Tabor parameters should be calculated to ensure that the contact conditions fall within the JKR regime. Appropriate test conditions will be dictated by the reduced modulus (E r), the work of adhesion (Δγ), and the tip radius (R) being used for testing. In addition, for viscoelastic polymers with slow relaxation times, it may not be possible to select a sufficiently slow loading rate that will result in accurate equilibrium modulus measurements using this method, and a more rigorous viscoelastic JKR analysis may be needed.
In conclusion, this study serves as a validation of the nano-JKR force curve method for determining accurate reduced moduli in a compliant polymer under conditions where there are strong adhesive forces between the tip and the sample. Even in water, when capillary forces on the shaft can lead to hysteresis between loading and unloading curves, accurate moduli can be extracted from force curves using this method. This study also demonstrates the importance of accounting for adhesion for accurate modulus measurement, since errors in quasi-static indentation results due to adhesion were much higher than errors due solely to surface detection.
ACKNOWLEDGMENTS
The author thanks Hysitron, Inc., for the loan of the TI750 and software to perform these experiments; Bucknell University students Christina Garman, Kelly Desharnais, and Jenell Smith for PDMS sample preparation; and the National Science Foundation (award EEC-0741487) for funding of the PDMS materials and preparation facilities. The author also thanks Dr. Margot Vigeant (Chemical Engineering Department, Bucknell University, Lewisburg, PA) for valuable discussions on detergents and surfactants and Dr. Jove Graham (Center for Health Research, Geisinger Medical Center, Danville, PA) for assistance with statistical analysis and valuable feedback during development of this manuscript.