
Introduction
Phase change random access memory (PCRAM) has been used as a storage class memory for filling the performance gap between dynamic random access memory and data storage systems such as solid-state drive and hard disk drive.[Reference Burr, Kurdi, Scott, Lam, Gopalakrishnan and Shenoy1] The principle of PCRAM relies on the electrical contrast of phase change material (PCM) that generally has interchangeable amorphous and crystalline phases.[Reference Wuttig and Yamada2, Reference Wong, Raoux, Kim, Liang, Reifenberg, Rajendran, Asheghi and Goodson3] The amorphous and crystalline phases have high and low resistance values, respectively. The phase transition between two phases is achieved by applying electrical pulses, causing Joule heating. Amorphization is achieved via using high-amplitude and short-duration electrical pulses, while crystallization is achieved using low-amplitude and long-duration electrical pulses.[Reference Wong, Raoux, Kim, Liang, Reifenberg, Rajendran, Asheghi and Goodson3]
Ge-Sb-Te (GST) compounds are well known as typical PCMs, and they exhibit a fast crystallization process and excellent reversibility of phase transition.[Reference Wuttig and Yamada2, Reference Yamada, Ohno, Nishiuchi, Akahira and Takao4] The amorphous GST crystallizes to a crystalline phase having a metastable fcc structure. By further heating, the crystal structure changes from an fcc to stable hexagonal structures.[Reference Yamada, Ohno, Nishiuchi, Akahira and Takao4] GST, however, possess a low crystallization temperature of about 150°C and their amorphous phase, thus, exhibits a low thermal stability.[Reference Yamada, Ohno, Nishiuchi, Akahira and Takao4] Such a low thermal stability in the amorphous phase of GST causes poor data-retention ability at a high temperature. Because thermal disturbance between cells cannot be ignored in highly scaled memory arrays, low thermal stability also prevents further scaling of memory arrays.[Reference Lacaita5] Therefore, development of alternative PCMs having a high thermal stability in their amorphous phase also exhibits a high crystallization temperature is necessary.
Most recently, we found that a Cr-Ge-Te compound, Cr2Ge2Te6 (CrGT), exhibits a phase change between amorphous and crystalline phases.[Reference Hatayama, Sutou, Shindo, Saito, Song, Ando and Koike6] The amorphous CrGT crystallizes to a crystalline phase having a rhombohedral  $\hbox{R}\bar 3$ symmetry. Its crystallization temperature is about 270°C, which is much higher than that of GST.[Reference Hatayama, Sutou, Shindo, Saito, Song, Ando and Koike6] Interestingly, CrGT films show an inverse resistance change: high resistance in the crystalline phase and low resistance in the amorphous phase.[Reference Hatayama, Sutou, Shindo, Saito, Song, Ando and Koike6] Moreover, the resistivity contrast between amorphous and crystalline CrGT is only one order of magnitude. However, the contact resistivity contrast between the amorphous CrGT/W electrode and crystalline CrGT/W electrode reaches two orders of magnitude, which is sufficient for PCRAM applications. The crystalline phase having high resistance and a dominant contact resistance can reduce the size of the programmable volume, greatly reducing the operation energy requirement.[Reference Hatayama, Sutou, Shindo, Saito, Song, Ando and Koike6] It is also noteworthy that CrGT exhibits a fast operation speed, as short as 30 ns, which is comparable with or faster than that of GST.[Reference Hatayama, Sutou, Shindo, Saito, Song, Ando and Koike6] Therefore, CrGT is a promising PCM, enabling high thermal stability, low operation energy, and fast operation speed. However, the reason why CrGT exhibits a fast operation speed is unclear yet.
The operation speed of a PCRAM is generally limited by the programing procedure that is used to obtain a crystallization phase because the crystallization of an amorphous phase needs time. Generally, the operation speed to obtain a crystalline phase strongly depends on the crystallization speed of a PCM. To discuss and understand the crystallization speed of the PCM, it is immensely important to characterize its crystallization mechanism and kinetics. The crystallization mechanism and kinetics of GST have been widely studied by isothermal and nonisothermal experiments.[Reference Ohshima7–Reference Orava, Greer, Gholipour, Hewak and Smith9] However, those CrGT films are not clear yet.[Reference Hatayama, Sutou, Shindo, Saito, Song, Ando and Koike6] Therefore, in this study, the crystallization behavior of the amorphous CrGT film was measured using nonisothermal differential scanning calorimetry (DSC) in the range of the heating rate of 10–50°C/min. The crystallization mechanism and kinetics of the amorphous CrGT film were studied.
Experimental procedures
CrGT films were deposited on SiO2 (100 nm)/Si substrates by RF magnetron co-sputtering of pure metal targets of Cr, Ge, and Te. The composition of the obtained film was confirmed to be Cr19.2Ge20.6Te60.2 by an energy-dispersive x-ray spectrometer attached to a scanning transmission electron microscope (STEM) (JEOL, JEM2100). The sample for STEM was prepared by mechanical polishing followed by ion milling (Gatan, PIPS). GST films were also prepared by sputtering a Ge2Sb2Te5 alloy target. DSC (TA Instruments, Q20) was performed to investigate the crystallization kinetics of amorphous CrGT and GST films at varying heating rates of 10–50°C/min in an Ar atmosphere. To obtain a clear exothermic peak for crystallization, the film thickness was set to be 2000 nm. The thickness was confirmed by atomic force microscopy (AFM) (Keyence, VN-8000). A marker was put on the substrate before deposition and then removed to obtain the step by ethanol after deposition.
Results and discussion
Local activation energy for crystallization
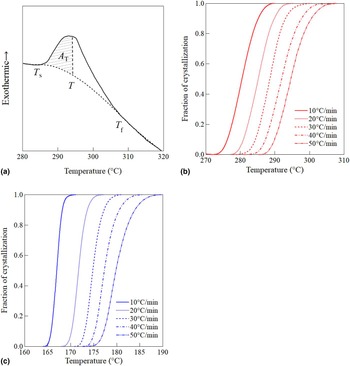
Figure 1(a) shows a DSC curve of the as-deposited amorphous CrGT film measured at a heating rate of 50°C/min. An exothermic peak corresponding to crystallization was clearly observed and the crystallization starting temperature, T s, was 285°C. The fraction of crystallization, x, at a temperature T was defined as x = A T/A. As shown in Fig. 1(a), A is the total area of the exothermic peak between crystallization starting (T s) and finishing (T f) temperatures, and A T is the area between T s and the temperature T. [Reference Henderson10] Figures 1(b) and 1(c) shows the temperature dependence of x at various heating rates for CrGT and GST films. Based on the results in Figs. 1(b) and 1(c), the local activation energy for crystallization, E a(x), at different x was estimated using the following equation suggested by Ozawa:[Reference Ozawa11, Reference Ozawa12]
 $$\log \beta = \hbox{const}. - 0.4567\displaystyle{{E_{\rm a}(x)} \over {RT}},$$
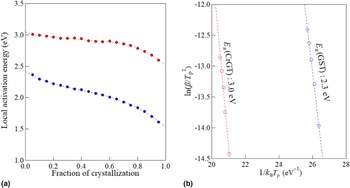
where, β is the heating rate, R is the gas constant, and T is the temperature at x. The E a(x) was estimated from a linear slope in the plots of log β as a function of reciprocal temperature in the range of 0.05 ≦ x ≦ 0.95. Figure 2(a) shows the plot of E a(x) as a function of x for CrGT and GST films. The E a(x) of the CrGT film decreased slightly with an increasing x until x reached around 0.8, after which E a(x) started to steeply decrease in the final stage of the crystallization. In comparison, the E a(x) of the GST film started to decrease notably by increasing x in the first stage of the crystallization. This E a(x) gradually decreased with an increasing x upto x = 0.7 and then steeply decreased in the latter stage of the crystallization (x > 0.7). The E a(x) versus x curve for the GST is in good agreement with a previous report.[Reference Sutou, Kamada, Sumiya, Saito and Koike13] These variations of E a(x) during crystallization indicate that the crystallization mechanism changed from a nucleation process to a growth process as crystallization progressed.[Reference Lu, Yan and Huang14] The overall average activation energies for crystallization E a of CrGT and GST films were estimated to be 2.9 and 2.0 eV, respectively. These values are almost equal to the activation energies of 3.0 eV for CrGT and 2.3 eV for GST, which were obtained by the Kissinger plots using the DSC exothermic peak temperature [Fig. 2(b)]. The high E a of the CrGT film indicates that the CrGT film showed higher thermal stability in the amorphous phase than that of the GST film.
(a) DSC curve obtained at a heating rate of 50°C/min for the CrGT film. The dashed curve represents the base-line obtained by curve fitting. Fraction of crystallization, x, as a function of temperature at heating rates of 10–50°C/min for (b) CrGT and (c) GST films.

(a) Local activation energy, E a(x), as a function of the fraction of crystallization, x, for CrGT (red-filled circles) and GST (blue-filled circles) films, wherein the dashed lines are fitted curves. (b) Kissinger plot based on the peak temperature at heating rates of 10–50°C/min for CrGT (red open circles) and GST (blue open circles), wherein the dashed lines indicate an approximate straight line obtained by the least squares method.

Crystallization mechanism
As shown in Fig. 2(a), the variation of E a(x) with increasing x indicates that the crystallization process was not a single step process. Lu et al. proposed that a local Avrami exponent n(x) for different x can be calculated based on the following equation for nonisothermal experiments:[Reference Lu, Yan and Huang14]
 $$n(x) = \displaystyle{{ - R\partial \hbox{ln}\lcub { - \hbox{ln}\lpar {1 - x} \rpar } \rcub } \over {E_{\rm a}(x)\partial (1/T)}},$$
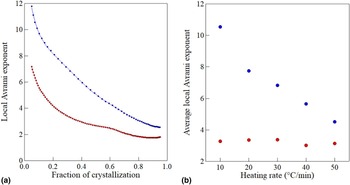
where x is the fraction of crystallization, R is the gas constant, E a(x) is the local activation energy, and T is the temperature. Figure 3(a) shows the calculated local Avrami exponent as a function of x at a heating rate of 40°C/min in the range of 0.05 ≤ x ≤ 0.95 based on the results in Fig. 2(a). The n(x) of both CrGT and GST films decreased by increasing x, indicating a variation in the crystallization mechanism corresponding to the progress of crystallization.
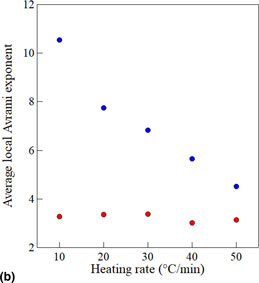
(a) Local Avrami exponent, n(x), as a function of the fraction of crystallization, x, for CrGT (red-filled circles) and GST (blue-filled circles) films obtained at a heating rate of 40°C/min. (b) Average local Avrami exponent as a function of the heating rate for CrGT (red-filled circles) and GST (blue-filled circles) films.

An Avrami exponent that is dependent on nucleation- and growth-processes can be classified as follows:[Reference Ranganathan and Heimendahl15, Reference Ramanan and Fish16]
 $$n = a + bp,$$
where a indicates the nucleation rate and is considered as a = 0 for zero nucleation rate; 0 < a < 1 for a decreasing nucleation rate with time; a = 1 for a constant nucleation rate; and a > 1 for an increasing nucleation rate with time. b refers to the dimensionality of crystal growth and is categorized as b = 1, 2, and 3 for one-dimensional, two-dimensional, and three-dimensional growth, respectively. p represents the crystal growth mechanism: p = 0.5 and 1 for diffusion-controlled growth and interface-controlled growth, respectively.
The crystallizations of CrGT and GST films were polymorphic (i.e., amorphous and crystalline phases have the same composition). Their crystal growths, therefore, were dominated by an interface-controlled mechanism. Hence, p should equal to 1 in the whole crystallization process. In the initial range of x < 0.2 for the CrGT film, the local Avrami exponent was more than 4, indicating three-dimensional (b = 3) and interface-controlled growth (p = 1) at an increasing nucleation rate (a > 1). Such a large Avrami exponent indicates the occurrence of a transient nucleation process by an increasing nucleation rate. The crystallization, thus, was dominated by nucleation in the early stage.[Reference Kelton, Greer and Thompson17] The n(x) of the CrGT film gradually decreased from 4 to 2.5 by increasing x in the range of 0.2 < x < 0.6, suggesting that nucleation rate and dimensionality of crystal growth decreased by increasing x. When x > 0.6, the n(x) further decreased to around 1.7. The crystallization mechanism becomes two- or one-dimensional growth at zero nucleation rate, indicating that the dominant mechanism in the latter stage was crystal growth.
Meanwhile, the n(x) of the GST film was higher than that of CrGT film throughout the entire crystallization process, which drastically and monotonically decreased by increasing x. When x < 0.6, the n(x) of GST film was larger than 4, suggesting a transient nucleation process with an increasing nucleation rate.[Reference Kelton, Greer and Thompson17] The n(x) monotonically decreased from 4 to 2.5 with an increasing x upto x = 0.6, suggesting three- or two-dimensional growth at a low nucleation rate. The n(x) of the GST film was more than 3 even when x reached 0.8. The entire crystallization process of the GST film, thus, was mainly dominated by the nucleation process.
Figure 3(b) shows the average local Avrami exponent, n a, as a function of heating rate, β, for CrGT and GST films, which helps with the elucidation of the dominant crystallization mechanism for the overall crystallization process of CrGT and GST films. As shown in Fig. 3(b), the n a of the CrGT film was less dependent on β and was around 3, indicating that the CrGT film exhibited a three-dimensional (b = 3) growth-dominant crystallization under site-saturated nucleation (a = 0). Meanwhile, the n a of the GST film at β = 10°C/min was more than 10, indicating a transient nucleation process.[Reference Kelton, Greer and Thompson17] The n a drastically decreased with an increasing β, which was more than 4 even at β = 50°C/min. The GST film, thus, showed a nucleation-dominant crystallization (a > 1, b = 3) process in the range of 10 ≤ β ≤ 50°C/min.[Reference Hurst, Horie and Khulbe18, Reference Nishi, Kando and Terao19] It is worth noting that the n a of the GST film was likely to approach asymptotically to a value of 3 at a high heating rate. This result implies that at a high heating rate, a crystallization process was governed by a three-dimensional growth-dominant crystallization under site-saturated nucleation, even in an amorphous film showing a nucleation-dominant crystallization at a low heating rate.[Reference Orava, Greer, Gholipour, Hewak and Smith9]
Rate of crystallization
The kinetic constant of crystallization that indicates the rate of crystallization, K, is given by the following Arrhenius-type equation:[Reference Augis and Bennett20]
 $$K = K_0\exp \left( { - \displaystyle{{E_{\rm a}} \over {RT}}} \right),$$
where, K 0 is the pre-factor of crystallization, R is the gas constant, and T is the temperature. We can evaluate the rate of crystallization at T using Eq. (4) if K 0 and E a for the crystallization are given. In this study, we derived K for the amorphous CrGT and GST as follows. Augis and Bennett proposed that the K 0 can be obtained by nonisothermal measurements, based on the following equation:[Reference Augis and Bennett20]
 $$\hbox{ln}\displaystyle{\beta \over {T_p - T_0}} = - \displaystyle{{E_{\rm a}} \over {RT_p}} + lnK_0,$$
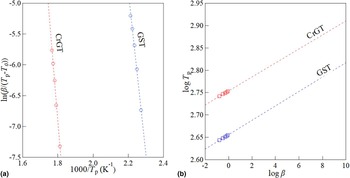
where T p is the temperature for the maximum exothermic peak in DSC measurement and T 0 is the initial temperature, which was 300 K in this study. Figure 4(a) shows the plots of ln(β/(T p–T 0)) as a function of reciprocal T p for CrGT and GST films. The plots of ln(β/(T p–T 0)) versus 1/T p showed a linear relation and the intercept on the y-axis gave K 0 [Fig. 4(a)]. The estimated K 0 was 6.9 × 10²³ and 9.5 × 10²²/s for CrGT and GST films, respectively. Generally, the crystallization rate was the largest at T p.[Reference Marseglia21, Reference Gao and Wang22] Therefore, we estimated the K at T p under a heating rate of 50°C/min [Fig. 1(a)] based on Eq. (4). For this estimation, the E a obtained by a Kissinger plot [Fig. 2(b)] was used. The calculated K for CrGT and GST films was 1.4 × 10⁻³ and 2.1 × 10⁻³/s, respectively. The estimation indicates that the rate of crystallization of the amorphous CrGT was almost the same as that of the amorphous GST, suggesting that the CrGT and GST exhibit a fast crystallization speed.
(a) The plot of ln(β/(T p–T 0)) as a function of reciprocal peak temperature for CrGT (red open circles) and GST (blue open circles) films, wherein the dashed lines indicate an approximate straight line obtained by the least squares method. (b) The plot of logT p as a function of logβ for CrGT (red open square) and GST (blue open square), wherein the dashed lines indicate an approximate straight line obtained by the least squares method.

Furthermore, in this study, by considering the practical PCRAM operation, we also evaluated the kinetic constant of crystallization for several hundred nanoseconds.[Reference Burr, Breitwisch, Franceschini, Garetto, Gopalakrishnan, Jackson, Kurdi, Lam, Lastras, Padilla, Rajendran, Raoux and Shenoy23] Usually, an amorphous PCM is heated above the crystallization temperature at a heating rate of 108–109 °C/s in practical PCRAM operation.[Reference Orava, Greer, Gholipour, Hewak and Smith9, Reference Cheng, Kao, Lee and Chin24] It is known that T p is high at a fast heating rate. T p as a function of heating rate β is expressed by the following equation:[Reference Kasyap, Prajapati and Pratap25]
 $$\hbox{log}T_p = a\hbox{log}\beta + \hbox{log}T_0,$$
where a and T 0 are constant. Figure 4(b) shows the plots of logT p as a function of logβ for CrGT and GST films. From the linear relation, the T p obtained under a heating rate of 109 °C/s was estimated to be 513°C and 359°C for CrGT and GST films, respectively. Then, we estimated the K at T p obtained at a heating rate of 109 °C/s under the assumption that the E a is independent of heating rate, although E a has been reported to be small at a very fast heating rate (>500°C/s).[Reference Orava, Greer, Gholipour, Hewak and Smith9] K was estimated to be 4.0 × 10⁴ and 4.4 × 10⁴/s for CrGT and GST films, respectively. The obtained results imply that the crystallization rate of the CrGT was almost the same with that of the GST even at a very high heating rate of practical PCRAM operation.
Conclusions
The crystallization mechanism and kinetics of the amorphous CrGT film were investigated using nonisothermal measurements. Comparing with the GST film, the amorphous CrGT film required a larger local activation energy in the whole crystallization process, leading to a high thermal stability of the amorphous phase. The local Avrami exponent analysis indicated that both CrGT and GST films showed the changes in crystallization mechanism from a nucleation- to a growth-dominant process during the progress of crystallization. It was found by the average Avrami exponent value that the dominant crystallization mechanisms for the overall crystallization processes of CrGT and GST films were growth-dominant and nucleation-dominant, respectively. The average Avrami exponent of the GST film decreased with an increasing heating rate and approached asymptotically to 3, while that of the CrGT film was less dependent on the heating rate and showed a constant value of around 3. Therefore, at a high heating rate, both films showed a three-dimensional growth-dominant crystallization under site-saturated nucleation. The kinetic constant of the CrGT film was evaluated to be almost the same as that of the GST film even under a fast operation. The obtained results indicate that the CrGT film having a high thermal stability of the amorphous phase showed a fast crystallization speed, which enables a fast operation of CrGT PCRAM.
Acknowledgments
This work was supported by KAKENHI (grant nos. 18H02053 and 17J02967).