

INTRODUCTION
As earlier landmark papers by Baugh (Reference Baugh, Guy, Feagin, Schiffrin and Baugh1996) and Rickford & McNair-Knox (Reference Rickford, McNair-Knox, Biber and Finegan1994) demonstrate, the linguistic enquiry into the life span of the individual is by no means a novel undertaking. But since Sankoff & Blondeau (Reference Sankoff and Blondeau2007) called for sociolinguists to pay greater attention to the degree and kind of lability that occurs during speakers' life span, the field has seen a flurry of published articles, plenary talks, and conference workshops on panel studies (consider, for example, Sankoff's (Reference Sankoff2013a) plenary at NWAV43 or the workshop on panel data at Methods XV in 2014). Coupled with a maturation of the field and thus the availability of older data sets for panel studies, the resurgence of interest in the life span has sparked important discussions about the extent to which recent findings support or challenge previous generalizations, such as Labov's (Reference Labov1994) seminal principles of language change.
Researchers have also started to question longstanding hypotheses regarding the rate and trajectory of change, which (going back to Lenneberg Reference Lenneberg1967) rely on the assumption of a critical period for second language and second dialect acquisition (see also Chambers Reference Chambers2003). Discussions tend to center around the ‘apparent time hypothesis’ formulated by Labov (Reference Labov1972a), which postulates that the ‘individual's speech patterns are largely fixed by early adulthood’ (Wagner Reference Wagner2012a:372). During ongoing language change, this hypothesis predicts that younger speakers, especially those in the adolescent age brackets (Eckert Reference Eckert, Finegan and Rickford2004, Reference Eckert, Kotthoff and Mertzelufft2013), push forward incoming forms, resulting in escalating frequencies across real time. In early adulthood, however, as speakers' habitus establishes itself, linguistic stability sets in. Thus, post adolescence, ratios of innovative forms are hypothesized to remain relatively constant across the life span of the individual speaker, impervious to the continuing incrementation amongst the younger age brackets. As the change progresses across the community, the process of incrementation cum stabilization repeats itself generation after generation of speakers. Consequently, at any one time, the younger age brackets produce increasingly higher ratios of the incoming variant, which they then carry over into adulthood.
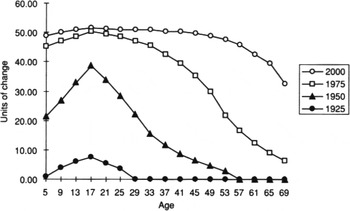
When computed over a number of time zones, the apparent time model predicts that the increasingly saturated system of the younger speakers trickles down into the older age brackets as the high-frequency users grow older themselves (see Figure 1 from Labov Reference Labov2001a:453, Tagliamonte & D'Arcy Reference Tagliamonte and D'Arcy2009).Footnote 1
Hypothetical scenario of language change (stability across the life span assumed; from Labov Reference Labov2001a:453).

The assumption that ‘speakers’ ages place their linguistic systems in a temporal relationship with each other, [so that] the childhood linguistic system … determines adult speech production, and adult linguistic production is stable’ underpins not only apparent time research (Bowie & Yaeger-Dror Reference Bowie, Yaeger-Dror, Honeybone and Salmons2015). Comparative real-time analysis is also fundamentally dependent on the validity of the critical period in language acquisition and with it the apparent time hypothesis (see Bailey, Wikle, Tillery, & Sand Reference Bailey, Wikle, Tillery and Sand1991; Tillery & Bailey Reference Tillery and Bailey2003; Bailey Reference Bailey, Chambers, Trudgill and Schilling-Estes2005).
But whereas the ‘majority of individuals remain stable after adolescence’ (Wagner Reference Wagner2012a:377), research across the life span has uncovered a number of cases where speakers' linguistic system is less fixed than initially assumed. An increasing number of longitudinal trend and panel analyses reveal that language change tends to engender a certain amount of instability across the speaker's life (see Arnaud Reference Arnaud1998; Harrington, Palethrope, & Watson Reference Harrington, Palethrope and Watson2000a,Reference Harrington, Palethrope and Watsonb; Blondeau, Sankoff, & Charity Reference Blondeau, Sankoff and Charity2002; Sankoff Reference Sankoff, Ammon, Dittmar, Mattheier and Trudgill2005; Sankoff & Wagner Reference Sankoff and Wagner2006, Reference Sankoff and Wagner2011). Postadolescent individuals have been found to engage with ongoing language change in various ways, resulting in two broad patterns of instability across the life span:
(i) ‘Life-span change’, which is the case when older speakers ‘are swept away with the historical language change in the community’ during their adult lives (Sankoff & Blondeau Reference Sankoff and Blondeau2007:562) and adapt their linguistic habitus towards the direction of the community-wide trend (see Harrington et al. Reference Harrington, Palethrope and Watson2000a,Reference Harrington, Palethrope and Watsonb; Nahkola & Saanilahti Reference Nahkola and Saanilahti2004; Sankoff Reference Sankoff, Ammon, Dittmar, Mattheier and Trudgill2005; Pope, Meyerhoff, & Ladd Reference Pope, Meyerhoff and Ladd2007; Wagner Reference Wagner2012a,Reference Wagnerb). What this effectively means is that models of language change that assume stability across the life span underestimate the rate of change (Boberg Reference Boberg2004; Sankoff & Blondeau Reference Sankoff and Blondeau2007; Bowie & Yaeger-Dror Reference Bowie, Yaeger-Dror, Honeybone and Salmons2015; see scenario 1 below).
(ii) ‘Retrograde movement’ against the community-wide change, which occurs when postadolescent speakers move away from ongoing change and become more conservative over time (Sankoff & Wagner Reference Sankoff and Wagner2006, Reference Sankoff and Wagner2011). If speakers past adolescence/early adulthood withdraw from ongoing changes, traditional models of language change might overestimate the rate of change (see scenario 2 below).
Therefore, synchronic analyses, which rely on the apparent time hypothesis, need to be complemented with real-time data (see Labov Reference Labov2007), such as replications of apparent time studies (Pope et al. Reference Pope, Meyerhoff and Ladd2007), comparisons between present-day data and ‘legacy’ data (Maclagan & Gordon Reference Maclagan and Gordon2004), or panel data (Sankoff & Wagner Reference Sankoff and Wagner2006, Reference Sankoff and Wagner2011; Sankoff & Blondeau Reference Sankoff and Blondeau2007).
Scenario 1:Life-span changeOlder speakers pick upConsequence:
forms incrementallyModels underestimate
used in community rate of change
Scenario 2:Retrograde changeMiddle-aged speakersConsequence:
move away fromModels overestimate
ongoing changerate of change
The present article contributes to the increasingly rich field of research on the life span by examining speakers' adjustments to ongoing changes in the quotative system across apparent and real time. Based on a combination of trend data (i.e. real-time data collected from different speakers) and panel data (i.e. real-time data collected from the same speakers), I examine the stability of speakers' language use during the rapid incursion of an innovative form, be like, into the system of speech and thought reporting.
After introducing the data sets and the variable under investigation, I briefly sketch the socioideological field in which be like operates. Tenacious ideologies associating the form with youthful incoherence provide considerable incentives to avoid the quotative newcomer past adolescence (see Buchstaller Reference Buchstaller2006a; D'Arcy Reference D'Arcy2007; Jamsu Reference Jamsu2008). The skyrocketing be like rates reported for young speakers in some communities, by contrast, might indicate that the variant has staying power, despite its overt stigmatization (Gardner, Denis, Brook, & Tagliamonte Reference Gardner, Denis, Brook and Tagliamonte2013).
To date, the available information on speakers' loyalty to be like across their life span is conflicting (Singler Reference Singler2004; Buchstaller Reference Buchstaller2006b; Tagliamonte & D'Arcy Reference Tagliamonte and D'Arcy2007; Cukor-Avila Reference Cukor-Avila2012; Tagliamonte & Wagner Reference Tagliamonte and Wagner2014). The trend analysis reported here suggests that speakers in the northeast of England move away from the innovative quotative and retreat towards more conventional variants as they reach middle age. This is an exciting finding since it implies that during a period of vigorous language change, which has reached staggering heights amongst younger speakers in some communities (Gardner et al. Reference Gardner, Denis, Brook and Tagliamonte2013), a generation of speakers turns its back on the robust ongoing trend. Appealing to the age-specific ideological load of be like, as well as to interactional, personal, and stylistic factors, I propose that a social constructivist approach can go some way towards understanding the strategic use or avoidance of highly iconic forms such as be like.
The last section provides a counterpoint to the trend study reported above by focusing on a small panel sample of six speakers. This analysis, which is much more exploratory in nature, investigates the adaptive behaviour of six older individuals (ages sixty-four to seventy-four) to the ongoing change in the quotative system. While the study is based on low numbers of tokens and therefore needs to be treated with caution, four of the six panel speakers appear to engage in a certain amount of life-span change, adjusting their speech in the direction of the change during the forty-two years that separate the two data sets. This finding supports previous reports that older speakers can display adaptive behavior to ongoing changes in community norms that are sweeping through the younger populations around them (Arnaud Reference Arnaud1998; Blondeau et al. Reference Blondeau, Sankoff and Charity2002; Sankoff Reference Sankoff, Ammon, Dittmar, Mattheier and Trudgill2005; Sankoff & Wagner Reference Sankoff and Wagner2006, Reference Sankoff and Wagner2011). In contrast to the vast majority of previous research on life-span change, however, the speakers investigated here do not catch up with a community that is moving towards a new standard or towards overtly prestigious forms. Rather, in the case of be like, older speakers appear to pick up on a highly stigmatized incoming feature that is situated well above the level of consciousness and that has attracted ample prescriptive commentary in recent years. Crucially, the two social aspirers in the data set fail to participate in the robust incoming trend.
Overall, the research reported here suggests that speakers' quotative use is less stable across their life time than previously assumed, being liable to modification amongst the middle age brackets as well as in older age. The article thus contributes to the growing body of panel research that aims to ‘determine the scope and limitations of speakers' abilities to change their speech’ (Bowie & Yaeger-Dror Reference Bowie, Yaeger-Dror, Honeybone and Salmons2015).
DATA
The northeast of England has been the site of large-scale corpus building activity since the late 1960s (Mearns Reference Mearns and Hickey2015). The analysis presented here is based on two subsets taken from this longitudinal data set. Data for the trend study was extracted from the Diachronic Electronic Corpus of Tyneside English (DECTE), a collection of sociolinguistic interviews conducted in Newcastle and its surrounding areas since 2007 (Corrigan, Mearns, Buchstaller, & Moisl Reference Corrigan, Mearns, Buchstaller, Moisl, Corrigan, Mearns and Moisl2016). All interviews in DECTE consist of spontaneous talk-in-interaction, usually at the home of one of the informants. The recordings were conducted with a consistent ethnographically informed collection strategy, and they contain a range of genres typical of spontaneous conversation, such as gossip, projections about the future, narratives, argumentation, as well as some grammaticality judgements (Rickford & McNair-Knox Reference Rickford, McNair-Knox, Biber and Finegan1994; Gregersen & Barner-Rasmussen Reference Gregersen and Barner-Rasmussen2011; Rickford & Price Reference Rickford and Price2013). For the trend analysis presented here, ninety-six speakers across the age ranges were chosen (forty-nine from the 2007–2009 time slice and forty-seven from 2011–2013).
The panel study is based on an on-going project (Buchstaller Reference Buchstaller2013–2017), which aims to produce a second time slice to a heritage corpus, the Tyneside Linguistic Survey (TLS), originally collected in the 1960 and 70s. The present article reports on six of the original informants, who were first recorded in 1971 and re-interviewed forty-two years later in 2013. The replication study carefully reproduced the interactional setting of the 1971 interview (see Gregersen & Barner-Rasmussen Reference Gregersen and Barner-Rasmussen2011): informants were again recorded at their home (with the exception of a former religious education teacher who preferred to be interviewed at the university). As in the 1960s and 70s, the fieldworker was a male Newcastle University researcher originating from Sunderland,Footnote 2 whose accent the informants were unable to localise.Footnote 3 The later interviews also aimed to recreate the structure of the original recording as closely as possible, asking informants whether they remembered and indeed agreed with their initial answers to many questions.Footnote 4
Tyneside, like most urban centres in the developed world (including the sites of famous longitudinal trend and panel research such as Montreal, Copenhagen, or Philadelphia) has undergone important changes since the first set of interviews was recorded in the 1960s. As one of our informants describes in example (1), the core traditional economies, which used to provide mass employment in the northeast region, declined sharply during the 1970s and 1980s (Pike, Rodriguez-Pose, & Tomaney Reference Pike, Rodriguez-Pose and Tomaney2006; Tomaney Reference Tomaney2006).
(1) ehm that was around the eighties especially
with the shipyards closing, the mines closing, steel works
you know Consett became a ghost town …
ehm when they've lost their job through no fault of their own
and then they can't get a job because there's none to be had …
Following this economic downturn, which characterizes northern industrial cities in the British Isles more generally, the Tyneside region has successfully reinvented itself as a retail, cultural, and educational centre (see OECD 2006; Vall Reference Vall2007; Beal, Burbano-Elizondo, & Llamas Reference Beal, Burbano-Elizondo and Llamas2012).Footnote 5
Questions in the 2013 interview enquired about the informants', their friends', and families' lives since the 1971 survey was conducted. This line of questioning yielded a wealth of ethnographic background information about the major sociodemographic changes in post-World War II Britain and their repercussions on Tyneside society. It also provided us with crucial insights into the individual speakers' life course and the way in which they positioned themselves in relation to this economic upheaval. Crucially, as we see later, the social trajectory of some of the panel speakers mirrors the change in the northeast from an industrial to a postindustrial economy.
The overall sampling frame thus consists of a trend sample that combines real and apparent time data plus a smaller panel sample. The data yielded 3,520 quotative tokens overall, which were extracted and coded by a member of the research team. For consistency and quality control, all tokens were checked by myself.
RAPID AND GLOBAL LANGUAGE CHANGE: THE QUOTATIVE SYSTEM
Cross-linguistically, the quotative system is the site of systemic expansion along typologically similar lines, resulting in the layering of variants and competition for functional niches (see Güldemann Reference Güldemann2008; Buchstaller & van Alphen Reference Buchstaller and van Alphen2012). Spoken varieties of English have been similarly affected, recruiting lexemes from source areas such as approximation (be like), quantification (be all), as well as generic verbs of motion and action (go; see Vandelanotte Reference Vandelanotte, Buchstaller and van Alphen2012; Levey, Groulx, & Roy Reference Levey, Groulx and Roy2013). The majority of changes proceed along two well-defined structural templates. Old lexical options, which predominantly follow the constructional template noun phrase + transitive verb of reporting + quote (in 2) are now competing with innovative forms, which tend to appear in the sequence nounphrase + copula + (discourse marker) + quote (in 3).
(2) Old forms: noun phrase + transitive verb of reporting + quote
a. If you touched a one they would say “wey you're on”.
b. And I thought “Well we need some more popcorn”.
c. and then I decided “oh I want to do art after all”
(3) New forms: noun phrase + copula + (discourse marker) + quote
a. She's like “This is ridiculous”
b. My mum feels kinda “bleugh”
c. He goes Ø “[makes face]”
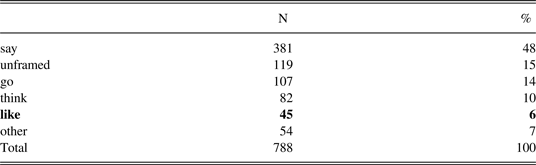
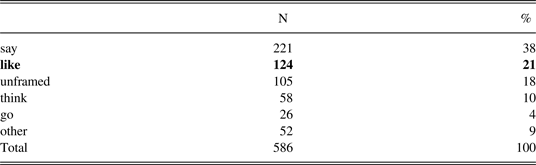
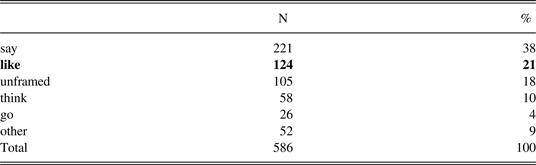
This article focuses primarily on be like (in 3a), the globally most vigorous incoming variant, which has altered the quotative landscape in less than three decades (the form was first attested in Butters (Reference Butters1982); for studies investigating other quotative newcomers see Macaulay (Reference Macaulay2006), Rickford, Buchstaller, Wasow, Zwicky, & Traugott (Reference Rickford, Buchstaller, Wasow, Zwicky and Traugott2007), and Fox (Reference Fox, Buchstaller and van Alphen2012) inter alia). Tables 1 and 2 (from Buchstaller Reference Buchstaller2014a:153) display the proliferation of be like within the quotative repertoire on Tyneside between 1994 (6%) and 2011 (21%).
Quotative distribution on Tyneside in 1994.

Quotative distribution on Tyneside in 2011.
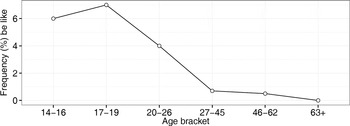
As illustrated in Figure 2, when plotted across the age bands in apparent time, be like exhibits the profile typical for ongoing change in progress, including decreasing frequencies with increasing age and a peak during the adolescent years. Similar trends can be observed in other varieties of English (see Tagliamonte & D'Arcy Reference Tagliamonte and D'Arcy2009 for Toronto, D'Arcy Reference D'Arcy2009 for New Zealand, Cukor-Avila Reference Cukor-Avila2012 for Springville, Texas).
Distribution of be like in Derby and Newcastle in 1994–1995 (Buchstaller Reference Buchstaller2006b:9, Nall quotes = 2064, Nbe like = 93).

While be like production peaked at around 6% in data collected in 1994–1995, more recent research suggests the innovation has since impacted with such vigor on the adolescent grammar in some communities that it all but squeezes its competitor forms out of the system. Tagliamonte and her collaborators (Gardner et al. Reference Gardner, Denis, Brook and Tagliamonte2013) report peak frequencies of 84% in data collected in the last five years in Toronto. Hence, in the communities that harbour such accelerated ratios of be like, the change has almost come to completion amongst the mid to late teens.Footnote 6
Given the robustness of the change in progress we might thus want to ask why speakers would move away from this ongoing community-wide trend as they leave adolescence behind. The answer might lie in socioideological factors.
ATTITUDES TOWARDS BE LIKE
By and large, Western mainstream societies attach a high market value to the use of the legitimized or standard language and inversely a low value to forms associated with youth, minorities, and/or lower socioeconomic groupings (see Milroy Reference Milroy2001; Fought, in Bierma Reference Bierma2005; D'Arcy Reference D'Arcy2007). Like (both as a quotative and a discourse marker) seems to trigger especially vitriolic reactions amongst the prescriptivist camp. But whereas the form is often derided as ‘verbal garbage’ (Zernicke Reference Zernicke1999) and linguistic ‘detritus’ (Schneider Reference Schneider1999) in the mainstream press, it seems to be much more positively connoted amongst younger cohorts. Surveys conducted in New York City and on Tyneside (Buchstaller Reference Buchstaller2014a) revealed that respondents below thirty five tend to perceive be like as indicative of attractive, extroverted, fashionable, and confident speakers (see also D'Arcy Reference D'Arcy2007, Jamsu Reference Jamsu2008, Carey Reference Carey2013). The age-dependent social indexicality of be like fits well with Eckert's (Reference Eckert2008:1) argument that ‘the meanings of variables … constitute … an indexical field, or constellation of ideologically related meanings, any of which can be activated in the situated use of the variable’.
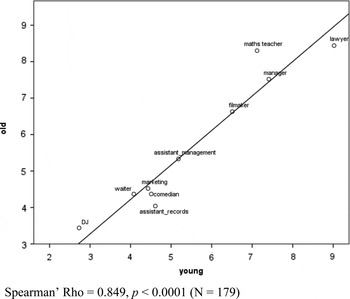
Given the well-known ideological processes that associate youth features with inarticulateness, laziness, and lack of education (Schneider Reference Schneider1999; Fought, in Bierma Reference Bierma2005; D'Arcy Reference D'Arcy2007), it should not strike us as surprising that some traditionalists consider be like inappropriate in academic and professional domains. Numerous schools and universities have attempted to ban the use of be like, hoping to stamp out the form and thereby to improve their students' chances on the professional job market (see Buchstaller Reference Buchstaller2014a). Consider in this respect a letter sent to Mariella Frostrup (Reference Frostrup2014), the agony aunt for the British newspaper The Guardian, from a mother who worried that her ‘daughter sounds uneducated because she says like so much’. Many of the comments contained similar sentiments to those voiced by an online commentator who observed that ‘saying like all the time will not fly in a professional situation’. Experimental research suggests that attitudes linking be like with a lack of professionalism are pertinent: Singler (Reference Singler2004) conducted an association test in New York City, which revealed a consistent correlation between a person's rate of be like use and their perceived professional status. Figure 3 showcases the results of a follow-up experiment that tested for age effects in occupational associations in Newcastle upon Tyne. Younger (<36) and older (>37) respondents were asked to order ten different professions according to how frequently they would expect them to use be like (from one to ten) with lower numbers corresponding to higher rate of use.
Associations of be like with speaker occupation by age, Newcastle data (low numbers in the figure correspond to high expected frequency of be like use).a

The hypothesis that higher status professions, such as teachers, lawyers, or managers, are perceptually connected with lower rates of be like use is borne out by my data (see Dailey-O'Cain Reference Dailey-O'Cain2000; Singler Reference Singler2004; Fought, in Bierma Reference Bierma2005; D'Arcy Reference D'Arcy2007; Jamsu Reference Jamsu2008). These professions correspond to the linguistically sensitive occupations described in Sankoff & Laberge (Reference Sankoff, Laberge and Sankoff1978), where the standardising pressures of the marché linguistique are most intensely felt (Bourdieu & Boltanski Reference Bourdieu and Boltanski1975). Entertainment jobs, by contrast, and nonpermanent lines of work were expected to produce high rates of innovative quotatives. The very high correlation coefficient (Spearman's Rho = .849, p < 0.0001) suggests that the two age groups share the perceptual association of higher status professions with lower rates of be like use.
While Singler (Reference Singler2004) interprets these findings as evidence that be like is unsuitable for professional occupations, the results in Figure 3 might also reflect such associations more indirectly: if my informants recognise the socioindexical value of be like and if they expect assistants, comedians, and waiters to be younger than managers, lawyers, and maths teachers, we should not be surprised that they judge the former to be more likely to use be like. They might also expect them to produce more colloquial registers and talk about informal topics, both of which tend to generate more vernacular features. And given the tenacious link between ‘normality’ and ‘normativity’ (Foucault Reference Foucault1977), the use of be like by speakers holding professional careers might thus not only be unexpected; it might even be considered anomalous or discouraged.Footnote 7 These findings raise the question whether speakers might start abandoning be like and other linguistic resources that carry associations of youth, coolness, and informality in favor of more conventional variants as they leave school and university behind to enter the linguistic market.
RETROGRADE MOVEMENT?
Since Sankoff & Laberge's (Reference Sankoff, Laberge and Sankoff1978) foundational research on the linguistic marketplace, the variationist sociolinguistic enterprise has amassed a small but increasing body of evidence for the impact of ideological pressures on the use of stable linguistic variables. As individuals progress through more or less language-sensitive life stages across their life course, stable variants with low symbolic market value—such as /in/, multiple negation, or indeed proscribed lexical forms—tend not to carry over into more guarded styles produced during the middle age brackets (Trudgill Reference Trudgill1988; Chambers & Trudgill Reference Chambers and Trudgill1998; Downes Reference Downes1998; Labov Reference Labov, Eckert and Rickford2001b). What we are only just beginning to grasp, however, is the impact of prescriptive language ideologies on ongoing changes away from the standard, or in the case of the quotative system, away from older, more conventional forms. Wagner (Reference Wagner2012a:378) has argued that such changes in progress can be affected by ‘age-grading as marketplace pressure’, when individuals retreat from incoming variants and revert back to the standard as they are hit by increasing pressures of the linguistic market. Longitudinal research in Philadelphia suggests that speakers' movement away from community-wide changes can occur with ‘nearly-completed changes’, particularly with older, stigmatized features such as (aeh), or with features associated with negative cultural stereotypes (Labov, Rosenfelder, & Fruehwald Reference Labov, Rosenfelder and Fruehwald2013:32; see also Prichard & Tamminga Reference Prichard and Tamminga2012). Let us now investigate whether there are any indications that the rapid change that is currently sweeping the quotative system is arrested in the middle age brackets.
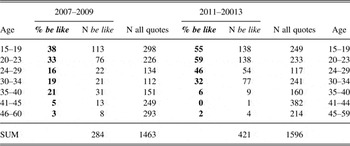
The results reported here are based on two subcorpora of the DECTE corpus (Corrigan et al. Reference Corrigan, Mearns, Buchstaller, Moisl, Corrigan, Mearns and Moisl2016) containing overall ninety-six speakers, forty-nine from the 2007–2009 time slice and forty-seven from 2011–2013, who produced overall 3,059 tokens of quotation. Apart from the speakers ages thirty to thirty-four in 2007–2009 and the two older age bands (see note to Table 3), all age bands contain at the minimum five individuals.Footnote 8 While the recordings are not panel data, that is, the speakers are not the same across the two subcorpora, the corpus is constructed in such a way that it allows diachronic comparisons across the two subsets: The recordings were collected on average four years apart and the age brackets are set up so that the speakers situated in the corresponding higher age bracket are between four and six years older. Thus, if we rely on the notion of diachronic surrogacy customary in variationist sociolinguistics (Cedergren Reference Cedergren1973; Labov Reference Labov and Heilmann1975; Chambers & Trudgill Reference Chambers and Trudgill1998; Meyerhoff Reference Meyerhoff2006) and treat the speakers of the later corpus as temporal proxies for the speakers of the first data set, the DECTE trend corpus gives us the opportunity to monitor the behaviour of the 2007–2009 speakers as they move into the next age bracket four-to-six years later.
Use of be like (in %) across the age bands in data recorded on Tyneside 2007–2009 and 2011–2013.a

aDue to their low rates of be like use, the two oldest age bands contain seven to nine speakers in order to maximise the chances of capturing the low frequency feature.
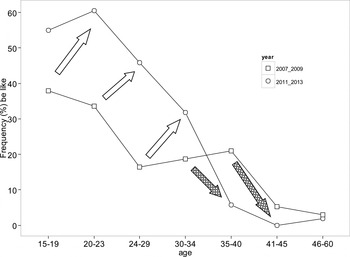
Given the vigor with which be like has conquered English-speaking communities across the globe (Gardner et al. Reference Gardner, Denis, Brook and Tagliamonte2013), its proliferation amongst the younger age brackets is entirely predictable. Table 3 and Figure 4 suggest that the fifteen to nineteen year-olds increment their proportional use of be like from 38% to 59% by the time they are twenty to twenty-three years old in 2011–2013. Also the speakers aged twenty to twenty-three display increasing be like ratios in the four years that lie between the collection of the two data sets (from 33% to 46%). As I discuss below, the trough amongst the twenty-four to twenty-nine year-old speakers in the 2007–2009 recordings (16%) is not the result of a few outliers but can be described as a general trend. By 2011–2013, however, the corresponding age group produces 32% be like frequency, an increase of about 15%, which brings them in line with the community-wide trend. In summary, amongst the younger age brackets, which are marked by the white arrows in Figure 4, speakers recorded from 2011–2013 produce consistently higher be like-ratios than their corresponding age group in the 2007–2009 recordings. The diachronic trajectory of be like amongst speakers aged twenty-nine and below can thus be interpreted as the result of ongoing or even accelerating language change (see Labov's Reference Labov1994 mechanisms of change in the community and the individual).
Use of be like (in %) across the age bands in data recorded on Tyneside 2007–2009 and 2011–2013.

Let us zoom in on the middle age ranges: in 2007–2009, the thirty to thirty-four year olds produce robust frequencies of be like (19%). But by the time these speakers (or rather their temporal proxies) have moved into the thirty-five to forty bracket, they have reduced their ratios to only 6%, a decrease of 13% points. In the next age band up, be like frequencies plummet from 21% in 2007–2009 to 0% in 2011–2013. What this effectively means is that the incrementation in be like frequencies comes to a sudden halt with the generation of the thirty to thirty-four year olds. Speakers in their thirties (marked via shaded arrows in Figure 4) do not participate in the progressive proliferation of be like. On the contrary, the middle age bands in the Tyneside data seem to be turning their back on the vigorous change.Footnote 9
Given the social psychological reality in which this form is used, I interpret the slump in be like production amongst the middle age brackets as incipient age-grading, that is, as a shift away from stigmatized variants due to the pressures of the linguistic marketplace (Bourdieu & Boltanski Reference Bourdieu and Boltanski1975; Sankoff, Cedergren, Kemp, Thibault, & Vincent Reference Sankoff, Cedergren, Kemp, Thibault, Vincent, Fasold and Schiffrin1989; Eckert Reference Eckert, Kotsinas, Stenstrom and Karlsson1997; Chambers Reference Chambers2003; Wagner Reference Wagner2012a,Reference Wagnerb). Gumperz (Reference Gumperz1968) similarly argued that speakers move towards ‘“superposed” variants, [which are] typically acquired with increased exposure to formal (including written) language as … [they] age’. Note that the trough amongst the mid twenties in the 2007–2009 data might be construed as an initial symptom of this avoidance behaviour, as speakers reach early adulthood. But while these speakers' be like frequencies seem to recover across the time frame covered by the data, it is the speakers in the next older age bracket who start to display corrective behavior towards conservative norms (see also below).
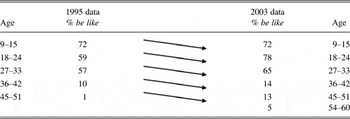
The contention that the rapid decline of be like use amongst the middle-aged speakers on Tyneside is not simply due to random fluctuation in the data is supported by the results of two research projects. Tagliamonte & Wagner (Reference Tagliamonte and Wagner2014) report that three out of their six panel speakers decrease their use of be like ratios as they move from ages sixteen to twenty-four. Singler (Reference Singler2004) describes the same recessive trend in the postadolescent age brackets in New York City. As illustrated in Table 4, whereas his younger age bands increase their frequency of be like between 1995 and 2003, the middle-aged speakers display a stark drop in be like production (compare the frequency of be like use amongst the twenty-seven to thirty-three year olds in 1995 (57%) with the corresponding thirty-six to forty-two age bracket in 2003 (14%)). Singler interprets these data to mean that the twenty-seven to thirty-three year olds fall off the be like bandwagon in the eight years that lie between the collection of the two data sets.Footnote 10
Change in be like use across the age bands in New York (in %; Singler Reference Singler2004).

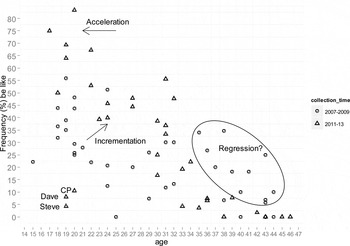
The findings reported in Singler (Reference Singler2004) and in Tagliamonte & Wagner (Reference Tagliamonte and Wagner2014) suggest that the dip in be like production is not confined to the Tyneside community but part of a larger recessive trend that impacts upon speakers as they enter the middle age brackets. But the question remains how robust these patterns are when broken down to the level of the individual speaker. To explore the consistency of the Tyneside sample, Figure 5 depicts the proportional use of be like across numerical age, split up by individual speaker.
Scattergram of be like frequencies on Tyneside (in %).

The scattergram reveals the increasingly focused use of quotative be like use across time. Apart from three outliers in the late teens—CP, Steve, and Dave, who are discussed below in more detail—the 2011–2013 data (depicted as triangles) display much less variability than the 2007–2009 data (represented as circles). Most importantly, the individual level results support the findings illustrated in Table 3 and Figure 4 on the basis of aggregate data. The main trends described above are clearly visible and are synthesized here briefly.
• The younger speakers recorded in the 2011–2013 recordings, represented by the triangles at the top left hand side of Figure 5, accelerate the change. While these age brackets approximate the high be like ratios reported from other British studies (Durham, Haddican, Zweig, Johnson, Baker, Cockeram, Danks, & Tyler Reference Durham, Haddican, Zweig, Johnson, Baker, Cockeram, Danks and Tyler2012), they do not (yet?) reach the soaring heights documented for North American varieties (Gardner et al. Reference Gardner, Denis, Brook and Tagliamonte2013).
• Comparing speakers with their respective older age proxies reveals the proliferation of be like across the two data sets. As the change gathers speed, the vast majority of younger speakers recorded in 2011–2013 exceed the be like frequencies of their diachronic age-mates. The incrementation across real time is particularly visible during the trough in the twenties in the 2007–2009 data but also more generally across the younger age brackets.
• But whereas younger speakers interviewed in 2011–2013 consistently surpass the be like ratios produced by their age mates recorded four years earlier, the trend starts to reverse in the early thirties. Beyond the age of about thirty-four, be like frequencies start to plummet amongst the speakers in the 2011–2013 data set (the triangles). This is in stark contrast to the speakers recorded in the earlier 2007–2009 data (the circles), who continue to produce healthy be like ratios well into their thirties and early forties, which only slowly and gradually decline as speaker age increases. Thus, as Figure 5 reveals, the only tokens of be like produced by speakers ages thirty-five and older are from individuals recorded in 2007–2009. This differential in be like production amongst the middle age brackets, where the 2007–2009 data points (the circles) consistently exceed the 2011–2013 data points (the triangles), is marked by the oval in Figure 5. What this effectively means is that, assuming comparability and temporal surrogacy between the two data sets, individual speakers do not stay stable across the four years that differentiate the two data sets. Quite the opposite, the pattern depicted in Figure 5 suggests that speakers reduce be like production as they move beyond their mid-thirties.Footnote 11 This type of avoidance phenomenon, where individuals change their linguistic behaviour against the direction of ongoing change, has been called ‘retrograde change’ (Sankoff & Wagner Reference Sankoff and Wagner2006:203). A similar scenario, where speakers revert back to the ‘conservative social prestigious form, … [while] rejecting’ the incoming majority trend (Wagner Reference Wagner2012a:379), has been described for the Montreal future, another robust and well-advanced change (Sankoff & Wagner Reference Sankoff and Wagner2006, Reference Sankoff and Wagner2011).
The interpretation of intraspeaker instability as life-span change hinges on the premise that certain linguistic forms are avoided precisely because they are considered inappropriate in certain domains, speech situations, and stylistic registers (see also Fought, in Bierma Reference Bierma2005; D'Arcy Reference D'Arcy2007; Rickford & Price Reference Rickford and Price2013).Footnote 12 This retrenchment towards the normative standard tends to occur primarily in language-sensitive social situations (Bourdieu & Boltanski Reference Bourdieu and Boltanski1975; Sankoff & Laberge Reference Sankoff, Laberge and Sankoff1978) and in more formal styles (Rickford & McNair-Knox Reference Rickford, McNair-Knox, Biber and Finegan1994; Alim Reference Alim2004; Wagner Reference Wagner2008). Based on these associations, Wagner (Reference Wagner2012a) has suggested operationalising social and stylistic factors as testing grounds for cases of suspected instability across the life span.Footnote 13 The following paragraphs attempt to locate stylistic correlates of linguistic instability in quotative choices across the speakers' life: if quotative be like is indeed starting to be age-graded, we might expect it to be skewed towards more interactive or emotionally involved genres amongst the population as a whole, but primarily amongst the middle age brackets, where speakers appear to buckle to increasingly acute market pressures.
STYLISTIC FACTORS
Style has been operationalised in sociolinguistic analysis in many different ways, from attention to speech to audience design, to interactive creation of personae and performative lamination (see Eckert & Rickford Reference Eckert and Rickford2001; Jaffe Reference Jaffe2009; see also Meyerhoff Reference Meyerhoff2006; Coupland Reference Coupland2007; Moore & Podesva Reference Moore and Podesva2009 inter alia). Since my data were conducted via dyadic sociolinguistic interviews, the classic Labovian (Reference Labov1972b:112) parameter ‘attention to speech’, which contrasts speech produced during an interview with the styles speakers resort to when reading a text or minimal pairs, were not available for investigation. Consequently, in this article, the stylistic implications of be like use are examined in three different ways. First, style is operationalised quantitatively, both as a function of the place in the interview (i.e. does be like occur within the first thirty minutes or after) and via its occurrence in narrative sequences. Then I examine the contribution of innovative quotatives to the construction of speaker stance or persona. The individual effects yielded by these investigations are subtle but suggestive in their convergence, corroborating jointly the hypothesis that, while speakers in their mid-thirties generally withdraw from quotative be like, they do so particularly in more monitored and deliberated styles.
Place in the interview
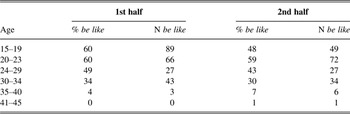
The ‘observer's paradox’ (Labov Reference Labov1966, Reference Labov, Baugh and Sherzer1984, Reference Labov2001a)—and with it the assumption that informants tend to shift towards more relaxed or unmonitored styles as they settle into the interview situation—is one of the basic tenets of variationist sociolinguistics (see e.g. Douglas-Cowie Reference Douglas-Cowie and Trudgill1978; Ashby Reference Ashby1981; Coupland Reference Coupland2007; Green Reference Green2012).Footnote 14 In order to capture the effect of the observer's paradox on quotative choices throughout the interview, the use of be like was tabulated in the 2011–2013 data for the first thirty minutes of the interview versus the rest in the data. As illustrated in Table 5, this relatively crude measure of occurrence revealed a subtle and consistent shift in be like use across the age bands.
Frequency of be like by place in interview (first thirty minutes versus later), 2011–2013 data.

Apart from the youngest age bracket, who use much higher rates of be like in the first half of the interview, speakers below thirty-five produce roughly the same ratios in the first thirty minutes and in the remainder of the interview. The rare tokens produced by the speakers in their mid-thirties and above, by contrast, occur predominantly in the second half of the interview. While this effect is rather subtle—the older age brackets do not produce very many tokens of be like—the temporal co-occurrence of the stylistic shift with the decline in frequency in this very age bracket is revealing.Footnote 15
It might be the case that speakers become increasingly aware of the negative associations with be like as they age (potentially acquiring some of these conservative perceptions themselves; see Chambers Reference Chambers2003). Consequently, as they progress into their mid-thirties, speakers might try to avoid these stigmatised variants in more monitored styles, for example, earlier in the interview. Alternatively, individuals of all ages might be aware of the age-dependent ideological load of be like and its sociosituational indexicalities (e.g. its associations with younger speakers and informal domains). Active modulation away from the proscribed form in more monitored speech, however, might only set in during the middle age brackets, that is, amongst those speakers who are increasingly susceptible to linguistic market pressures (Gumperz Reference Gumperz1968).Footnote 16 Further attitudinal testing of speakers' awareness of age-specific norms and expectations will tease apart these partially overlapping explanations.
Overall, bearing in mind the low numbers of tokens amongst the oldest speakers, the age-specific stylistic patterns in the Tyneside data substantiate the observations noted above: The withdrawal from be like in more monitored styles occurs precisely in the age band that retreats from the stigmatised form more generally—the middle-aged speakers. The findings reported in the next section further support this contention.
Occurrence of be like in narratives
The second approach to style adopted in this article is the use of quotation in storytelling sequences. Narratives of personal experience are of central importance to research on speaking style, since they have ‘proved to be … most effective’ (Labov Reference Labov1997:1) in eliciting the vernacular, that is, the most informal style of a speaker (consider Macaulay Reference Macaulay, Duncan-Rose and Venneman1988 for different conceptualisations of the vernacular; and see e.g. Eckert Reference Eckert2008 and Bucholtz Reference Bucholtz2009). This is because when telling absorbing or exciting stories, such as the famous danger of death narratives, speakers tend to ‘become [so] involved in the narration … that … signs of emotional tension appear’, which distracts them from the fact that they are being interviewed (Labov Reference Labov1972a:92). This emotional engagement, it is hoped, eases the observer's paradox in sociolinguistic interviews, resulting in less careful and monitored styles in which minimum attention is paid to speech.Footnote 17
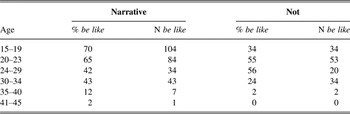
Narratives are the preferred locus of reported speech and thought sequences (Tannen Reference Tannen and Coulmas1986; Blyth, Recktenwald, & Wang Reference Blyth, Recktenwald and Wang1990; Johnstone Reference Johnstone2009; Buchstaller Reference Buchstaller2014a). What is more, storytellers exploit the salience of nonconventional quotative forms when faced with the burden to create a lively and captivating narrative. Innovative quotative forms such as be like but also this is + NP tend to be particularly ubiquitous in storytelling sequences (Tagliamonte & D'Arcy Reference Tagliamonte and D'Arcy2009; Fox Reference Fox, Buchstaller and van Alphen2012). This genre preference is evident in Table 6. With the exception of the twenty-four to twenty-nine year old speakers, whose behaviour is yet to be explained, all age bands use be like with higher rates of occurrence in narratives. Other genres, such as projections about the future, chit chat, argumentation, or indeed nonnarrative sequences of retelling past events (defined here following Labov & Waletzky Reference Labov, Waletzky and Helm1967 and Labov Reference Labov1997) are much less rich in be like use.
Use of be like in narrative sequences, 2011–2013 data.

Note that the few tokens of quotative be like that remain amongst the speakers aged thirty-five and older have almost entirely retreated into narratives, the genre that has been operationalised to epitomise the ‘high involvement’ styles in which speakers' emotional engagement with the storyline renders them less self-conscious regarding the ideological costs of their linguistic choices (Tannen Reference Tannen1984:54ff; cf. Labov Reference Labov1972a; Besnier Reference Besnier1994).
Two examples briefly illustrate the way in which such ‘macro-level social ideologies find their way into moment-to-moment speech actions and … low-level variation’ (Mendoza-Denton Reference Mendoza-Denton1997:144, see also Koven Reference Koven2001). In (4a), be like occurs in the course of an emotionally charged narrative about SKS's attempts to get her child to utter the word ‘mama’, saying it “to him loads in the hope he would say that first”. In the snippet replicated here, SKR re-enacts her disappointment at his first words being ‘daddy’. Her frustration is tangible, not only because of her emotionally charged choice of words but also because (4a) is produced with a laugh-crying voice and exaggerated prosody. In (4b), SKR tells a gripping narrative about forgetting her son's medication on a holiday trip. Her husband's words in (4b), which she recreates in a calm, measured tone of voice, are in marked contrast to her own mental state, which she describes as ‘very stressed’ and ‘crazy’.
(4) a. And I was like “after I carried you for eight and a half months this is your first word” (SKR, age 36)
b. So you were like “we will just buy some more, do not worry”. (SKS, age 36)
The finding that narratives remain the chief preserve for be like amongst the middle-aged speakers, while in itself based on low overall numbers, tallies well with the line of argumentation I have put forward throughout this article: If speakers in their mid-thirties are increasingly subject to normative pressures, we should not be surprised to find them modulate their speech away from quotative be like (and presumably other stigmatised linguistic forms), especially in more careful and guarded genres (see above; consider also Labov Reference Labov, Baugh and Sherzer1984 and Llamas Reference Llamas, Llamas, Mullany and Stockwell2007).
Contribution of be like to the creation of speaker stance
Finally, I assume a more interactional approach to style. In recent years, variationists have increasingly focused on the way in which linguistic variables contribute to the formation, contestation, and maintenance of stylistic practice. For linguists working within this framework, style can be understood as a process of social differentiation, where indexical devices become embedded into a recognisable, ‘socially meaningful clustering of features’ (Campbell-Kibler, Eckert, Mendoza-Denton, & Moore Reference Campbell-Kibler, Eckert, Mendoza-Denton and Moore2006). Hence, rather than simply reflecting social category membership, speakers actively create or enact personal styles by means of recursive choices amongst a set of variants, dispositions, or repertoire of stances. Style and stance are thus linked via a cyclical process called ‘stance accretion’, whereby habitual and consistent stancetakings give rise to recognizable individual and group styles (Dubois Reference Dubois2002; Rauniomaa Reference Rauniomaa2003). The remaining paragraphs briefly investigate the contribution of quotative be like to the creation of stance, which is defined here as the interactional management of speakers' ‘relationship [with their] interlocutors, and/or [their] position … with respect to wider social groups or societal values or norms’ (Schilling Estes Reference Schilling-Estes, Monroy and Sánchez2008:973; see also Goffman Reference Goffman1981).
Crucially, speakers rely ‘on structured social knowledge—[in particular on] the ideologies and discourses of their community of practice, culture, and society’ to create the social meaning of the stances they take (Kiesling Reference Kiesling2009:179). In the case of be like, research reported here has exposed a complex indexical field encompassing age-dependent constellations of ideologies, including youthful inarticulateness, professional inappropriateness, and adolescent coolness (see also D'Arcy Reference D'Arcy2007; Jamsu Reference Jamsu2008; Carey Reference Carey2013). The following paragraphs explore the ways in which be like’s social and ideological meanings contribute to the projection of a specific interactional stance. I focus on Dave, a nineteen-year-old student of English literature, who exploits the indexical field of be like for the creation of an intellectual persona within the social setting of the sociolinguistic interview. Dave portrays himself, not entirely without irony, as a budding journalist. He is one of the outliers in Figure 5, with a proportional use of be like well below the average of the late teens (8% compared to 65%). Thus, whereas the lion's share of his age mates seem to draw on be like's indexicalities of coolness and friendliness and therefore ‘continue to move along with the rest of the community [since they] have no social incentive to withdraw from [the] change’ (Wagner Reference Wagner2008:208), Dave avoids the feature almost entirely.
Research on nerd communities has revealed the distinctive social meaning created by the resistance to ongoing youth trends. Bucholtz (Reference Bucholtz, Warner, Ahlers, Bilmes, Oliver, Wertheim and Chen1996:123) for example points out that Californian nerd girls ‘distance themselves from the trendiness of cool people [who push forward change and] who are sociologically or at least demographically identically to them’. She argues that, given a sociosphere where certain forms have become stereotyped for a particular sociodemographic group (such as adolescents), resistance to participating in ongoing youth trends does much more than simply avoid the stereotypes. Eckert (Reference Eckert2000) similarly found that the avoidance of iconic features can be meaningful given a contrastive environment (see also Irvine Reference Irvine, Eckert and Rickford2001). Her work in Belten High School revealed that jock girls may eschew the use of certain variants stereotyped as rough or antischool in order to maintain a ‘pure’ image. Thus, dodging ongoing trends provides speakers with an ingenious strategy to harvest the indexical potential of highly stereotyped features. Also Bakht-Rofheart's (Reference Bakht-Rofheart2002) research on the intellectual elite in Long Island suggest that, especially when linguistic resources such as be like have taken on iconic status, the avoidance of these features can index the inverse ideological associations, such as eruditeness, articulateness, and intellectuality. Overall, these findings suggest that Dave creates meaning via the avoidance of be like, especially in contrast with the highly saturated system of his peers. Note that Dave makes generally conservative choices in terms of other ongoing linguistic trends, avoiding innovative intensifiers such as pure and dead (see Barnfield & Buchstaller Reference Barnfield and Buchstaller2010) and other adolescent forms that carry associations of youthful inarticulateness and linguistic hipness.
Third wave sociolinguists have argued that, rather than being ‘socially or linguistically isolated, [a linguistic variable constitutes] … but one element in the constitution of a style’ (Moore & Podesva Reference Moore and Podesva2009:448). Johnstone & Kiesling (Reference Johnstone and Kiesling2008) for example, demonstrate that we cannot simply assume that those individuals who use an iconic feature of Pittsburgh speech (e.g. /aw/ monophthongization) necessarily index a Pittsburgh identity. For this assumption to hold, other variables must conspire with this indexicality. In other words, ‘indexical value accrues not just to individual variables’ (Eckert Reference Eckert2012:97) but to ‘style clusters’ (Moore & Podesva Reference Moore and Podesva2009:365), where different semiotic devices combine to form an interactional style. Let us thus examine the linguistic (and behavioural) practices Dave employs in conjunction with the avoidance of be like in order to create a distinctive intellectual stance.
Throughout his interview, Dave exploits the indexical potential of latinate and learned lexis (such as predicament or respectable individuals in (5); Bucholtz Reference Bucholtz, Warner, Ahlers, Bilmes, Oliver, Wertheim and Chen1996, Reference Bucholtz1999). Also his choice of syntactic structures, notably the use of nominalisations (5a), passives (5b), and attributive adjectives (5c), which are typical of learned and premeditated registers, contributes to his self-construction as an eloquent and erudite speaker (Chafe Reference Chafe and Tannen1982; Biber Reference Biber1988; Halliday Reference Halliday1989).
(5) a. I have no desire to know these people [they] don't interest me
b. if I was ever faced with a predicament like this
c. … I think again he's a respectable individual
Self-stylisation was another resource Dave operationalises for his interactive performance of intellectuality. Throughout the recording, he takes great pains to demonstrate his vast knowledge of cultural affairs, such as music listings, concerts, and cinematography. Johnstone (Reference Johnstone2009:62) has similarly shown the discursive construction of expert ‘epistemic stance’ via performance rooted in personal authority and access to knowledge structures. Moreover, Dave's contributions are delivered in a markedly calm, measured tone with careful diction and a notable dearth of fast speech phenomena such as consonant cluster reduction. Importantly, Buchholtz’ (1996, 1999) group of Californian geek girls who try to project themselves as intellectuals draw on a cluster of very similar resources, including the use of latinate vocabulary, careful enunciation, and the avoidance of hip incoming forms. In conclusion, Dave's low proportion of quotative be like, along with a multitude of other indexical features, participates in the slightly tongue-in-cheek creation of an intellectual, articulate, and cultivated stance.Footnote 18
Dave's interlocutor Steve tries to play along with his ongoing construal of scholarship and professionalism (see Zhang Reference Zhang2005), albeit much less successfully and consistently. Never to be outdone by Dave's self-stylisation, Steve challenges him to several competitive demonstrations of expertise, which allow him to display his own verbal dexterity and knowledge of the world. As example (6) illustrates, these instances of rhetorical one-upmanship are very similar to the verbal tug-of-wars described for nerd communities in Bucholtz (Reference Bucholtz1999).
(6) Dave: has he still got a b- a bunk bed no what are they called what's the thing he-
Steve: a loft bed where you have-
Dave: a loft bed. I didn't call it that
Steve: well that's what they're called
Dave: the ones with the ladder
Steve: a loft bed
Dave: it's not a loft bed it's got another name ….well maybe it's a loft bed but
it's something else as well it'll come back to me it's not worth
debating now. …
Steve: I will walk you to IKEA and they'll tell you it's a loft bed
While space precludes the detailed analysis of Steve's linguistic choices, he draws on very similar linguistic resources to Dave, using latinate lexis and constructions typical of learned registers to portray himself as a mature, respectable persona (“I am a very law-abiding citizen”, “I do have to apologize”). Also like Dave, Steve avoids swearwords (for example, calling Alan Shearer, the former Newcastle United football player, “an awful man”) and he shies away from salient youth forms such as innovative intensifiers and quotatives. With only 5% frequency be like, Steve is the other nineteen-year old outlier in Figure 5.
As the analysis of Steve and Dave has illustrated, some younger speakers shun the robust trend towards quotative be like when indexing stances of intellectuality, nerdness, professionalism, or eruditeness. Interpreting their linguistic behavior as (more or less) deliberate attempts to avoid age-specific behavior and/or escape group stereotypes has allowed me to integrate individual speakers into the generalizations proposed above on the basis of aggregate data. It would be fascinating to discover whether other cases of reported retrograde change (i.e. Singler Reference Singler2004; Tagliamonte & Wagner Reference Tagliamonte and Wagner2014) also encompass younger individuals who avoid be like to project nerdy, intellectual, or professional stances.
LIFE-SPAN CHANGE
While the previous sections explored the occurrence of retrograde change amongst the middle age brackets, the following case study aims to expand the window of analysis on the types of linguistic instability that can occur across the life span of the individual. Previous trend analyses have given rise to the hypothesis that some older speakers go along with the community-wide change towards be like (see Singler's Reference Singler2004 data in Table 4; consider also Buchstaller Reference Buchstaller2006b). This section scrutinizes a small panel sample of six individuals aged sixty-four through seventy-four for evidence of life-span change. The analysis presented here is beleaguered by a common caveat of longitudinal research that tends to be compounded for morphosyntactic and syntactic changes: the reliance on very low Ns (consider the Panel Data workshop at Methods XV; Sankoff Reference Sankoff and Fought2004; Wagner Reference Wagner2012a; Rickford & Price Reference Rickford and Price2013). However, while the results reported here remain speculative, I suggest that they are nevertheless worth reporting since they allow us to follow a panel sample over a time span of forty-two years.
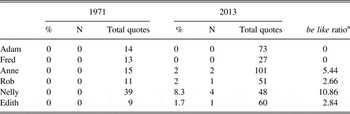
Table 7 reveals that in 1971 none of the participants in the panel sample produce any instance of fully quotative be like as defined by the template in (3), that is, personal pronoun + be + like + ‘quote’. By 2013, by contrast, four of the speakers have picked up the change that sweeps the community around them, using it once (Rob, Edith), twice (Anne), or even four times (Nelly).Footnote 19 Two others, Fred and Adam, have not taken on board the innovative form, which is not particularly surprising given the social indexicality of be like. In the following, I briefly consider why older speakers might or might not embrace a form that is socially stigmatised amongst the postadolescent generations (see Buchstaller Reference Buchstaller2014a).
Panel data on be like use; comparison between 1971 and 2013.

aBe like ratio was calculated as 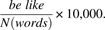 ${be like \over N(words)}\times 10,000.$ A ratio of be like per second (multiplied by 10,000) reveals very similar results: Adam = 0, Fred = 0, Anne = 2.63, Rob = 1.22, Nelly = 5.8, Edith = 1.72.
The sociolinguistic enterprise has produced a body of evidence that socioeconomic and individual speaker characteristics affect the adoption of linguistic forms past critical age:Footnote 20 Changes towards the prescriptive standard tend to be adopted by a disproportionate number of middle-class speakers (Sankoff & Blondeau Reference Sankoff and Blondeau2007; Sankoff & Wagner Reference Sankoff and Wagner2011). By contrast, community-wide changes away from the standard have been mainly observed amongst speakers on the lower end of the socioeconomic spectrum (Yaeger-Dror Reference Yaeger-Dror and Keating1994, Reference Yaeger-Dror, Guy, Feagin, Baugh and Schiffrin1996; Sankoff & Blondeau Reference Sankoff and Blondeau2007:581). While it is disputable whether be like can be conceptualised as change away from the standard, it certainly constitutes a change away from more conventional, and perceptually neutral, forms such as say and unmarked quotes (D'Arcy Reference D'Arcy2007). Indeed, Rob, Anne, and Edith, the three speakers who picked up the nonconventional quotative during their life span (N = 1 and N = 2), remain firmly working class, both by their own assessment and by independent measures. Fred and Adam, by contrast, the two speakers who have not embraced the incoming form by 2013, are social aspirers who have worked their way up from being a welder and a clerk respectively to respectable middle-class careers. Now a teacher (Fred) and a lecturer (Adam), they have ended up in highly language-sensitive occupations, that is, professions in which the use of ‘the legitimised language … is relatively important’, and—as Attitudes toward be like has shown—in which be like is highly unexpected (Sankoff & Laberge Reference Sankoff, Laberge and Sankoff1978:241). In the ethnographic interviews recorded in 2013, both Fred and Adam comment on the linguistic scrutiny under which they found themselves and both demonstrate their acute awareness of linguistic market pressures (Chambers Reference Chambers2003).Footnote 21 This explanation is fully in line with Sankoff & Blondeau's (Reference Sankoff and Blondeau2007) finding that speakers on their way up the socioeconomic ladder tend not to participate much in incoming vernacular trends (consider also Sankoff's Reference Sankoff and Fought2004 study of Nicholas, another working class boy who became a lecturer and who became less vernacular during his life).
Finally, Nelly the most prolific user of quotative be like, (N = 4) is firmly middle class by a number of independent measures, including housing, attitudes, and aspirations. Crucially, however, Nelly has spent her life surrounded by children and young people of various ages. In her youth, she trained as a nursery nurse and worked in kindergardens and preparatory schools until, at the age of twenty-eight, she gave up work to rear her own children. She also helped raise her three grandchildren, now aged sixteen, fifteen, and nine, to whom she is very close. Possibly due to her intimate contact with younger people, Nelly displays a very positive opinion towards innovation and change more generally. At seventy-one years of age, she is the only woman in the panel study who reports using a mobile phone. She even programs numbers into her husband's phone because she is more ‘technical’. Nelly also uses the internet and she sometimes communicates via email. Thus, while we might expect Nelly to be linguistically more conservative due to her social background (including her caretaker role and the normative pressures of the school system), her general openness towards innovations and her constant interaction with younger speakers might have predisposed her towards the adoption of innovations, including incoming linguistic forms.Footnote 22
Thus, apart from the two individuals who experienced considerable social ascent and ended up in linguistically sensitive professions, the panel study speakers seem to engage with the quotative newcomer to some degree. Bearing in mind the low numbers on which this study is based, Nelly, Rob, Edith, and Anne's behaviour might be interpreted as ‘life-span change’, since they pick up on a change in progress that is gaining momentum in the community around them (Sankoff Reference Sankoff, Ammon, Dittmar, Mattheier and Trudgill2005). Furthermore, the results of this panel study suggest that speakers' propensity to engage with ongoing changes is affected by both personal (contact to children, attitudes towards changes) and life-course factors, such as their social trajectory (see Sankoff Reference Sankoff2013a,Reference Sankoff, Bayley, Cameron and Lucasb). And while these findings need to be treated with some caution due to the rarity of quotation amongst the population investigated, life-span change has important implications for sociolinguistic theorising: if older speakers participate in community-wide trends, sociolinguistic models of language change that assume stability across the life-span consistently underestimate the rate of change.
DISCUSSION AND QUESTIONS FOR FUTURE RESEARCH
This article set out to explore the relationship between the speech of the individual and ongoing community-wide change in the quotative system. Employing a combination of trend and panel research, and appealing to the social and ideological load of innovative be like, the article examined the adjustments speakers make in their quotative system as the change sweeps through the community around them.
Research on the social psychological reality of be like brought to light a complex and age-specific indexical field. I argued that these ideologies, compounded by the fact that the variant has reached stereotype stage (Labov Reference Labov1972b), might motivate postadolescent speakers to avoid the newcomer form that has reached dazzling heights amongst the youngest age groups. Indeed, a trend analysis based on two successive apparent time data-sets reveals that speakers in the middle age bands do not participate in the progressive proliferation of be like. Rather, if we rely on the notion of temporal surrogacy customary in variationist sociolinguistics, the data can be interpreted as evidence that speakers ages thirty to thirty-four reduce their be like ratios in the four years that lie between the collection of the two data-sets. Moreover, the use of be like seems to be highly sensitive to a range of cognitive and textual factors grouped here under the umbrella term ‘style’, which sociolinguists tend to operationalise as testing grounds for intraspeaker instability as a consequence of normative pressures. On the basis of these subtle stylistic shifts and given the socioindexical field within which be like operates, I have interpreted the mid-thirties' retreat towards more conventional variants, which is robust when broken down to the individual speaker, as a form of age-grading. More specifically, this type of avoidance phenomenon, where individuals change their linguistic behaviour against the direction of ongoing community-wide change, has been termed ‘retrograde change’ by Sankoff & Wagner (Reference Sankoff and Wagner2006).
Notably, the middle-aged Tyneside speakers are not alone in displaying recessive be like frequencies; research from Philadelphia and New York City (Singler Reference Singler2004; Tagliamonte & Wagner Reference Tagliamonte and Wagner2014) similarly reports that the vigorous change in the quotative system recedes in the middle age brackets. The finding that speakers across disparate communities mark ‘the transition to middle adulthood with more conservative [quotative choices] than they had previously employed as adolescents and young adults’ (Wagner Reference Wagner2012a:379) might be an indication that the retreat in the middle age brackets is part of a general retrograde trend. While more research is needed to test this hypothesis, it would be rather exciting if a generation of speakers turns their back on a robust trend that is currently underway in varieties of English around the globe. I revisit this issue below.
A small, exploratory panel sample expanded the window of analysis to include older speakers who were clearly beyond critical age when be like arrived in the UK quotative system in the 1970s and 1980s. While low token numbers call for great caution in interpreting these results, the panel data seem to suggest that some individuals go along with the community-wide change towards be like to a certain degree across the forty-two years that lie between the two recordings. This finding, which is preliminary at the moment, adds to the growing number of panel studies that report postcritical age speakers picking up on changes in community norms (Thibault & Daveluy Reference Thibault and Daveluy1989; Yaeger-Dror Reference Yaeger-Dror and Keating1994, Reference Yaeger-Dror, Guy, Feagin, Baugh and Schiffrin1996; Wagner Reference Wagner2012b). It also agrees with Bowie & Yaeger-Dror's (Reference Bowie, Yaeger-Dror, Honeybone and Salmons2015) contention that a speaker's individual life history and personality profile are ‘more influential than would be possible if the critical period were operant’ (see also Sankoff Reference Sankoff, Ammon, Dittmar, Mattheier and Trudgill2005).
Overall, the ongoing change in the quotative system in the Tyneside community seems to entail two cases of instability across the life span of the individual: retrograde change and—with reservations—also life-span change. A conception of the change in progress in the quotative system as monotonous would therefore both under and overestimate the rate of change in the quotative system.
The following paragraphs address a number of questions for future research.
How do we conceptualise the adjustments across the life span of the individual during ongoing language change?
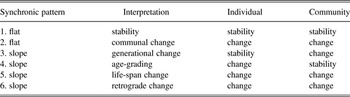
Until quite recently, and in the wake of Labov's (Reference Labov1994) highly influential principles of language change, instability across the speaker's life span was widely interpreted as diagnostic of two divergent scenarios (see Table 8): ‘age-grading, with individual variation through time but no resultant linguistic change within the community [scenario 4], was … contrasted with linguistic change, where … speakers (generally) continue to advance the change until it eventually is completed and everyone uses the newer form, [scenario 3]’ (Bowie & Yaeger-Dror Reference Bowie, Yaeger-Dror, Honeybone and Salmons2015).Footnote 23
Patterns of change in the individual and the community (after Sankoff & Blondeau Reference Sankoff and Blondeau2007:562).

Sankoff's (Reference Sankoff, Ammon, Dittmar, Mattheier and Trudgill2005:1011) widely cited discussion of ‘life-span change’ and Sankoff & Wagner's (Reference Sankoff and Wagner2006:203) analysis of the Montreal future as ‘retrograde change’ have added two cases of speaker instability to the mechanisms of language change (scenarios 5 and 6). This means that sociolinguists are now faced with four scenarios that exhibit monotonic slopes in apparent time: generational change, life-span change, retrograde change, and age-grading.
Following the apparent time hypothesis (Labov Reference Labov1966), generational change is defined as cases where individuals ‘retain their childhood patterns’ during ongoing community-wide change and do not substantially alter their linguistic habits during their life (Sankoff & Blondeau Reference Sankoff and Blondeau2007:562). The other three scenarios, by contrast, are characterized by intraspeaker instability during community-wide stability (age-grading), towards ongoing change (life-span change), or against it (retrograde change). Sociolinguistic research relies on two main parameters to differentiate between age-grading on the one hand and retrograde change/life-span change on the other: (i) the (non)cyclicity of speakers' instability across their life span, and (ii) community (in)stability. In the following I briefly comment on both in turn.
Age-grading has been defined as a cyclical pattern, whereby ‘changes in the use of a variant … recur at a particular age in successive generations’ (Chambers Reference Chambers2003:206, emphasis mine). In contrast, life-span/retrograde changes are considered to be one-off historical adjustments that occur at a certain point during the speaker's life history. This supposed dichotomy has led Wagner (Reference Wagner2012a) to enquire how many times an age-associated change needs to occur for it to be considered cyclical and thereby age-graded. Since we do not know yet whether the avoidance of be like in the middle age brackets that has come to light in the Tyneside data might end up being cyclic (see Cheshire Reference Cheshire, Ammon, Dittmar, Mattheier and Trudgill2005), it cannot yet be categorised as age-grading. Singler (Reference Singler2004) refers to the retrograde change as ‘incipient age-grading’ and I have done the same in this article. The older speakers' increase of be like use in the direction of the community-wide trend, however, is supported by data from the 1990s (Buchstaller Reference Buchstaller2006b) and the early 2000s (Singler Reference Singler2004), which suggests that this pattern is at least recurrent. If future generations of older speakers go along with the ongoing change in progress, we might subsume the phenomenon under the category age-grading.
The second parameter that is commonly used to distinguish between different types of intraspeaker instability is whether or not a community is stable across time. Life-span and retrograde change are characterized by a pattern whereby both the speakers and the community are unstable across time. The original definition of age-grading, by contrast, stipulates stability across the community (see Labov Reference Labov1972a, Reference Labov1994; Downes Reference Downes1998). Recently, however, researchers have interpreted regular slopes with speaker age as age-grading, irrespective of whether or not the community is stable. Wagner (Reference Wagner2012a:379, emphasis mine), for example, posits that ‘conservative linguistic behaviour with increasing age [i.e. age-grading] can also be observed for generational “change from above”. If this is the case, an individual speaker's conservative speech is in opposition to the tide of a community change, and the older feature that they favour is above the level of community awareness’ (see also Sankoff Reference Sankoff, Ammon, Dittmar, Mattheier and Trudgill2005). This seems to be the case with the Montreal future as well as with be like, where speakers revert back to conservative forms, rejecting nearly completed changes (consider also /aeh/ in Labov et al. Reference Labov, Rosenfelder and Fruehwald2013). Especially as a change nears saturation in the community—as is the case for be like and the Montreal periphrastic future—that is, as it nears stability, it becomes increasingly hard to distinguish classical age-grading from life-span change on the basis of community behaviour (Suzanne Evans Wagner, p.c.).
Relaxing the criteria of cyclicity and community stability allows us to consolidate the totality of postadolescent instability across the life span into one heuristic category—irrespective of whether the target is still or moving and irrespective of whether these choices are repeated in generations before or after. Such an approach would capture speakers modulating away from community-wide change in the middle age brackets (retrograde change), individuals catching up with changes in later life (life-span change) as well as the two types of intraspeaker variability commonly included in the classical definition of age-grading: the correction away from stable nonstandard forms in the middle age brackets and the (much less understood) reversal towards vernacular forms after retirement that has been reported from some communities (for the notion of a ‘tail’ see especially Downes Reference Downes1998; Chambers & Trudgill Reference Chambers and Trudgill1998).
The following section provides further evidence for the usefulness of a coherent theory of linguistic instability.
Why does the dip in variant production occur so late?
Whereas chronological age is historical, the life course of the individual is punctuated by age and community-specific life stages, only some of which are well understood. For the most part, sociolinguistic research has been operating with the three-part model proposed by Chambers (Reference Chambers2003:171): ‘First in childhood, the vernacular develops under the influence of family and friends … Second, in adolescence, vernacular norms tend to accelerate beyond the norms established by the previous generation ….Third, in young adulthood, standardization tends to increase’ as speakers are increasingly affected by normative pressures.Footnote 24 Until quite recently, the age ranges during which this corrective adjustment to legitimized norms is supposed to occur have not been subject to much investigation. The literature tends to refer rather vaguely to ‘postadolescent’ (Wagner Reference Wagner2012a), or ‘middle years’ (Eckert Reference Eckert, Kotsinas, Stenstrom and Karlsson1997:158) which, as Eckert rightly argues, have not attracted much scrutiny in the sociolinguistic literature (nor in sociology or developmental psychology; see Wahl & Kruse Reference Wahl, Kruse, Willis and Martin2005).
Recent panel studies, however, suggest that our linguistic habits change as a result of many different age-relevant junctures across our life course: van Hofwegen & Wolfram (Reference van Hofwegen and Wolfram2010) and van Hofwegen (Reference van Hofwegen, Lanehart, Green and Bloomquist2015), for example, demonstrate that vernacularity declines at the early onset of schooling and peaks between sixth and eighth grade (ages eleven to fourteen) before receding back to higher standardness. Moore (Reference Moore2004) shows that girls' speech habits change between school years eight and ten (ages ten to twelve), as they start to engage in the new, socially meaningful networks in the heterosexual marketplace. Bigham (Reference Bigham2010), Prichard & Tamminga (Reference Prichard and Tamminga2012), and Wagner (Reference Wagner2012b) demonstrate that the transition from high school to college is an important watershed for a speaker's adherence to or avoidance of local linguistic forms. Sankoff's (Reference Sankoff and Fought2004) study of ‘Nicholas’ reveals an increase in standard forms by age twenty-eight, when he had emigrated to the US to take up a position at a university. These findings suggest that language use across the life span can be sensitive to a range of different, and often highly individual, life phases (Bowie & Yaeger-Dror Reference Bowie, Yaeger-Dror, Honeybone and Salmons2015; see also Wagner Reference Wagner2012a).
Which linguistically relevant juncture can we adduce for the drop in variant production amongst speakers in their mid-thirties? Eckert (Reference Eckert and Coulmas1996, Reference Eckert2000) has famously argued that adolescence is a relatively recent cultural achievement that has delayed the onset of adulthood by almost a decade. The late coming of age in western industrialised societies means that the thirties age bracket hosts a number of life experiences that contribute to the ‘emergence of age-relevant linguistic identities’ (Bowie and Yaeger-Dror Reference Bowie, Yaeger-Dror, Honeybone and Salmons2015). The average age of women in the UK at childbirth, for example, is now 29.8 years, a continuous increase since the 1970s (Office for National Statistics 2012). And while statistics are difficult to come by, the increasing numbers of years spent in education, often prolonged by periods of job searches, changes in career path, traineeships, and internships (see Barnfield & Buchstaller Reference Barnfield and Buchstaller2010) mean that other typical markers of adulthood (such as promotions, mentoring or leadership roles; see Chambers Reference Chambers2003) also tend to occur later in the life history of the individual. A recent article in the Business Insider called the years between thirty and forty-nine the ‘career-rising years’ (Guimãres Reference Guimãres2014). Labov (Reference Labov2001a:101) similarly sets the linguistically relevant period of ‘full engagement in the work force and family responsibilities [at] 30–59’ years.Footnote 25 Consequently, the ‘pressures to conform to societal norms’ (Cheshire Reference Cheshire, Ammon, Dittmar, Mattheier and Trudgill2005:1556) typical of adulthood might not exert their most profound impact in the Tyneside community until speakers ‘transition into … [or indeed establish themselves in] the adult job-related linguistic market’ (Bowie & Yaeger-Dror Reference Bowie, Yaeger-Dror, Honeybone and Salmons2015), that is, as they reach their (mid-)thirties (see also Helson & Soto Reference Helson and Soto2005; van Aken, Denissen, Branje, Dubas, & Gossens Reference van Aken, Denissen, Branje, Dubas and Gossens2006). Research on the 7 up series (Apted Reference Apted and Singer1999) supports this contention: Rhodes's (Reference Rhodes2011) results suggest that the greatest change in the vowel system of ‘Bruce’ occurred in his mid-thirties, as he settled into his professional career.
A comprehensive conceptualization of linguistic malleability across the life span is heuristically advantageous since it allows us to understand intraspeaker variability as (more or less conscious) reactions to the life-stage specific demands regarding demeanor and language use that we encounter as we progress through our life histories. While some of these constraints are ontogenetically relatively stable (such as the onset of schooling) and therefore have the potential to result in regular cyclical intraspeaker variability, others are less straightforward to pin down and more individualistic in nature (such as career trajectories and family planning). More research is needed for a better understanding of the linguistic relevance of distinct micro-life stages, including educational and maturational watersheds such as starting and changing school, going to college or beginning apprenticeships, graduation and first jobs, parenthood or promotions within the job hierarchy, midlife crisis, retirement, and old age (Eckert Reference Eckert, Kotsinas, Stenstrom and Karlsson1997; Wagner Reference Wagner2012a; Bowie & Yaeger-Dror Reference Bowie, Yaeger-Dror, Honeybone and Salmons2015). Ongoing work by Gregersen and his collaborators (Gregersen Reference Gregersen2009; Gregersen, Maegaard, & Pharao Reference Gregersen, Maegaard and Pharao2009; Gregersen & Barner-Rasmussen Reference Gregersen and Barner-Rasmussen2011), Wagner's (Reference Wagner2008, Reference Wagner2012a,Reference Wagnerb) continuing research with a group of recent high school graduates and Tagliamonte's analysis of ‘Clara’ (Wagner & Tagliamonte Reference Wagner, Tagliamonte, Wagner and Buchstaller2016) hold great potential for our understanding of which types of life stages can have measurable consequences in linguistic behaviour. Rickford & Price (Reference Rickford and Price2013), Cukor-Avila & Bailey (Reference Cukor-Avila, Bailey, Wagner and Buchstaller2016) as well as the results reported here remind us of the importance of stylistic factors as individuals maneuver age-specific and interactionally relevant speaker identities.
Is the pattern stable across time?
The change in the quotative system is progressing in an indexical field that is sharply divided by age. Given that be like seems to be particularly sensitive to mid-career pressures in the Tyneside community, we will have to await the results from future data-sets to answer the question whether the retreat will occur earlier in speakers' life spans (recall the institutional language policies that aim to stamp out the form). This is a pertinent question, especially given that the drop in Tagliamonte & Wagner's data (Reference Tagliamonte and Wagner2014) occurs between sixteen and twenty-four years of age.
Sankoff & Blondeau (Reference Sankoff and Blondeau2007) point out that we need to rethink the role of late adopting (or receding) adults in ongoing changes, especially their potential influence on children and thus the future trajectory of the change (see also Smith, Durham, & Fortune Reference Smith, Durham and Fortune2007). While the stylistic implications of child-care responsibilities on be like use have not been investigated (yet), postadolescent speaker instability during community-wide change can have important repercussions for the course of ongoing language change: if the generation of caregivers and educators continues to move away from a highly stereotyped change, we might see the adjustive drop in frequency move down in age. Indeed, Labov and colleagues' (Reference Labov, Rosenfelder and Fruehwald2013) research on /aw/ tensing in Philadelphia suggests that the reversal is exacerbated by the fact that it is led by women and by over forty-year-old college-educated speakers, who then pass on more conservative forms to their children. Note, however, that even if adults with child rearing responsibilities reduce their high be like frequencies, this does not necessarily imply that the change stops or even reverts. The system would simply take longer to saturate. What is more, forms such as /aw/ tensing or be like might merely show a more radical stylistic retreat into informal and unmonitored genres.
Hasty & Childs (Reference Hasty and Childs2013), however, demonstrate that as a variant's indexicalities shift and ideological weightiness decreases, forms can pick up dramatically across time, with younger generations taking up previously stigmatised forms (see also Trudgill Reference Trudgill1988). As the younger generations of heavy be like users make their way into the establishment, they might refuse to buckle to prescriptive pressures and maintain their positive attitudes towards—as well as high frequencies of—the variant. If this was the case, the drop in be like production would dwindle and the change would become ‘both straightforward and inexorable’ (Singler Reference Singler2004). Tagliamonte and her collaborators' findings (Gardner et al. Reference Gardner, Denis, Brook and Tagliamonte2013) suggest that this is indeed the case in some communities.