INTRODUCTION
Much of China's Gansu province lies in a geographic region known as the Loess Plateau, where millennia of deposition from the Yellow River have resulted in spectacular loessial deposits, several hundred metres thick in places (Sun et al. Reference Sun, Zhou and An2001). The imbalance between population density and land availability typically results in agricultural systems characterized by heavy grazing pressure and low vegetation cover. In such a system, as is common in many regions of the world where privately owned animals are grazed on communal land (Reynolds Reference Reynolds, Suttie, Reynolds and Batello2005), income per family is low and the landscape is exposed to risks of degradation by wind and water erosion. Issues pertaining to both economic and physical sustainability are of concern.
One problem for researchers in seeking to design and introduce more sustainable or more profitable farming systems is an almost complete lack of data on the herbage yields and carrying capacities of existing systems, or on the dynamics of system components such as the relationship between stocking rate (SR), grazing behaviour and vegetation cover. Clearly, such data are relevant to the formulation of strategies for erosion control and landscape enhancement.
For a first approach to the collection of data on grazing systems, it is common to begin by characterizing the vegetation in terms of species present and annual herbage accumulation (see e.g. Radcliffe Reference Radcliffe1974). It is reasoned that the characterization of animal production and behaviour at a range of SR would provide a more powerful basis for understanding the dynamics of present production systems in this environment. In New Zealand, farm systems research has been ongoing for decades and is now largely carried on by private consultants through modelling software such as Stockpol (Marshall et al. Reference Marshall, Mccall and Johns1991). There it is well recognized that, given the logistical difficulty of direct measurement of herbage intake and associated errors, it is often more feasible in systems optimization research to infer the herbage intake of animals in the grazing system by reverse calculation from data on animal numbers, body weight (BW) and growth rates. The second aim of the current research was to provide a formal study of the grazing behaviour of local Tan sheep and the behavioural response to increased SR.
The aim of the experiment reported, therefore, was to provide quantitative information on the way system outputs and animal grazing behaviour respond to SR in a grazing system representative of those on the Loess Plateau of Northwest China.
MATERIALS AND METHODS
Study site
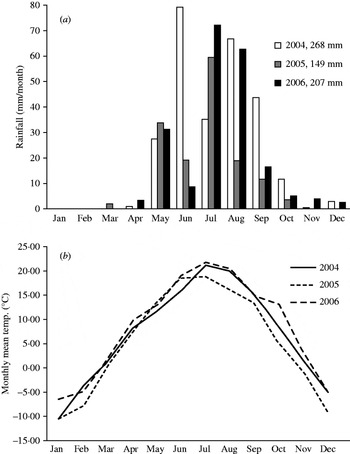
The research was conducted in 2004, 2005 and 2006 in Huanxian County, Gansu Province (37·1°N, 106·8°E), China. This region has a typical continental monsoon climate and it is 1650 m asl. The mean annual precipitation is 359 mm, with more than 0·6 occurring from late-June to mid-September and the mean annual evaporation is 1993 mm. The mean annual temperature is 7·1°C, with a period of several months sub-zero winter temperature and summer temperatures typically above 30°C. The annual accumulated temperature above 10°C is 3097°C days (s.d.=213·6), the annual sunshine duration is 2777 h (s.d.=219·1) and the frost-free period is 125 days (s.d.=14·2). Figure 1 shows temperature and rainfall during the 3-year study period. The soil at the study site was classified as loessial (Cooperative Research Group on Chinese Soil Taxonomy 2001) and this rangeland is a ‘typical temperate steppe’, according to the ‘comprehensive and sequential classification system of grassland’ (Ren et al. Reference Ren, Hu, Zhao, Zhang, Hou, Lin and Mu2008). The dominant species of the rangeland include Stipa bungeana, shrubby lespedeza (Lespedeza bicolor), wormwood (Artemisia capillaris), flaccidgrass (Pennisetum flaccidum) and green bristle grass (Setaria viridis). The growing period begins in late-March and ends in mid-September.
Temperature and rainfall during the 3-year study period.

Experiment design
The simulated farming system involved the purchase of 18-month-old lambs of c. 20 kg BW in early summer and carrying these lambs for c. 6 months before selling, with an increase of 10–15 kg BW in that time. In these systems, a given area of land is grazed for only a few months per year and rested from grazing for the remainder of the year. Two separate land areas of just under 6 ha each were used for WS and CS grazing, sheep utilized the warm season (WS) grazing area for 90 days from early June to early September each year and the cold season (CS) area for 48 days from late-October to mid-December. Both WS and CS land areas were divided into 12 small paddocks; three spatial replicates for each of the four SR treatments allocated 0 (ungrazed), 4, 8 and 13 sheep, respectively. Paddocks designated for grazing averaged 0·5 ha in area, while ungrazed paddocks were marginally smaller. This then gave SRs on the grazed treatments of 2·7, 5·3 and 8·7 sheep/ha, SR in this context being defined as the number of animals allocated to a treatment divided by the combined area of 1·5 ha for the three replicates of each treatment in either season. A rotational stocking system (The Forage and Grazing Terminology Committee 1991) was used, and once allocated to a treatment, the same sheep grazed successive replicates rotationally (WS: 10 days/paddock replicate, three grazing rotations; CS: 8 days/paddock replicate, two grazing rotations). Separate metabolizable energy (ME) yield calculations were performed for the WS and CS grazing blocks, and for about 6 weeks from early September to late October animals were free-grazed elsewhere on the experimental station.
Tan sheep
Tan sheep (Ovis aries) are a native sheep breed, well adapted to the comparatively extreme climate conditions on the Loess Plateau and the predominant livestock type of the region. All sheep used in the current study had similar body condition and BW (P>0·10) at the start of the experimental period each year. Animals were left in the paddocks from 09·00 to 19·00 h each day in the WS and from 10·00 to 17·00 h in the CS. Outside these times, animals were penned in a nearby overnight shelter. At the time of the current research, ethics approval was needed for laboratory experiments but there was no formal procedure for ethics approval of field experiments in China involving animals. However, every effort was made to treat animals as well as or better than in local farms. Animal welfare provisions for experimental animals included the administration of anthelmintics and the supply of drinking water and artificial shade for the sheep to rest from summer heat.
Grazing behaviour
In the WS, in each of the three replicate paddocks of the second grazing rotation, grazing behaviour observations were made on days 2, 4, 6 and 9 of each paddock-grazing event in 2004 and on days 2, 5 and 7 in 2005 and 2006. CS observations of grazing behaviour were also made during the second grazing rotation, on days 2, 4 and 7 of each paddock-grazing event. Behavioural measurements were never made on the first grazing day following a paddock change.
Six sheep of each SR treatment (or all four sheep in the case of the 2·7 sheep/ha SR) were randomly selected at the start of each year and the selected sheep monitored for the rest of that year. Because sheep were accustomed to intensive shepherding, it was possible for human observers to record data without disrupting animal behaviour. On each observation day, foot and jaw movements of the selected sheep were counted for a 5 min time span within each of six (WS) or four (CS) observation periods during that day: 09·00–11·00, 11·00–12·30, 12·30–14·00, 14·00–15·30, 15·30–17·00 and 17·00–19·00 h for WS and 10·00–12·00, 12·00–13·30, 13·30–15·00 and 15·00–17·00 h for CS. The number of steps or bites, respectively, in each 5 min time span were counted using a hand-held counter and divided by the ingestion time, recorded with a stopwatch, to give stepping rate (SM, steps/min/sheep) and biting rate (BM, bites/min/sheep). Ingestion time was defined as the time during which the animal was biting herbage or moving its muzzle close to the herbage. Independent of these observations, foraging and resting times of animals were also recorded on observation days, so that total steps/animal/day (SD) and bites/animal/day (BD) could be estimated as the product of SM or BM, respectively, and foraging time. The methodology adopted assumes that 5 min counting periods for selected sheep were representative of the entire observation period.
Independent of observation of grazing behaviour, hoof prints left after grazing in 10 fixed quadrats (0·5×0·5 m), uniformly arranged in each of the paddocks along one diagonal, were counted to provide further information on animal foraging activity.
Estimation of ME intake (MEI)
A widely used methodology to assess the animal energy intake for purposes of reverse calculation of intake or herbage harvested is to view the (non-pregnant) animal as having two metabolic compartments: body maintenance (a 0·75 power function of BW) and BW gain (Nicol & Brookes Reference Nicol, Brookes, Rattray, Brookes and Nicol2007). Under this model, animal energy intake/day is estimated by

where k 1 is a metabolic constant, k 2 is a constant denoting MJ ME required per kg live weight gain (LWG) and ADG is the average daily BW gain. It was assumed that the value of k 1 was 0·4 for the July–September calculations and 0·6 in the November–December period when temperatures fell below zero. It was assumed that the value of k 2 for sheep of this size was 30 MJ/kg BW gain. The values chosen for k 1 and k 2 were based on work by Koong et al. (Reference Koong, Ferrell and Nienaber1985) and Degen & Young (Reference Degen and Young2002). Koong et al. (Reference Koong, Ferrell and Nienaber1985) reported that k 1 for growing lambs ranged from 30 g dry matter (DM)/(kg0·75) at a low plane of nutrition to 55 g DM/(kg0·75) at a high plane of nutrition. Although the ME value of DM was not stated, at 11 MJ ME/kg DM, this would equate to values for k 1 of 0·35–0·60, respectively. It was felt that for Tan sheep on a low plane of nutrition, a value for k 1 at the lower end of the reported range should be assumed. Degen & Young (Reference Degen and Young2002) reported that body maintenance energy requirements of sheep increased from 0·420 MJ/day at 20°C to 0·71 MJ/day at 0°C, while air temperatures during the CS grazing period were around 10°C at the commencement of CS grazing, and sub-zero by the end of the experiment. Animals were weighed regularly (c. every 7–10 days), MEI was calculated according to eqn (1) for each individual animal, and summed across animals for the duration of WS and CS grazing periods on the respective grazing areas and SR treatments to estimate the total MEI of each individual animal in both WS and CS grazing periods. Equation (1) is useful in another way, in that the expression k 2 LWG defines the production or output of the system, and its ratio with body maintenance energy or total MEI is an important contributor to conversion efficiency of feed eaten.
Herbage mass and vegetation cover
Although monitoring of herbage mass was not the primary aim of the current work, some herbage mass and botanical composition data were collected to provide a contextual background for the animal behaviour data. The above-ground herbage mass (comprising green biomass, standing dead material and litter on the soil surface) was determined approximately twice each month during the grazing season by clipping plants at the ground level from 1 m2 quadrats with four quadrats per plot. Samples were oven-dried at 80°C for 48 h.
The vegetation or canopy cover was determined by point sampling (Ren Reference Ren and Ren1998) during the pre-grazing and post-grazing period, and expressed as the proportion of total needle hits intercepted by vegetation before a needle touched the ground. Changes in vegetation cover during a grazing period were presumed to reflect herbage removal by the grazing animals and it was of interest to define how herbage removal and animal grazing behaviour interact as SR increases.
Statistical analysis
Modelled energy requirements of animals (GJ ME/animal for WS or CS grazing periods) were statistically tested by multiple linear regression in Minitab Version 10.51 (Minitab Inc., State College, Pennsylvania). The regression model for energy requirement used final BW of animals, and linear and quadratic effects of SR and year as independent (predictor) variables. Data on vegetation cover, hoof-print counts (prints/m2), grazing time (h/day) and herbage mass (kg green DM/ha) were analysed using a similar regression model in Minitab 10.51, extracting linear and quadratic effects of year and SR.
The structure of the animal behaviour data collection regime resulted in 3659 observations for each of the measured variables, and the data set had five dimensions: SR, year, day within grazing event, time of day and spatial replicate. As such, formulating an appropriate statistical analysis was a challenge. For the animal behaviour data, it was considered that spatial replicates used in statistical analysis of herbage mass data should preferably not be treated as independent observations when the same group of animals had grazed successive paddock replicates, even though the use of the spatial replicates addressed the theoretical possibility of apparent SR effects arising from spatially specific behaviour of animals. To model this system statistically, data on grazing behaviour variables BM, BD, SM and SD were analysed using SAS Proc GLM (SAS Institute, 1989), with time of day (T), number of days within the present paddock (D), year and SR all entered into the model as continuous, independent variables and linear and quadratic components of variance in behaviour data associated with those independent variables extracted in each case. Sums of squares were also extracted for linear components of all the two-way interactions between the four effects, but not for the quadratic component of interactions. In order to keep the focus of the present report on the effects of change in SR, interaction means involving the other factors, though extracted in the analysis of variance (ANOVA) Table, are not reported but can be provided by the authors on request.
In order to explore the relationship between measures of vegetation cover on the one hand and animal foraging activity on the other hand, a small data matrix was compiled comprising relevant WS observations (columns) on the 12 paddocks (rows), with each year's data treated as independent observations, and a canonical correlation performed using the SAS (SAS Institute Inc., Cary, NC) procedure ‘Cancorr’ as outlined by Matthew et al. (Reference Matthew, Lawoko, Korte and Smith1995). More precisely, data for vegetation cover before and after grazing and cover decrease during grazing comprised one group of variables, analysed for relationship with a second group: hoof print count, BD and SD.
RESULTS
SR effect on ME harvested
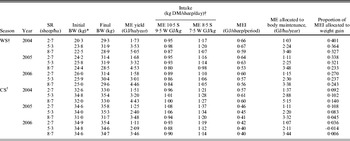
ME yield of WS grazed plots (rested from grazing in the CS), summed across all grazing events for the year, averaged 1·7, 3·3 and 4·7 GJ/year, at SR of 2·7, 5·3 and 8·7 sheep/ha. Corresponding values for CS-grazed plots (rested from grazing in the WS) were 0·9, 1·9 and 2·7 GJ/year for the three SR (Table 1).
Total annual harvested ME (GJ/ha/year) on summer (WS) and autumn–early winter (CS) grazing land and GJ/sheep (WS and CS grazing areas), estimated daily herbage intake (kg DM/sheep/day at 10·5 or 8·5 MJ ME/kg DM in the WS and at 9·5 or 7·5 MJ ME/kg DM in the CS), ME allocated to body maintenance (GJ/ha/year) and proportion of MEI allocated to BW gain. Data are for a grazing system rearing Tan sheep on the Loess Plateau of northwest China

* Dates were: WS 2004 15 June–23 September, WS 2005 20 June–8 September, WS 2006 6 June–13 September, CS 2004 13 October–5 December, CS 2005 15 October–29 November, CS 2006 5 November–22 December.
† Statistical tests were carried out for BW gain per sheep and for MEI per sheep (GJ per 90-day period), as described in Materials and Methods section. The SR effect on BW gain per sheep was not significant for the WS or the CS, though the decline in weight gain across years was significant in the WS (P<0·001, coefficient –1·36 kg/sheep/year. The SR effect on MEI per sheep was not significant for either WS or CS experiments. However, the decline over years was significant; WS: coefficient –222 MJ/sheep per year, P=0·032 for the linear effect, coefficient +19·3, P=0·061 for the quadratic effect; CS: coefficient –721 MJ/sheep per year, P<0·001 for the linear effect, coefficient +61·8, P<0·001 for the quadratic effect).
For an assumed herbage ME of 8·5 MJ/kg DM, the estimated herbage intake of the sheep in the WS ranged from c. 1·0 to 1·2 kg DM/sheep/day. If herbage ME of 10·5 MJ/kg DM was assumed, the estimated intake was 0·8–1·0 kg DM/sheep/day. With lower assumed herbage ME in the CS, increased animal BW (due to the animals being 4 months older), and increased value assumed for k 2 at low temperature, the estimated herbage intake requirements ranged from c. 0·9–1·1 kg DM/sheep/day at a herbage ME of 9·5 MJ/kg DM to 1·1–1·3 kg DM/sheep/day at a herbage ME of 7·5 MJ/kg DM. A notable feature of the results is the comparatively ‘flat’ response of per animal intake to change in SR, with more variation between years than across SRs, whether measured on a daily average basis or summed over a seasonal grazing period (Table 1). Statistical tests were only carried out for intake per sheep per day and weight gain (kg BW/sheep) over the duration of the WS and CS experiments, as other measures in Table 1 were either confounded by SR or related by derivation.
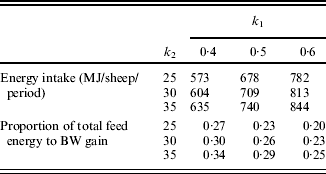
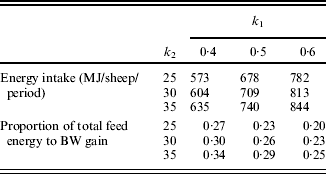
Clearly, it is of interest in a modelling evaluation of a grazing system to know the sensitivity of the results to model assumptions. Three key assumptions in calculations are values for k 1 and k 2 (eqn 1) and for ME value of herbage. The determination of the average daily intake based on herbage quality values of either 8·5 or 10·5 MJ ME/kg DM, described above, addresses the latter point. On evaluating a range of plausible values for k 1 and k 2 (Table 2), the most extreme values generated were around 30% higher or lower than values in Table 1.
Sensitivity of calculated intake values to change in metabolic constants. Test is for WS results averaged across SR. k1 denotes multiplier to obtain body maintenance energy (MJ/day) from metabolic BW. k2 denotes MJ feed intake required per kg animal BW gain (for further details, see eqn (1) in the text)
SR effects on animal foraging activity
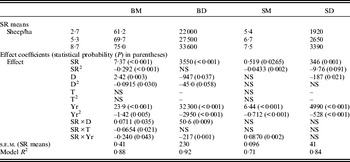
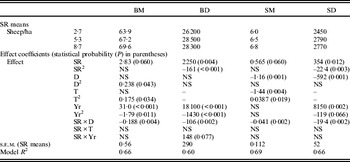
When animal behaviour traits BM, BD, SM and SD measured in the WS were modelled with predictors SR, T, D and year, R 2 values ranged from 0·71 to 0·92 and the linear coefficient for SR was positive and highly significant in all cases, indicating an increased foraging activity at higher SR, while the quadratic coefficient was negative and also significant for BM and SM (Table 3). Negative quadratic coefficients for BM and SM indicate diminishing responses at higher SR. Year effects (sometimes interacting with SR) were always significant though, as will be discussed below, difficult to interpret. The effects of T and D on animal foraging behaviour were small compared to the effects of SR. There was an indication of a general trend for BM to increase and for BD and SD to decrease the longer animals remained on a given paddock, as measured by D (Table 3). Inspection of means (not presented) indicated the SR×D interactions for BM and BD (Table 3) related to comparatively high BM and BD mean values at high SR towards the end of a paddock grazing event, while the SR×T interaction for WS data was associated with a greater rise in BM from morning to afternoon at lower SR than at higher SR.
SR means and general linear model coefficients for animal foraging behaviour traits bites/min (BM), bites/day (BD), steps/min (SM) and steps/day (SD) measured in summer. Coefficients (where significantly different from zero) are for linear and quadratic components of the effect of SR, day within a paddock grazing event (D), time of day (T) and year (Yr)

NS, not significant.
In the CS, there was again an increase in animal foraging activity with increased SR, though with less-pronounced statistical significance levels than in WS (R 2 values ranged from 0·60 to 0·69, for example), and year effects were also pronounced (Table 4). Coefficients for SM indicated a reduction in walking activity with increasing time in the same paddock. There were also time-of-day effects on grazing behaviour in the CS; coefficients in Table 4 were found from the inspection of means (not presented) to indicate higher BM values at the end of the day and higher SM values in the first morning observation period than at other times of day. With respect to the SR×D interactions in the CS (Table 4), BM increased more at lower SR than at higher SR, while SM decreased more at higher SR than at lower SR with increasing time in the same paddock. For example, mean BM values on days 2 and 7, respectively, of a paddock grazing event were 60 and 68 for the 2·7 sheep/ha SR and 69 and 71 for the 8·7 sheep/ha SR. The corresponding mean SM values were 6·0 and 6·2 for day 2 at an SR of 2·7 sheep/ha and 7·3 and 6·2 for day 7 of paddock grazing events at an SR of 8·7 sheep/ha.
SR means and general linear model coefficients for animal foraging behaviour traits BM, BD, SM and SD measured in autumn–early winter. Coefficients (where significantly different from zero) are for linear and quadratic components of the effect of SR, D, T and Yr

NS, not significant.
Vegetation cover, hoof print counts and herbage mass
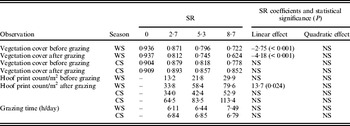
When statistically analysed by the extraction of coefficients for linear and quadratic effects of SR, a majority of the measurements were not significant, even though increased SR must have increased herbage removal, and means for the various measurements generally showed a corresponding gradation (Table 5). For the WS data, mean before-grazing cover was reduced at higher SR, indicating an incomplete recovery of vegetation between grazing events, with the logically expected decrease in cover at higher SR after grazing (Table 5). A non-significant increase in cover after grazing in CS (Table 5) might as well be confirmed as real if the standard error of measurement could be reduced, reflecting the fall of dead vegetation litter to the ground during the grazing of CS pastures comprised of accumulated WS growth. The number of hoof prints counted at high SR after grazing, when compared to low SR, was disproportionately less than the difference in SR (33·8 prints/m2 at 2·7 sheep/ha, 79·6 prints/m2 at 8·7 sheep/ha; Table 5), probably indicating increased incidence of print obliteration by the subsequent treading activity in the same grazing event, at higher SR.
SR means for vegetation cover (proportion of total ‘cover hits’), hoof-print counts (prints/m2) and grazing time (h/day) measured in conjunction with summer (WS) and autumn–early winter (CS) animal foraging behaviour observations

NS, not significant.
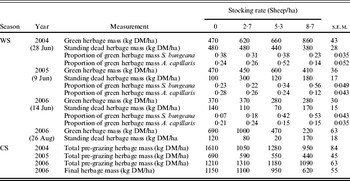
Selected herbage mass values presented (Table 6) for background to animal behaviour data on WS plots are the pre-grazing herbage mass for the first grazing of each of the three summers and mid- and end-of-season post grazing herbage mass in 2006. In general, herbage mass declined in successive years with the lower-than-average rainfall (Fig. 1) over the 3 years of the experimental period, but was higher in July and August, following the onset of spring growth, than at the start of the growing season.
Selected herbage mass data. For the summer (WS) experiments: pre-grazing herbage mass for each year (2004–2006) and final post-grazing herbage mass in 2006, with the proportion of green herbage mass as determined by dissection of herbage for two ‘indicator’ species, Stipa bungeana and Artemisia capillaris. For the late autumn–early (CS) experiments: total herbage mass at commencement of grazing in early November each year (2004–2006) and at the end of the experiments on 22 December 2006

Since CS pasture comprised standing hay from accumulated ungrazed WS growth, the pattern was for higher herbage mass at the initial CS grazing than at the initial WS grazing, with a herbage mass reduction of c. 200 kg DM/ha in a typical grazing event. Since the calculated animal demand for a 10-day grazing event at these SR is c. 35 kg DM/ha at 2·7 sheep/ha and about 110 kg DM/ha at 8·7 sheep/ha, this is consistent with an increase in ground cover from trampled litter in CS grazing events.
The selected herbage mass data (Table 6) indicate that pre-grazing herbage mass was variable but generally in the range 1000–1500 kg DM/ha with a considerable amount of dead herbage present. The end-of-season herbage mass in 2006 was c. 500 kg DM/ha after supporting 8·7 sheep/ha for 90 days in the WS (June–September) or 47 days in the CS (November–December) and the high SR favoured an increase in S. bungeana and decrease of A. capillaris.
Relationship between vegetation cover, treading, BM and SR
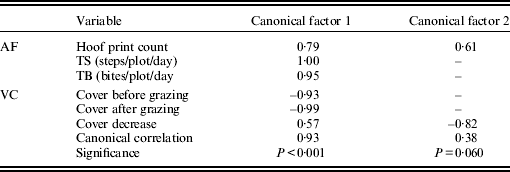
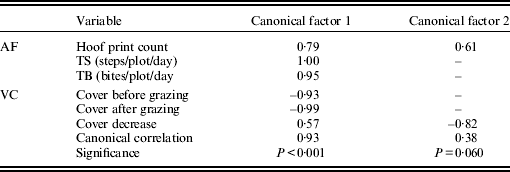
As expected, the link between increased grazing pressure at higher SR and cover reduction was very strong, and the multivariate analysis also indicated a carry-over effect from previous experiments (cover before grazing coefficient of canonical factor 1, Table 7). A second relationship, of lesser significance in the multivariate analysis, was that cover reduction at grazing was decreased for those observations where more hoof prints were counted (canonical factor 2, Table 7), a pattern which is not intuitively easy to explain.
Correlation coefficients indicating the relationship between animal foraging (AF) behaviour variables and vegetation cover (VC) variables in canonical correlation analysis. Coefficients less than 0·4 suppressed
Derivation of components of DM intake
Combining the herbage intake estimates (Table 1) and the information on BD and BM (Tables 3 and 4), it is possible to estimate the components of DM intake, such as bite weight and DM intake/min of grazing time, in order to provide further understanding of the system under study. This was separately done for the WS and the CS, based on the 3-year mean data. Daily DM intakes derived from MEI/sheep (Table 1), assuming a herbage ME value of 9·0 MJ ME/kg DM in the WS and 8·0 MJ ME/kg DM for CS forage were 1060, 1020 and 1020 g/day and 1140, 1130 and 1140 g/day, for 2·7, 5·3 and 8·7 sheep/ha in the WS and CS, respectively. The corresponding bite weights were 0·048, 0·037 and 0·030 g and 0·043, 0·040 and 0·040 g, again for 2·7, 5·3 and 8·7 sheep/ha in WS and CS, respectively. Finally, the corresponding six browsing intake rates were 2·93, 2·59 and 2·27 g/min in WS and 2·77, 2·67 and 2·80 g DM/min in CS.
DISCUSSION
Statistical analysis
The statistical analysis of the animal behaviour data collected over 3 years, with several thousands of observations for each behavioural trait in both WS and CS and five data dimensions and their interactions, is not straightforward. In particular, year-to-year differences such as rainfall-induced differences in herbage mass and possible differences in measurement technique between human observers recording animal behaviour or vegetation data in different years are confounded and cannot be statistically resolved. This must be borne in mind when interpreting these effects. There is also a theoretical possibility from a statistical perspective that effects attributed to SR in the ANOVA results could have arisen from spatially specific animal behaviour on particular paddocks. It is likely that the chances of such an effect are remote, since the experimental area was reasonably homogeneous with no such behaviour of animals noted during the experiment, and also because for such an effect to have influenced the results, the relevant differential behaviour would have needed to occur consistently across three spatial replicates of each SR. Overall, the data analysis adopted allows a focus on the animal grazing behaviour data and the consistent effects of SR on animal behaviour across years.
System energy yield and SR
The ME yield of these grazing systems ranged from 1·1 to 5·05 GJ/ha/year (Table 1). This represents c. 0·1–0·5 t herbage harvested/ha/year. If moisture was the limiting factor for herbage production and water use efficiency was 700 litres/kg DM (a value commonly found in cereal crops in China: Deng et al. Reference Deng, Shan, Zhang and Turner2006), the average annual rainfall of 359 mm could be expected to produce over 5 t DM/ha herbage and such values have been recorded in undegraded grasslands (Li et al. Reference Li, Chen, Wang and Huang1999; Hou et al. Reference Hou, Nan, Xiao and Chang2002). Hence, it seems reasonable that a sustainable agricultural system with greater energy yield should be possible. A future research project might investigate this point.
The increase in ME harvested at high SR occurred, because trebling SR from 2·7 to 8·7 sheep/ha reduced ME harvested per animal by only 12% in WS and 3% in CS (averaged over years, Table 1). Another feature of these systems is the high proportion of total ME harvested that is required for body maintenance, 0·66–0·75 in WS and c. 0·90 in CS (Table 1). It is also relevant to note that although mean animal BW was always reduced at the higher SR, differences in animal BW across SR treatments were often not statistically significant because of variation in BW between animals. It is the increased numbers of animals carried on the higher SR treatments that result in the harvested ME being much higher than low SR treatments.
Animal BW gain in WS was typically around 40 g/day, and as is well known from systems studies elsewhere (Kenyon & Webby Reference Kenyon, Webby, Rattray, Brookes and Nicol2007), low rates of BW gain lead to low-feed conversion efficiencies, because as noted above a high proportion of the energy from herbage ingested is required for body maintenance. Hence, it is clear that attempting to increase the weight of sheep in CS in these systems is extremely inefficient in energy terms.
The accuracy of estimation of DM intake in Table 1 and of bite weight above depends, in turn, on the accuracy of the value assumed for herbage ME. A recently published study of a Mongolian steppe grassland (Schönbach et al. Reference Schönbach, Wan, Schiborra, Gierus, Bai, Müller, Glindemann, Wang, Susenbeth and Taube2009) recorded herbage ME values (for bulk herbage cut to the ground level) ranging from a high of 9·5 MJ/kg in summer to a low of 7·6 MJ/kg in winter. The assumed values were chosen to fall within this range; however, it should be considered that diet selection by foraging animals might increase dietary ME, compared to values for bulk herbage in the field, so some uncertainty remains. What is very striking about this dataset, however, is that ME harvested per animal per grazing period decreased by only 12% as SR trebled from 2·7 to 8·7 sheep/ha in WS, and by only 3% in CS (Table 1). In intensive temperate systems, a much larger decline in intake with increasing SR is expected. This small response of intake to increased SR is very significant to the optimization and understanding of these systems and this point is discussed further below.
Herbage mass
Herbage mass data was intended to provide the context for the animal behaviour data rather than to define the impact of defoliation on herbage mass and botanical composition. For this reason, and because rainfall during the 3 years of experimentation was below the long-term average, the herbage mass data are not used here to make inferences about sustainability of the higher SR, even though the question of sustainability is of great interest. However, the site was considered degraded from overgrazing by local farmers even before experimentation began (Hou et al. Reference Hou, Nan, Xiao and Chang2002) and the depletion of herbage mass at 8·7 sheep/ha for 90 or 47 days in the WS or CS, respectively, together with an increase in S. bungeana cover in WS-grazed plots over the 3 years of the experiment (Table 6), suggests that both the 5·3 and 8·7 sheep/ha treatments exceed the long-term carrying capacity of this land in its present vegetation state, at least in seasons with lower-than-average rainfall.
Comparative environmental impact of defoliation and treading intensity
Grazing of livestock is one of the most important management activities in terrestrial ecosystems. During grazing, the main ways that livestock impact on the ecosystem include treading, ingestion of herbage and deposition of excrement. In steppe grassland, herbage ingestion reduces herbage height and standing crop biomass (Hou & Yang Reference Hou and Yang2006) and in temperate grasslands it has been observed to change the pattern of interspecies competition and the component and biodiversity of the plant community (Louault et al. Reference Louault, Carrère and Soussana1997; McIntyre et al. Reference Mcintyre, Heard and Martin2003). Defoliation also promotes tillering of grasses (Hodgson Reference Hodgson1990), stimulates the regrowth of herbage (Leriche et al. Reference Leriche, Leroux, Gignoux, Tuzet, Fritz, Abbadie and Loreau2001) and indirectly impacts on underground parts of plants and soil properties (Ford & Grace Reference Ford and Grace1998; Greenwood & Hutchinson Reference Greenwood and Hutchinson1998). Treading by livestock buries herbage seed and thereby promotes imbibition and germination of seed (Blumenthal & Ison Reference Blumenthal and Ison1996). Treading also fragments plant litter and therefore accelerates its decomposition (Zacheis et al. Reference Zacheis, Hupp and Ruess2001). Treading can destroy the soil crust (Hiernaux et al. Reference Hiernaux, Bielders, Valentin, Bationo and Fernandez-Rivera1999), increase soil compaction (Kainer et al. Reference Kainer, Duryea, de Macedo and Williams1998; Winter & Unger Reference Winter and Unger2001) and reduce soil stable aggregates, soil penetrability and soil porosity (Greenwood & McNamara Reference Greenwood and Mcnamara1992; Seitlheko et al. Reference Seitlheko, Allen and Wester1993). Thus, treading can exacerbate water runoff and soil erosion on sloping grazing land (Kobayashi et al. Reference Kobayashi, Hori and Nomoto1997; Hou & Ren Reference Hou and Ren2003). With respect to the comparative environmental impact of treading and ingestion activity, the present data indicate that both are important and closely inter-related (Table 7). It is interesting, however, that in terms of the WS treatment means for high and low SR (where grazing behaviour is not constrained by a short grazing time as in CS), proportional increase in SD from SR 2·7 to SR 8·7 sheep/ha of 77% is somewhat higher than proportional increase in BD of 53% (Table 3). Similarly, the highest canonical coefficient for grazing behaviour effect on vegetation cover was for SD (Table 7). This indicates a need to be aware of treading factors as a significant contributor to environmental degradation in these steppe land grazing systems at higher stocking densities.
SR and grazing behaviour
One clear elucidation of the relationship between intake rate, bite rate and bite weight in sheep is that of Allden & Whittaker (Reference Allden and Whittaker1970), who varied regrowth time, and therefore the height of swards at grazing for Lolium rigidum dominant pastures in Australia. These authors reported that bite weight for sheep ranged from <0·05 g DM/bite (with a bite rate of 60–70 bites/min) at a sward height of 50 mm (herbage mass not stated) to 0·4 g DM/bite (with a bite rate under 20 bites/min) at a herbage height of 350 mm (Allden & Whittaker Reference Allden and Whittaker1970, their Fig. 3). The bite weight and BR (bites/min) combinations reported in the present study (typically 0·04 g DM/bite and 65 bites/min) therefore lie at the bottom edge of the range reported by Allden & Whittaker (Reference Allden and Whittaker1970). In their experiment, it appears that bite weights as low as 0·05 g DM/bite limited the intake rate (g DM/min) and it can be inferred from their Fig. 1 that this limitation to bite weight was associated in their Australian experiment with low herbage mass around 500 kg DM/ha. Since herbage mass values in the present study (Table 6) are generally higher than that, the question then arises: what is limiting bite weight in the present experiment? A hypothesis is proposed for further investigation that the limiting factor to bite weight that differentiates the grazing dynamics in these steppe grasslands from that in temperate grasslands is low herbage bulk density or sparse distribution of available herbage through a greater height range above the ground. This idea is supported by Fig. 2 of Allden & Whittaker (Reference Allden and Whittaker1970) where a similar effect is demonstrated for artificially thinned temperate swards; under this model, many more ‘bite opportunities’ would be available per unit ground area and bite size would be smaller in a sparsely distributed sward than in a dense sward. For dense temperate swards, intake/animal is generally reduced with increased SR. For a sparsely distributed sward, increasing SR need not affect the number of pieces of herbage harvested, providing the number of ‘bite opportunities’ is somewhat greater than the product of the number of animals, their BR and the grazing time. The main effect of increasing SR then would not be to decrease the average sward volume available to individual animals, but to decrease the ‘selection opportunity’ and hence decrease the choice and perhaps to some extent the mean size of each herbage piece or bite. Where animals are able to increase bite frequency to compensate, or where reduction in mean bite size through the restriction of choice is only minor in relative terms, intake would be little affected by SR increase, as was seen in the present experiment. Such a response may not be universal on the Loess Plateau, however. For example, Li et al. (Reference Li, Chen, Wang and Huang1999) reported responses to change in SR were similar to those seen in temperate pastures.
Implications for system change and future study
The current experimental findings are that grazing systems on the Northwest China Loess Plateau are typified by very small bite size, compared to temperate grazing systems, and demonstrate a very ‘flat’ intake response to change in SR has high relevance for their understanding and management. First, this finding may point to an ecological link between chronic overgrazing and survival of species with sparsely distributed herbage. Second, there is a danger of farmers being tempted to stock the land beyond its sustainable carrying capacity when per animal intake is relatively undiminished at higher SR. Hence, the risk of adverse environmental impact from farming activities is increased. In this context, there is already a trend for territorial administrators to close some of these steppe lands to grazing, but with greater understanding, solutions providing both production and environmental benefits might be found.
Finally, where grazing of the steppe land is practised, there are clearly significant opportunities to enhance human food production if more of the ME harvested is directed towards animal production rather than towards animal body maintenance. An obvious way to achieve this is by lifting rates of BW gain. Further study to define the extent to which the comparatively low BW gain rates of approximately 40 g/day are determined by animal genetic factors, low herbage mass, or vegetation factors such as low digestibility, and possible strategies for removing limitations, is indicated. Options include exploring ways to beneficially influence botanical composition of grassland, or avoid inefficiencies such as the low rate of BW gain in animals being kept for slaughter, but recognizing that social factors come into play and must be taken into account whenever production systems change.
We thank Professor Zhibiao Nan for his assistance with the experimental design and implementation and A. Noble and N. Lopez-Villalobos of Massey University for statistical advice. This research was supported by the National Key Basic Research Foundation Project of China (2007CB108902) and National Natural Science Foundation of China (30771529), National Key Project of Scientific and Technical Supporting Programs (2006BAD16B01) and Specialized Scientific Research Fund for Commonwealth Trade (Agriculture) (nyhyzx07-022).