I. INTRODUCTION
In the last few decades, great efforts have been made in the field of nonlinear optics (NLO) and it has been developed as a promising area of research with a wide range of potential applications, such as optical limiting as well as all optical photonics and photoelectronics devices.Reference Chirackal Varkey and Sreekumar1–Reference Rath, Khasminskaya, Nebel, Wild and Pernice5 Therefore, a great number of materials have been synthesized and their nonlinear optical properties have been investigated.Reference Chirackal Varkey and Sreekumar1–Reference Maranski, Kucharski, Ortyl, Nunzi, Ahmadi-Kandjani, Dabos-Seignon, Chan and Barille6 Recently, the NLO materials have been used in optical and optoelectronical devices, functioning as light emitters, second harmonic generators, frequency converters, waveguide switches, photomechanical systems, micropatterning, etc.Reference Chirackal Varkey and Sreekumar1–Reference Maranski, Kucharski, Ortyl, Nunzi, Ahmadi-Kandjani, Dabos-Seignon, Chan and Barille6
In particular, in recent years, significant investigations have been carried out on the properties of polymer nanocomposites of many organic–inorganic systems and new NLO materials.Reference Bomm, Buchtemann, Fiore, Manna, Nelson, Hill and Van Sark7 To improve optical operation or optimization of nonlinearity in such systems, the knowledge of the optical data and the influence of nanoparticles (NPs) on the NLO behavior of the materials are needed.
Among the various interesting properties of optical nonlinear effects, nonlinear refractive (NLR) index, n 2, and nonlinear absorption (NLA), β, are the most important; both of which are very crucial parameters in designing optical devices.Reference Boyd8 Various techniques have been used to measure the nonlinearity of the materials. The single beam Z-scan technique is a sensitive and powerful technique to study the nonlinear properties of materials.Reference Sheik-Bahae, Said, Wei, Hagan and Van Stryland9 The closed-aperture (CA) and open-aperture (OA) Z-scan allow measurement of both sign and value of the NLR and the NLA in a sample, respectively.
To the best of our knowledge, the third-order nonlinear optical behavior of SiO2 and Al2O3 on polyurethane (PU) and their comparison have not been carried out so far. In the present work, we have evaluated the effects of SiO2 and Al2O3 NPs in polyurethane open-cell (PUOC) matrix by considering their optical properties through scanning electron microscopy (SEM) imaging and Fourier transform infrared (FTIR) spectroscopy. Furthermore, we investigated the third-order nonlinear optical properties of PUOC/SiO2 and PUOC/Al2O3 nanocomposites using the CA and OA Z-scan techniques by a Nd:YAG laser at the wave length of 532 nm with continuous-wave (CW). According to the results obtained, the synthesized material can be a good candidate for real optical devices; especially in nonlinear optical field.
II. EXPERIMENTAL
A. Materials
Silicon oxide (99.5+%, S-type, spherical particles, 15–20 nm, amorphous) and aluminum oxide NPs (gamma, 99+%, spherical particles, 20 nm) were purchased from US Research Nanomaterials, Inc. The PU foam material composed of two commercially reactants: polyisocyanate and polyol components in the form of liquid supplied by Exxon Panah Co., Iran (semi rigid open cell, SROC, PU foam). Polyisocyanate used was diphenylmethane diisocyanate (MDI, ρ = 1.23 g cm−3) and polyol component based on the polyether polyol (ρ = 1.1 g cm−3), blowing agent (water), catalyst, and surfactant.
B. Sample preparation
1. Preparation of blank PUOC
The one-step system is currently used in the PUOC foam fabrication.Reference Ashida10 For blank PU foam, two components can be mixed at a 1:1 ratio at 2000 rpm for about 10 s in an open cylindrical mold at room temperature and no heating is necessary. The polymerization reaction then takes place and simultaneously foaming begins due to CO2 gas generation.
2. Preparation of PUOC/SiO2 and PUOC/Al2O3
Four different weight percentages of SiO2 NPs (0.5, 1.0, 1.5, and 2.0 wt%) were dissolved in a polyol component solution individually using a minishaker (7312 DG Apeldoorn, Nederland, IKA MS2 mini shaker) for 20 s at 3000 rpm in an open cylindrical mold at room temperature until a homogenized solution was obtained. Then, the diphenyl methane diisocyanate (MDI) part was added to the solution by doing vortex at 2000 rpm for 10 s. As discussed,Reference Ashida10 the foam preparation occurs by simultaneous polymer formation and gas generation. For a well prepared sample and producing CO2 gas during reaction time, the cover of the PUOC/SiO2 container was taken off. After 10–12 s, the reaction was ended by the formation of foams in the samples. The ratio of polyol:MDI was 1(2 mL):1(2 mL) in all the synthesized samples. The procedure for fabricating PUOC/Al2O3 was similar to the procedure mentioned above. For the analysis purposes, the samples were kept in the stream of the liquid nitrogen gas and then were cut in the slices with 1 mm diameter.
III. SAMPLE CHARACTERIZATION RESULTS AND DISCUSSION
In this section, the PU foams were characterized and studied via SEM micrographs, and FTIR spectra and also by measurement of nonlinear optical properties via Z-scan technique results.
A. SEM analysis
The synthesized samples were analyzed under a SEM at different magnifications. The images were provided under a SEM Seron Technology-AIS 2100 model using 30 kV (Uiwang-si, Korea) accelerating voltage after coating the samples with a thin layer of gold. All foam pictures were taken perpendicular to the foam rising direction.
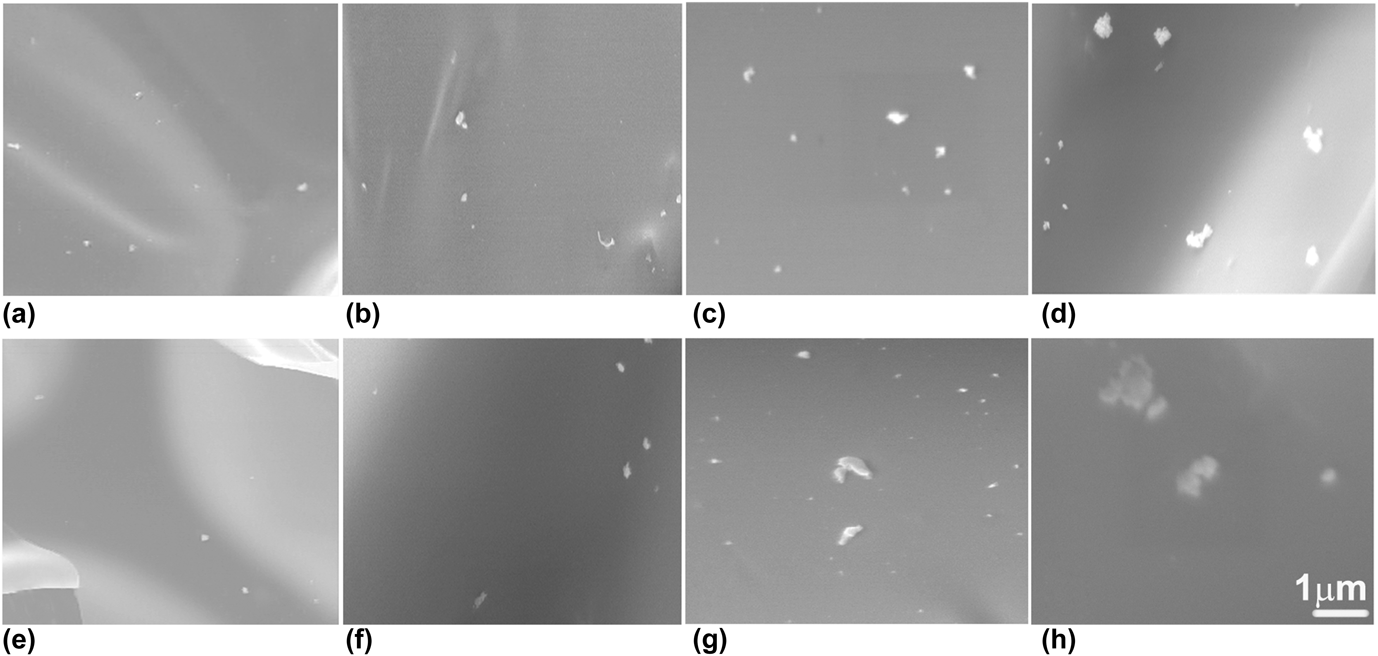
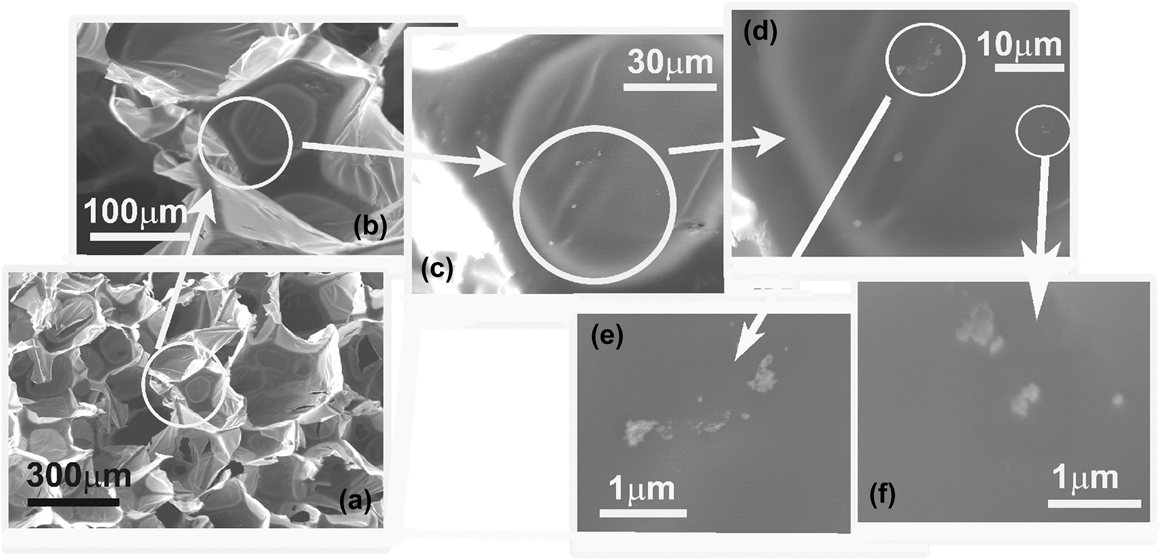
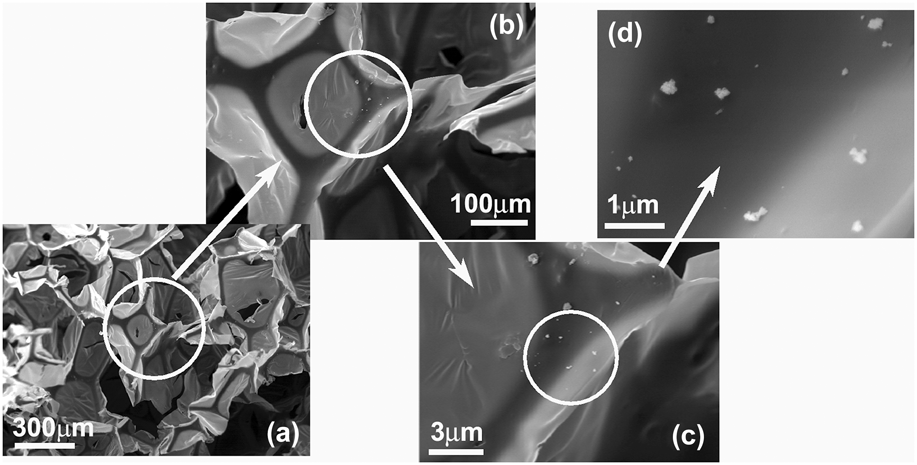
The resulting samples were analyzed under a SEM at different magnifications. Figure 1 clearly reveals the difference between PUOC nanocomposites in the case of different loadings of NPs. The fractured surface of PUOC nanocomposites shows well-dispersed NPs, which is due to the covalent bonding between the PU chain and the nanofiller. However, at higher loading (2.0 wt%) especially in the case of PUOC/SiO2 nanocomposites, some aggregation took place. Here, only the SEM images of nanocomposite foams with SiO2 and Al2O3 NP contents of 2.0 wt% are shown in Figs. 2 and 3, respectively. As seen in Figs. 2(a)–2(f), close inspection (with x150, x500, x1.5k, x6k, x10k, and x25k magnifications, respectively) of the cell struts reveals that the PUOC/SiO2 nanocomposite foams have a microporous skeleton. Figures 3(a)–3(d) are related to close inspection (with x150, x500, x1.5k, and x25k magnifications, respectively) of the cell struts of the PUOC/Al2O3 nanocomposite foams with microporous skeleton. The presence of the microvoids can be explained in terms of the chemical reactivity of NPs with the isocyanate monomer.Reference Basirjafari, Malekfar and Esmaielzadeh Khadem11 The presence of NPs in a microvoid of foams gives evidence of the aforementioned claim.
SEM images of the PU foams with (a) 0.5 wt%, (b) 1.0 wt%, (c) 1.5 wt%, (d) 2.0 wt% Al2O3 NPs, (e) 0.5 wt%, (f) 1.0 wt%, (g) 1.5 wt%, and (h) 2.0 wt% SiO2 NPs.

SEM images of PU nanocomposite loaded with 2.0 wt% SiO2 NPs with different magnifications, (a) x150, (b) x500, (c) x1.5k, (d) x6k, (e) x10k, and (f) x25k to show microvoids.

SEM images of PU nanocomposite loaded with 2.0 wt% Al2O3 NPs with different magnifications, (a) x150, (b) x500, (c) x1.5k, and (d) x25k to show microvoids.

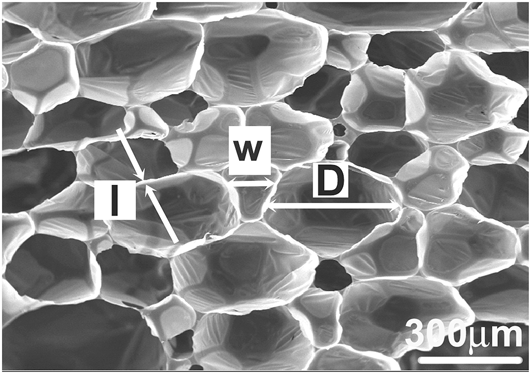
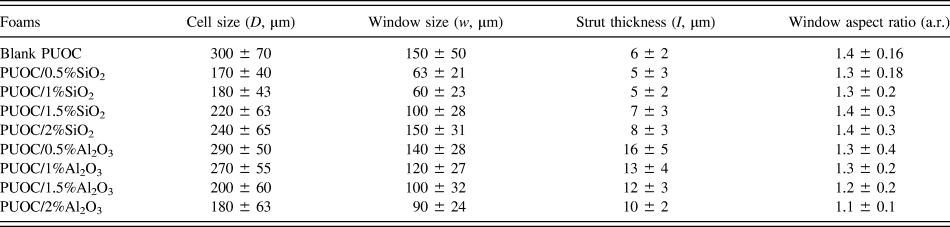
Considering the SEM images, some characteristics were determined such as the cell size D (cell equatorial diameter), the window size w (major axis of window), the window shape factor a.r. (“aspect ratio”, which represents the ratio between the length of the major axis and its perpendicular), and the strut thickness (strut transverse length).Reference Peng, Fan and Evans12,Reference Matos, Dias and Costa Oliveira13 The averaged data correspond to measuring a total of about 50 cell sizes (D), 30 window sizes (w), 30 aspect ratios (a.r.), and 30 strut thicknesses (l).
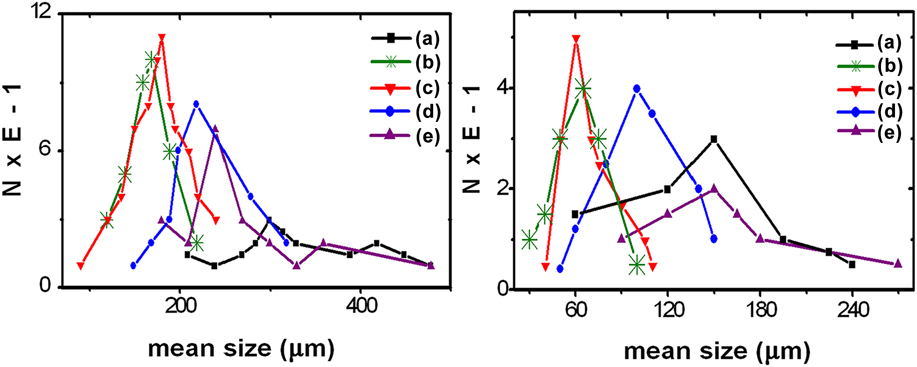
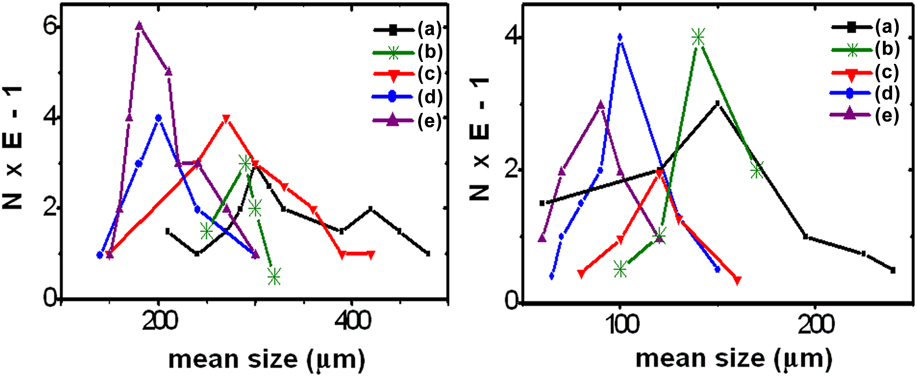
The parameters measured on the images are shown in Fig. 4. The data are summarized in Table I. The cell and window size distributions are compared in Figs. 5 and 6. All data were compared at the 5% confidence level.
SEM image of PUOC foams illustrating measured microstructural parameters: D (cell size), w (window size), and l (strut thickness).

Summary of the microstructural parameter data obtained on the foam sections (mean ± standard deviation).

(Left) Cell size distributions (number%) of the PU foams with SiO2 NP contents of (a) 0.0 wt%, (b) 0.5 wt%, (c) 1.0 wt%, (d) 1.5 wt%, and (e) 2.0 wt%. (Right) window size distributions (number%) of the PU foams with SiO2 NP contents of (a) 0.0 wt%, (b) 0.5 wt%, (c) 1.0 wt%, (d) 1.5 wt%, and (e) 2.0 wt%.

(Left) Cell size distributions (number%) of the PU foams with Al2O3 NP contents of (a) 0.0 wt%, (b) 0.5 wt%, (c) 1.0 wt%, (d) 1.5 wt%, and (e) 2.0 wt%. (Right) window size distributions (number%) of the PU foams with Al2O3 NP contents of (a) 0.0 wt%, (b) 0.5 wt%, (c) 1.0 wt%, (d) 1.5 wt%, and (e) 2.0 wt%.

In what respects the structure, data in Table I clearly show that the foams reflect the internal architecture of the respective samples. The main morphological results from Table I and Figs. 5 and 6 are pointed out below:
1. PUOC/SiO2
(i) The average cell and window sizes of pure PUOC foam are stronger than those of PUOC/SiO2.
(ii) The cell and window size distributions of PUOC/SiO2 are finer and narrower than those of the pure PUOC.
(iii) The window elliptical shape in pure PUOC is more emphasized than that in PUOC/SiO2.
(iv) By adding SiO2 NPs into the polymer matrix from 0.5 wt% to 2.0 wt%:
(a) The cell size distribution of nanocomposites becomes wider and stronger.
(b) The window size distributions of PUOC/SiO2 become coarser.
(c) The average cell and window sizes of nanocomposites become coarser.
(d) The window shape in nanocomposites is less circular.
2. PUOC/Al2O3
(i) The average cell and window sizes of pure PUOC foam are stronger than those of PUOC/Al2O3.
(ii) The cell and window size distributions of PUOC/Al2O3 are finer and narrower than those of the pure PUOC.
(iii) The window shape in pure PUOC is more elliptical than that in PUOC/Al2O3.
(iv) By adding Al2O3 NPs into the polymer matrix from 0.5 wt% to 2.0 wt%:
(a) The cell size distribution of nanocomposites becomes wider and finer.
(b) The average cell and window sizes of nanocomposites become finer.
(c) The shape of windows becomes more circular.
(v) In both nanocomposite foams, the window sizes are distributed in narrower ranges than that in the blank PUOC.
As a result, by adding NPs from 0.0 wt% to 1.0 wt% into the PUOC matrix, the cell and window sizes of the samples nearly decreased. The cell size decrease causes to increase the porosity. Porosity is an essential factor for absorbing energy and being good insulator in around environment. Furthermore, by increasing the SiO2 and Al2O3 NP contents from 0.5 wt% to 2.0 wt% in the PUOC matrix, the cell and window sizes of the synthesized samples were increased and decreased, respectively.
The cell sizes in composition of PU/Al2O3 were decreased by increasing the NPs. We suggest that the increase of this NP maybe caused by increasing the formation of main/side chains in PU that tend to develop smaller cells. The cell sizes in composition of PU/SiO2 were decreased by increasing the NP from blank to 1 wt% but it increased from 1 wt% to 2 wt%. However, in all of treatment compounds, the cell sizes were lower than their blank ones. We suggest that the solubility/suspension of this NP was increased until 1 wt% and it decreased in higher concentrations.
B. FTIR analysis
FTIR absorption spectra of the synthesized samples as powder-pressed KBr pellets were collected using a Thermo Nicolet Nexus 760 FTIR spectrometer system (Madison, WI) with 4 cm−1 resolution at room temperature.
1. FTIR spectroscopy of PUOC/SiO2
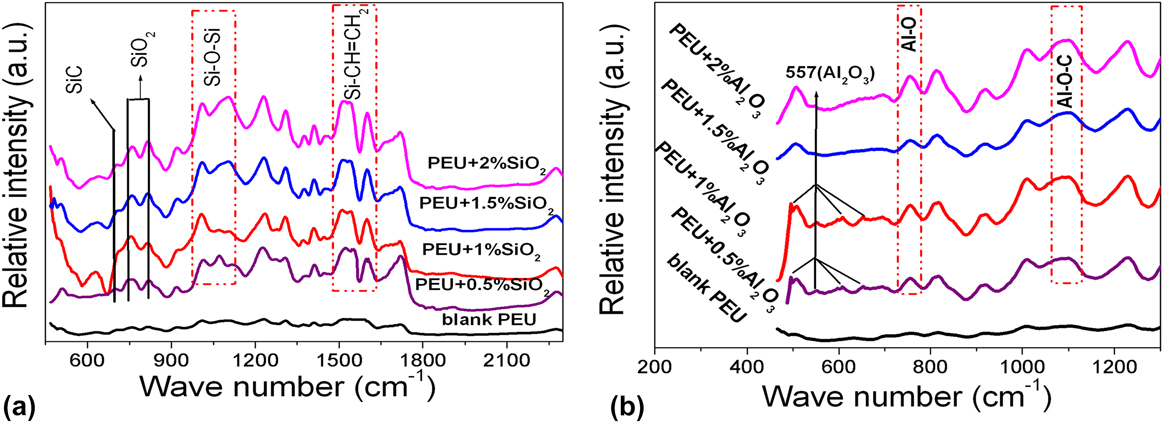
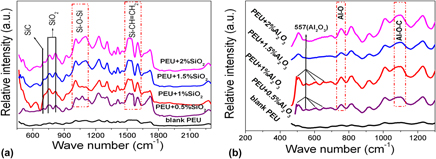
The recorded FTIR bands of PUOC/SiO2 nanocomposites shown in Fig. 7(a) are related to the ratio of reaction of SiO2 NPs with the blank PUOC and can be described as below:
FTIR spectra of (a) PUOC/SiO2 nanocomposite foams with different loading fractions of SiO2 NPs in the spectral region of 450–2200 cm−1 and (b) PUOC/Al2O3 nanocomposite foams with different loading fractions of Al2O3 NPs in the spectral region of 450–1300 cm−1.

The Si–C bond, asymmetric stretching Si–O–Si bond, and Si–CH=CH2 bond are ascribed to the peaks at 704, 1000–1100, and 1590–1615 cm−1, respectively.Reference Stuart14,Reference Nakamoto15 It means that by increasing the SiO2 NPs from 1.0 wt% to 2.0 wt% in the blank PUOC, the intensity of these peaks has increased due to the increase in the length of the main chain of the polymer. However, by increasing the SiO2 NPs from 0.5 wt% to 1.0 wt% in the blank PUOC, the intensity of these peaks was slowly decreased. The other peaks at 778 and 810 cm−1 are related to the extra amount of SiO2 NPs in the blank PUOC; hereby their intensity has decreased by increasing the NP percentages.Reference Luo, Hong, Xie and Feng16,Reference Sadeghi, Semsarzadeh, Barikani and Pourafshari Chenar17 It can be deduced that the affinity of SiO2 NPs for reaction with the blank PUOC will increase by increasing the NP percentages.
2. FTIR spectroscopy of PUOC/Al2O3
The recorded FTIR bands of PUOC/Al2O3 nanocomposites shown in Fig. 7(b) are related to the ratio of reaction of Al2O3 NPs with the blank PUOC, which can be described as below:
The peaks at 480, 597, and 650 cm−1 are related to Al2O3 NPs. These peaks were observed only in 0.5 wt% and 1.0 wt% Al2O3 and not in other combinations of these NPs with the blank PUOC. However, the peak at 557 cm−1 that is related to pure Al2O3 NPs was detected in all combinations of the NPs with the blank PUOC; hereby, its intensity has decreased by increasing the NP percentages.Reference Nakamoto15 It is deduced that the affinity of Al2O3 NPs for reaction with the blank PUOC will increase by increasing the NP percentages.
The peaks at 735 and 1087 cm−1 are related to Al–O and Al–O–C bonds, respectively.Reference Nakamoto15,Reference Gong and Parsons18 It means that by increasing the Al2O3 NPs from 1.0 wt% to 2.0 wt% in the blank PUOC, the intensity of these peaks increased due to the increase in the length of the main chain of the polymer. However, by increasing the Al2O3 NPs from 0.5 wt% to 1.0 wt% in the blank PUOC, the intensity of these peaks was slowly decreased.
C. Z-scan setup
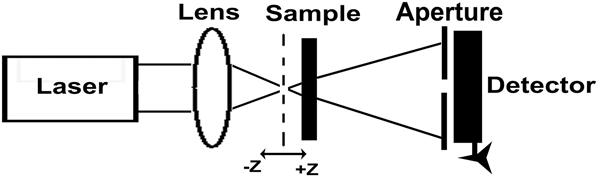
The experimental setup for the Z-scan experiments is shown in Fig. 8. An incident laser beam from a CW Nd:YAG laser at its second harmonic frequency of 532 nm with TEM00 Gaussian profile, which is propagating and focused by a lens (f = 5 cm), illuminated the sample. The radius of the beam waist ω0 is determined by an edge scan method. The sample is moved along the z axis in the vicinity of the lens focal plane (the +z direction is the laser propagation direction).Reference Li Guo, Gu and Zhang19 The transmitted intensity is collected and recorded by a photodiode detector.
Experimental setup for the CA Z-scan technique.

1. Z-scan theories on nonlinear process
The linear absorption in low incident powers is calculated by Eq. (1), where P and P 0 are related to the output power with and without the sample, respectively.Reference Sheik-Bahae, Said, Wei, Hagan and Van Stryland9,Reference Wu, Tian, Chen, Zhang, Zhao, Cao and Xie20
 $$\alpha = - {{\left\{ {Ln\left( {{P \mathord{\left/ {\vphantom {P {{P_0}}}} \right. \kern-\nulldelimiterspace} {{P_0}}}} \right)} \right\}} \mathord{\left/ {\vphantom {{\left\{ {Ln\left( {{P \mathord{\left/ {\vphantom {P {{P_0}}}} \right. \kern-\nulldelimiterspace} {{P_0}}}} \right)} \right\}} L}} \right. \kern-\nulldelimiterspace} L}\quad .$$
The phase shift incurred by an optical beam traveling a distance L in the medium isReference Li Guo, Gu and Zhang19:
 $$\left| {\Delta {\varphi _0}} \right| = - \left( {{{2\pi } \mathord{\left/ {\vphantom {{2\pi } \lambda }} \right. \kern-\nulldelimiterspace} \lambda }} \right)\Delta n{L_{{\rm{eff}}}}\quad ,$$
where L eff is an effective sample thickness, L eff = (1 − e −αL)/α, and Δn is referred to the NLR index.Reference Sheik-Bahae, Said, Wei, Hagan and Van Stryland9,Reference Ye, Qiu, Yang, Cao, Guan and Zhuang21 The relation for NLR index is n = n 0 + n 2I 0, in which n, the total refractive index, n 0, linear refractive index, n 2, NLR index, and I 0 = 2P in/(πω02) is the incident intensity at the focal point that is 2493.7 W/cm2, and P in is the laser power that is 55 mW in this work.Reference Sheik-Bahae, Said, Wei, Hagan and Van Stryland9 Also, ω0 is the radius of the waist of the illumination beam inside the sample as 37 μm. The Rayleigh diffraction length is 8.1 mm at the focal plane. According to these formulae, the equivalent relation for Eq. (2) is:
 $$\left| {\Delta {\varphi _0}} \right| = - \left( {{{2\pi } \mathord{\left/ {\vphantom {{2\pi } \lambda }} \right. \kern-\nulldelimiterspace} \lambda }} \right){n_2}{I_0}{L_{{\rm{eff}}}}\quad .$$
In CA scheme, an aperture placed at the far field position by monitoring the transmittance change through a small aperture, which is able to determine the amplitude of the phase shift. By using CA scheme, the distance value between the normalized transmitted peak and the transmitted valley is nominated by ΔT p−v, which is related to |Δφ0| with the following expression:
 $$\Delta {T_{{\rm{p}} - {\rm{v}}}} = f\left| {\Delta {\varphi _0}} \right|\quad {\rm{for}}\quad \Delta {\varphi _0} \prec \pi \quad .$$
In this relation, f is an experimental constant and is assigned by means of a parameter as the aperture linear transmission, S, that is about 0.3 (or 1) for closed (or open) aperture Z-scan experiment.Reference Van Stryland, Sheik-Bahae, Said and Hagan22 The experimental constant f is introduced with the following equation f = 0.406(1 − S)0.25, then by putting the amount of f into Eq. (4), the NLR index, n 2 (cm2/W), can be obtained from the following equationReference Sheik-Bahae, Said, Wei, Hagan and Van Stryland9,Reference Van Stryland, Sheik-Bahae, Said and Hagan22 :
 $$\Delta {T_{{\rm{p}}-{\rm{v}}}} = 0.406{\left( {1 - S} \right)^{0.25}}\left( {{{2\pi } \mathord{\left/ {\vphantom {{2\pi } \lambda }} \right. \kern-\nulldelimiterspace} \lambda }} \right){n_2}{I_0}{L_{{\rm{eff}}}}\quad .$$
It should be noted that the experimental results of Z-scan data with an aperture divided by those without an aperture can be used to obtain the pure NLR. However, using normalized transmittance of CA, the NLR index can be calculated. The quantity measured in an OA Z-scan experiment is the NLA coefficient that is investigated by normalized transmittance OA Z-scan.
The absorption coefficient is assigned as α(I) = α0+βI, where α0 is the linear absorption coefficient and is calculated by Eq. (1), in which I is the intensity of the incident laser light. In combination with the known NLA coefficient, for induced absorption β ≻ 0 and for induced transparency or saturation of linear absorption β ≺ 0.Reference Ye, Qiu, Yang, Cao, Guan and Zhuang21 The amount of β is estimated by fitting the OA Z-scan trace with the following equationsReference Sheik-Bahae, Said, Wei, Hagan and Van Stryland9,Reference Ye, Qiu, Yang, Cao, Guan and Zhuang21,Reference Van Stryland, Sheik-Bahae, Said and Hagan22 :
 $${T_{{\rm{norm}}}}\left( z \right) = {{\ln \left( {1 + {q_0}(z,t)} \right)} \mathord{\left/ {\vphantom {{\ln \left( {1 + {q_0}(z,t)} \right)} {{q_0}\left( {z,t} \right)}}} \right. \kern-\nulldelimiterspace} {{q_0}\left( {z,t} \right)}}\quad ,$$
 $${q_0}\left( {z,t} \right) = {{\beta {I_0}{L_{{\rm{eff}}}}} \mathord{\left/ {\vphantom {{\beta {I_0}{L_{{\rm{eff}}}}} {\left( {{{1 + {z^2}} \mathord{\left/ {\vphantom {{1 + {z^2}} {\mathop {{z_0}}\nolimits^2 }}} \right. \kern-\nulldelimiterspace} {\mathop {{z_0}}\nolimits^2 }}} \right)}}} \right. \kern-\nulldelimiterspace} {\left( {{{1 + {z^2}} \mathord{\left/ {\vphantom {{1 + {z^2}} {\mathop {{z_0}}\nolimits^2 }}} \right. \kern-\nulldelimiterspace} {\mathop {{z_0}}\nolimits^2 }}} \right)}}\quad ,$$
Where z 0 = kω02/2 is the diffraction length of the beam and k = 2π/λ is the wave vector.
2. CA and OA Z-scan results
According to the typical preparation for Z-scan method, the blank PUOC, PUOC/SiO2, and PUOC/Al2O3 nanocomposites were separately dissolved into DMF and the solution with 0.1 M was achieved. The samples were placed in a 1 mm-thick quartz cell. In Z-scan experiment, the sample was moved forward or backward along the direction of the laser beam around the focus.
The laser beam waist set at the focal point and the radius of the waist of the illumination beam inside the sample (ω0) was 37 μm. The CA (S = 0.32) scheme allowed to determine both the sign and the magnitude of n 2.
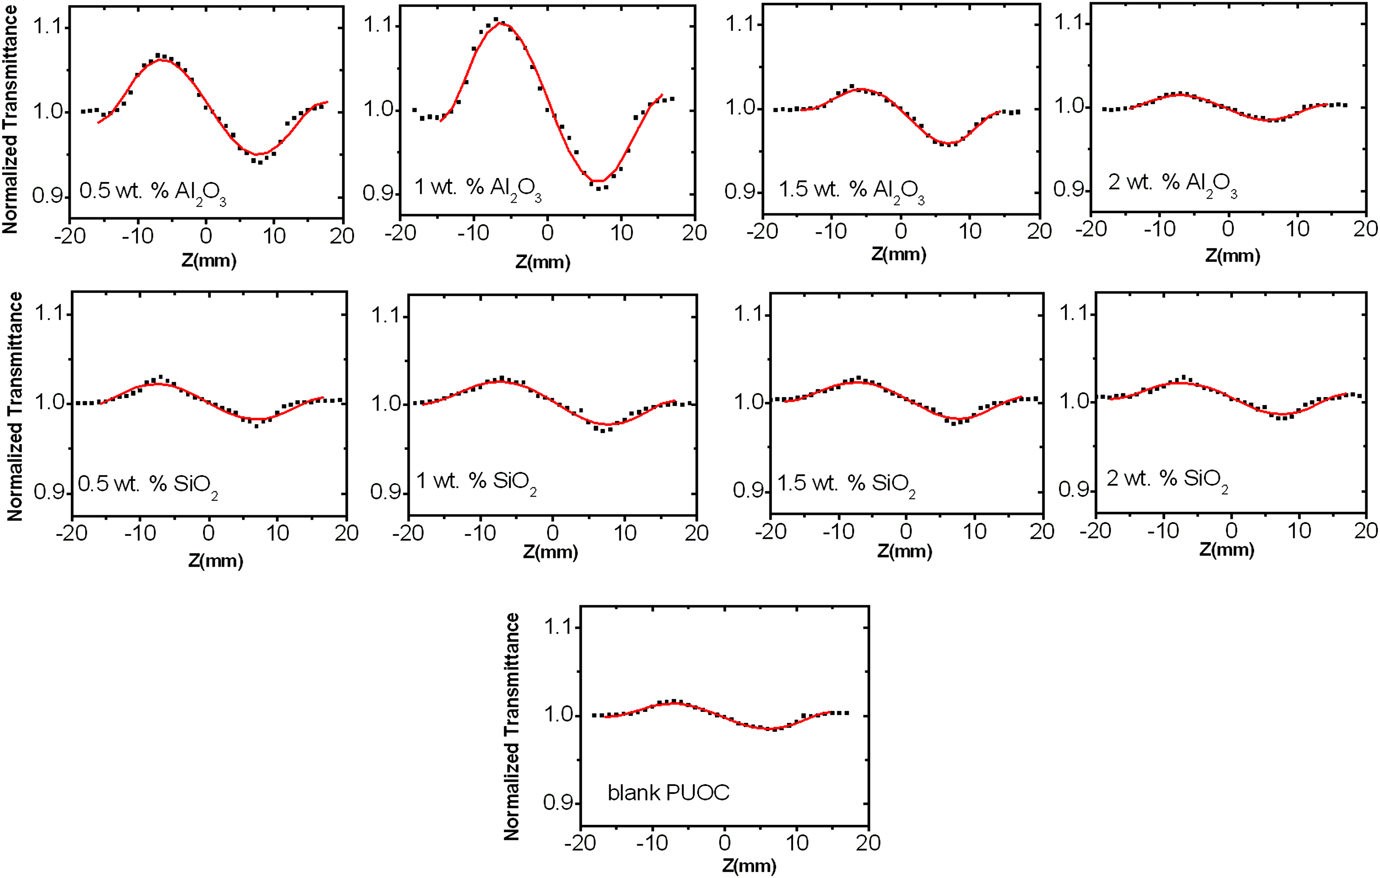
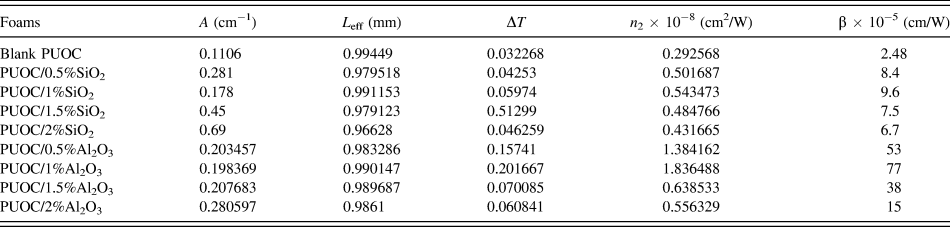
Figure 9 shows pure closed Z-scan data of different compositional percentages of SiO2 NPs and Al2O3 NPs in the blank PUOC. As can be seen in the normalized curves of CA Z-scan, there exists a pair of peak and deep valley, which can be identified as a self-defocusing material.Reference Ye, Qiu, Yang, Cao, Guan and Zhuang21 Since the valley comes after the transmittance peak, the sign of the refractive nonlinearity of all the foams is negative, which indicates self-defocusing effect of the synthesized samples. The order of NLR indices coefficients is 10−8 (cm2/W) with negative sign that are obtained from Eq. (5) and tabulated in Table II.
CA Z-scan experimental curves of PUOC/SiO2 and PUOC/Al2O3 nanocomposites.

Z-scan data and values calculated for the nonlinear optical properties of the synthesized samples.

As a result, by adding NPs into the blank PUOC from 0.5 wt% to 1.0 wt%, the NLR index increased and then decreased up to 2.0 wt%. By adding NPs into the blank PUOC from 1.0 wt% to 2.0 wt%, the length of the main chain of the polymer has increased, which suppresses the NLO properties. Furthermore, the polarity of Al2O3 is more than that for SiO2 NPs, causing stronger NLO properties for PUOC/Al2O3 nanocomposites in comparison with PUOC/SiO2 nanocomposites.
Our results show that there are various physical mechanisms such as thermal and ultrafast electronic effects that can produce the NLR index change in both types of nanocomposites. A considerable contribution to the NLR index under a CW laser for sample illumination can take place due to thermal effects.Reference Boyd8,Reference Pramodini, Poornesh and Nagaraja23,Reference Espinosa and Onmori24 Thus, we expect that thermal effect overcomes the other effects. This estimate confirms the theoretical and general estimate made by other researchers.Reference Boyd8,Reference Pramodini, Poornesh and Nagaraja23–Reference Rudresha, Bhat, Ramakrishna, Anthony, Lee and Rotermund25
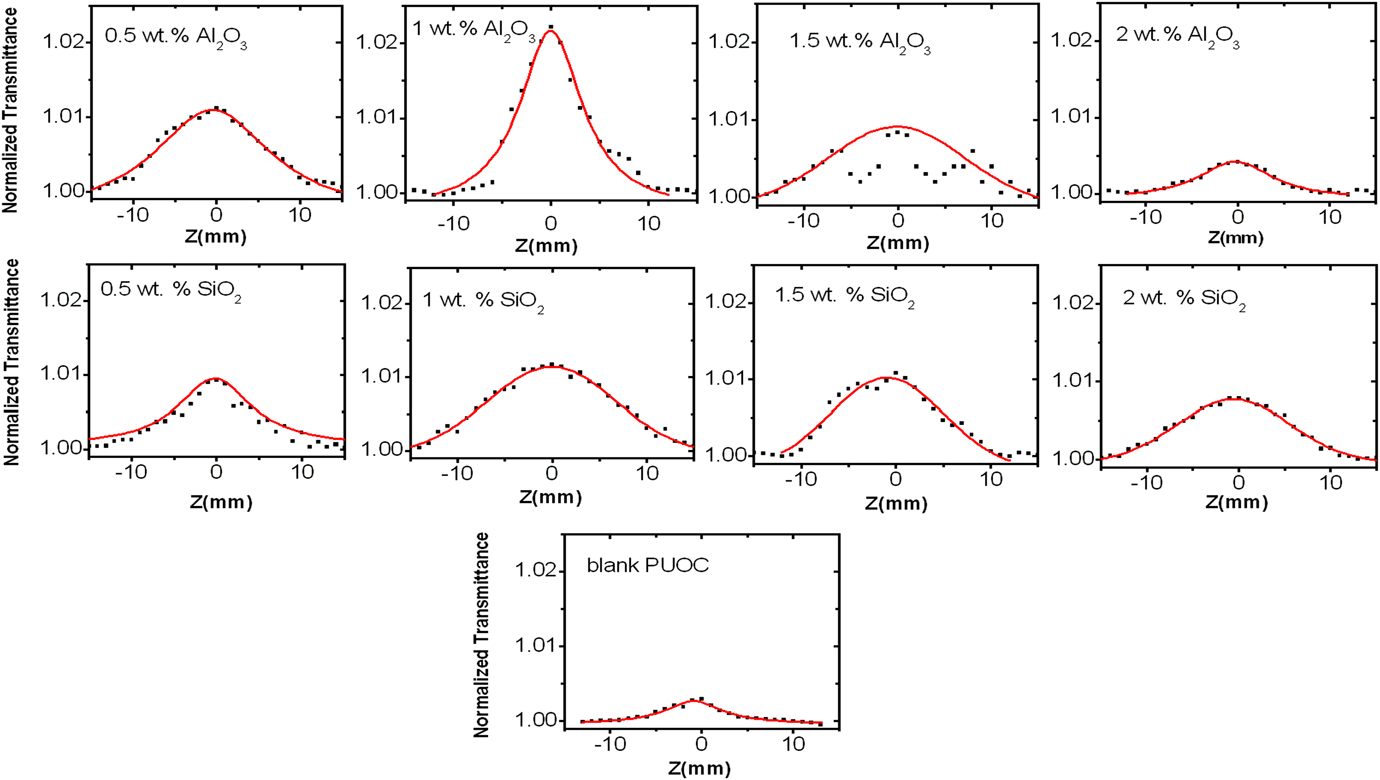
It is seen that the OA transmittance is symmetric with respect to the focus (z = 0), where has a maximum transmittance. Figure 10 shows the OA Z-scan curves obtained for all synthesized samples. The values of β (cm/W) can be obtained from Eq. (6).
OA Z-scan experimental curves of PUOC/SiO2 and PUOC/Al2O3 nanocomposites (normalized transmittance versus distance of focal length).

The NLA coefficients of the synthesized samples were obtained from OA Z-scan in the order of 10−5 (cm/W) with positive sign that shows the presence of strong saturable absorption (SA).Reference Rudresha, Bhat, Ramakrishna, Anthony, Lee and Rotermund25 It is clear that by adding SiO2 and Al2O3 NPs into the polymer matrix, the amount of β decreased but the amount of linear absorption (α) increased. By controlling the optimal ratio of SiO2 and Al2O3 in PUOC, the synthesized samples can be suggested as promising and helpful candidates for application in real optical systems; especially optical limiting materials. Accordingly, by controlling the amount of NPs, the nonlinear coefficients of the samples can be adjusted. All the results of NLA are calculated and displayed in Table II.
Up to now, there have been few reports for investigation of NLO properties of PU nanocomposites. Wang et al. measured a self-defocusing refraction effect with the NLA coefficient and the NLR coefficient of ≈53 × 10−9 cm/W and ≈2.8 × 10⁻¹² cm2/W for the 0.6% PU/MWNT film sample, which is excited by the nanosecond laser pulse (pulse duration of 8 ns) at 532 nm, respectively.Reference Wang, Fan, Chen, Gu and Wang26 Their results indicated that the strong scattering induced by the relatively high MWNT concentration leads to enhancement of the OA and CA Z-scan traces. It is clear that both NLR and NLA for PU/MWNT are smaller than the corresponding values for PU/Al2O3 and PU/SiO2 nanocomposites.
IV. CONCLUSION
PUOC hybrids were prepared by an in situ polymerization method with SiO2 and Al2O3 NPs at the loading fractions from 0.0 wt% to 2.0 wt% NPs. The third-order optical nonlinearities of PUOC/SiO2 and PUOC/Al2O3 nanocomposites dissolved in DMF are characterized by Z-scan technique with a CW Nd:YAG laser at its second harmonic frequency of 532 nm as the light source. The effects of the interaction between NPs as fillers and the blank PUOC on linear and nonlinear optical properties of PUOC nanocomposites were investigated by FTIR spectra. According to the results obtained, it can be concluded that the synthesized samples are promising candidates for future optical device applications. The following results can be pointed:
(1) By evaluating SEM micrographs of the synthesized foams, it is observed that the blank PUOC has different manner in front of SiO2 and Al2O3 NPs. As a whole, by adding NPs from 0.0 wt% to 1.0 wt% into the PUOC matrix, the cell and window sizes of the samples nearly decreased. This decrease causes increasing porosity. Porosity is a crucial factor for absorbing energy and being good insulator in around environment. However, by increasing the SiO2 and Al2O3 NP contents from 1.0 wt% to 2.0 wt% in the PUOC matrix, the cell and window sizes of the synthesized samples were increased and decreased, respectively.
(2) The NLR index of the samples was obtained from CA Z-scan in the order of 10−8 (cm2/W) with negative sign. By adding NPs up to 1.0 wt% into the polymer, the NLR index increased. However, a decrease in the NLR index in the samples with 1.0 wt% to 2.0 wt% was evident.
(3) The NLA coefficients of the samples were obtained from OA Z-scan in the order of 10−5 (cm/W) with positive sign. By adding NPs into the polymer matrix, the amount of β increased. However, by increasing the amount of NPs from 1.0 wt% to 2.0 wt%, the value of β decreased gradually. The origin of β is the presence of strong SA effect.