Implications
Genomic selection is the method of choice for genetic evaluations of dairy cattle in most countries. However, the cost of acquiring a genotype on a high-density panel is prohibitively expensive for individual farmers, thereby limiting the uptake of this technology on-farm. This study shows that the cost of implementing genomic selection can be reduced by genotyping using a low-density panel of markers and predicting or ‘imputing’ to a higher density panel. There was little reduction in accuracy of genomic prediction by using the imputed higher density marker panel.
Introduction
Genomic selection (Meuwissen et al., Reference Meuwissen, Hayes and Goddard2001) is increasing in popularity as a method to evaluate the genetic merit of animals (VanRaden, Reference VanRaden2008; Harris and Johnson, Reference Harris and Johnson2010). Accuracy of prediction of direct genomic values (DGVs) is a function of, amongst others, the quantity of phenotyped and genotyped individuals used to estimate marker effects (Daetwyler et al., Reference Daetwyler, Villanueva and Woolliams2008). Furthermore, genome-wide association analyses, utilising population-wide linkage disequilibrium among densely positioned genetic markers across the genome, are being increasingly used to attempt to detect regions of the genome associated with performance (Pryce et al., Reference Pryce, Bolormaa, Chamberlain, Bowman, Savin, Goddard and Hayes2010). Large data sets of phenotyped and densely genotyped individuals are also required for successful genome-wide association studies (Purcell et al., Reference Purcell, Cherny and Sham2003), particularly for traits governed by a large number of quantitative trait loci (QTL).
Marker panels are, and will continue to be developed with varying numbers of markers. Using imputation, it may be possible to combine data from different marker panels by imputing missing genotypes across panels with the outcome of a complete set of markers across all individuals (Nothnagel et al., Reference Nothnagel, Ellinghaus, Schreiber, Krawczak and Franke2009; Druet et al., Reference Druet, Schrooten and de Roos2010). Furthermore, the current cost of genotyping sufficiently large numbers of individuals for the accurate estimation of single nucleotide polymorphism (SNP) effects within either genomic selection breeding programmes or genome-wide association studies, can be expensive. This is especially true for individual farmers who want to exploit genomic selection on-farm as part of their own breeding programme. Although genomic prediction using reduced marker panels yield high accuracy of prediction relative to high-density panels (Weigel et al., Reference Weigel, de los Campos, González-Recio, Naya, Wu, Long, Rosa and Gianola2009) these reduced panels may be trait and breed specific. An alternative is to predict or impute SNPs on a high-density panel, which are not on a lower density panel. However, few studies have investigated the accuracy of imputation from low- to high-density genotype platforms using real life cattle populations (Zhang and Druet, Reference Zhang and Druet2010; Weigel et al., Reference Weigel, van Tassell, O'Connell, VanRaden and Wiggans2010a) or the impact on the prediction of DGVs (Weigel et al., Reference Weigel, de los Campos, Vazquez, Rosa, Gianola and Van Tassell2010b).
The objective, therefore, of this study was to evaluate the accuracy of imputing genotypes of animals from the currently available low-density marker panel marketed by Illumina referred to here as the Bovine3K (Illumina, San Diego, CA, USA), to the commonly used (Harris and Johnson, Reference Harris and Johnson2010; Pryce et al., Reference Pryce, Bolormaa, Chamberlain, Bowman, Savin, Goddard and Hayes2010) BovineSNP50 beadchip also marketed by Illumina (Matukumalli et al., Reference Matukumalli, Lawley, Schnabel, Taylor, Allan, Heaton, O'Connell, Moore, Smith, Sonstegard and Van Tassell2009) and referred to as the Bovine50K in this study. The impact of imputation on genomic predictions will also be evaluated. The results from this study will be useful in evaluating the potential of reducing the cost of genomic selection by using a lower cost, lower density marker panel, coupled with imputation.
Material and methods
Data
Genotypes on 5489 Holstein–Friesian artificially inseminated (AI) bulls (n = 4318) and cows (n = 1171) using the Bovine50K marker panel (Illumina; Matukumalli et al., Reference Matukumalli, Lawley, Schnabel, Taylor, Allan, Heaton, O'Connell, Moore, Smith, Sonstegard and Van Tassell2009) were available. All animals had genotypes called for at least 95% of the 54 001 SNPs on the Bovine50K. No animal had >0.5% Mendelian inconsistencies with either its parental or offspring genotype(s); 85.6% of the genotyped animals had either a parent or an offspring genotyped. Remaining inconsistent parent–offspring genotypes were set to missing.
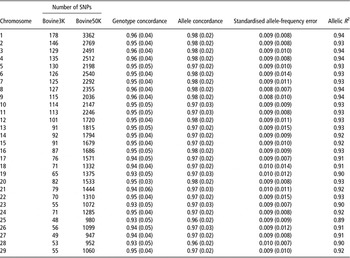
Chromosome number and positions of the SNPs on the Bovine50K were obtained from the UMD3.0 bovine genome assembly from the University of Maryland. Of the original 54 001 SNPs on the Bovine50K, all SNPs on the sex chromosomes (n = 1082) as well as SNPs of unknown location (n = 1065) were discarded; one of a further 24 SNPs that appeared twice on the Bovine50K panel were also discarded. In addtion, a further 228 SNPs that showed >0.5% Mendelian inconsistencies between parent–progeny pairs were discarded. A total of 51 602 SNPs remained. The number of SNPs per chromosome is summarised in Table 1.
Number of SNPs per chromosome in the low-density panel (Bovine3K) and high-density panel (Bovine50K) as well as the four measures of imputation accuracy evaluated

SNPs = single nucleotide polymorphisms.
The Bovine3K SNP panel contains 2900 SNPs. Only SNPs on the autosomes were retained (n = 2731) and one SNP, of unknown position was also discarded leaving 2730 SNPs. The number of SNPs per chromosome are summarised in Table 1. Across chromosomes, 4.7% Bos taurus autosome (BTA19) to 5.9% (BTA5) of the SNPs on the Bovine50K panel were on the low density Bovine3K panel (Table 1).
Animals were separated into two groups: (i) reference group of animals born before 2006 (n = 4725) and (ii) a test group of animals >50% Holstein, born from 2006 onwards (n = 764). Mean (s.d.) Holstein proportion of the animals in the reference group and test group was 78% (30%) and 85% (15%), respectively. Only the 2730 SNPs from the Bovine3K (after editing) were retained in the test group of animals with the remaining SNPs on the Bovine50K in these animals to be imputed.
Imputation
Imputation was undertaken for each chromosome separately using the freely available software Beagle version 3.1.0 (http://faculty.washington.edu/browning/beagle/beagle.html; Browning and Browning, Reference Browning and Browning2007 and Reference Browning and Browning2009). Beagle is written in Java and includes algorithms for haplotype and missing-data inference, single marker and multilocus association analysis, as well as permutation testing. Beagle uses a localised haplotype-cluster model, which defines a Hidden Markov model that can be subsequently used to infer haplotypes or impute missing genotypes for each animal conditional on that animal's genotype. Beagle also provides posterior probabilities for each imputed haplotype, which reflects the degree of uncertainty in the imputed genotype. Beagle can handle phased or unphased genotypes as well as genotypes from unrelated animals, parent–offspring pairs or parent–offspring trios. In this study, direct knowledge of the parental genotypes was exploited in the imputing process. The methodology used in Beagle is described in more detail by Browning and Browning (Reference Browning and Browning2007).
Genomic prediction
To quantify the impact of imputation on the estimation of DGVs in the imputed animals, genomic prediction using BLUP (VanRaden, Reference VanRaden2008) was undertaken for all traits included in the Irish total merit index, the economic breeding index (EBI; Table 2; Berry et al., Reference Berry, Shalloo, Cromie, Olori, Veerkamp, Dillon, Amer, Evans, Kearney and Wickham2007). Of the 51 602 SNPs remaining, following the editing previously described, a further 7210 were removed because they had a minor allele frequency (MAF) of ⩽0.02. An additional 2409 SNPs were removed because they had a call rate of ⩽0.95 and 374 SNPs were removed because they deviated (P < 0.1 × 10⁻⁷) from Hardy–Weinberg equilibrium. A total of 41 609 SNPs were therefore included in the genomic prediction. SNP effects were estimated in the reference animals and these SNP effects were applied to either the real genotypes or the imputed genotypes of the test group animals to estimate their DGVs.
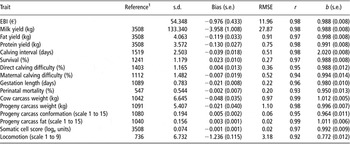
Number of animals included in the reference population for the estimation of SNP effects (Reference), s.d. of the DGVs in the test group of animals when using the real genotypes, as well as the summary statistics from comparing the DGVs using the real or imputed genotypes including the mean bias (Bias), the RMSE of the bias and, both the correlation (r) and regression (b) of the DGVs estimated using the real genotypes on the DGVs estimated using the imputed genotypes

SNPs = single nucleotide polymorphisms; DGVs = direct genomic values; RMSE = root mean square error; EBI = economic breeding index.
1Number of training animals not included for the EBI as this was the weighted sum of the individual traits and was not estimated directly by using genomic prediction.
The phenotypes of the reference animals used in the genomic prediction were, where available, based on deregressed estimated breeding values from multiple-across country evaluation (MACE) evaluations from the August 2010 genetic evaluation run; if MACE evaluations were not available then deregressed breeding values from the August 2010 national evaluation were used. Animals included in the estimation of SNP effects were born before 2006 and had to have a reliability, less parental contribution, for the respective trait under investigation of ⩾60%. Animals with imputed genotypes were not considered for the estimation of SNP effects. The number of animals used for the estimation of SNP effects are detailed in Table 2 for the different traits; the test-group of animals for which the DGVs were estimated was always 764.
Summary statistics on the accuracy of imputation
Several statistics were calculated to compare the accuracy of imputation in the test group of animals: (i) genotype concordance rate defined as the average proportion of correctly imputed genotypes within SNP or within animal, (ii) allele concordance rate defined as the average proportion of correctly imputed alleles within SNP or within animal; in this instance, a genotype imputed to be heterozygote but was truly homozygote was assumed to have one correct allele imputed, (iii) allelic R 2 defined as the squared correlation between the allele dosage of the most likely imputed genotype and the allele dosage of the real genotype and (iv) the standardised allele-frequency error (Browning and Browning, Reference Browning and Browning2009). The standardised allele-frequency error was defined as:

where p A is the real allele frequency in the sample of n animals and q A is the estimated frequency of the same allele from the most likely imputed genotypes. This statistic standardises the allele frequency error for the allele frequency and sample population size.
The impact of imputation on genomic predictions was quantified by calculating the mean and standard deviation of the bias between DGVs estimated using the real or imputed genotypes in the test group of animal as well as the correlation and regression of the DGVs estimated using the real genotypes on the DGVs estimated using the imputed genotypes in the test group of animal. The imputed genotypes used in the analysis were either the most likely genotypes or the posterior probabilities of each genotype.
Results
Across all chromosomes and animals, the mean (s.d. in parenthesis) genotype and allele concordance rate was 0.950 (0.044) and 0.974 (0.023), respectively. However, across chromosomes the mean genotype concordance rate varied from 0.930 to 0.959 (Table 1), whereas the mean allele concordance rate varied from 0.964 to 0.979 (Table 1). The standardised allele-frequency error varied from 0.008 to 0.010 per chromosome, whereas the allelic R 2 values varied from 0.892 to 0.942 (Table 1). There was only a slight reduction in genotype and allele concordance rate of 0.007 and 0.003, respectively when only the 38 980 of the 41 609 SNPs included in the genomic prediction but not on the Bovine3K panel were compared; 101 of the SNPs on the Bovine3K were discarded in the editing of the SNPs for genomic selection based on MAF (n = 27, one of which was monomorphic), deviation from Hardy–Weinberg equilibrium (n = 21) and poor call rates (n = 53). A weak but significant negative correlation existed between average genotype and allele concordance rate per SNP and the respective MAF (r = −0.05; P < 0.001) suggesting that the accuracy of imputation increased slightly as MAF reduced.
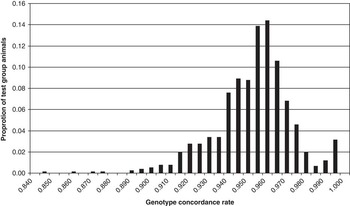
Mean genotype concordance rate per animal varied from 0.843 to 0.994 but was negatively skewed (Figure 1); 98% of animals had a genotype concordance rate of ⩾0.900, 57% had a genotype concordance rate of ⩾0.950 and 3% had a genotype concordance rate of ⩾0.990. Mean allele concordance rate per animal varied from 0.917 to 0.996 and was also negatively skewed; 97.6% had a genotype concordance rate of ⩾0.950 and 4.8% had a genotype concordance rate of ⩾0.990. Allelic R 2 varied from 0.760 to 1.00 per animal; the mean allelic R 2 was 0.93.
Distribution of individual animal genotype concordance rate between real and imputed genotypes for all animals in the test group.

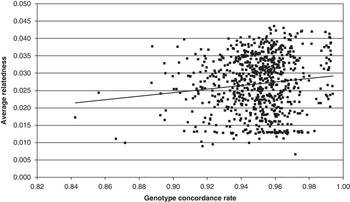
The average relatedness between animals in the test group and animals in the reference group was 2.7%; the average relatedness among the test group of animals was 4.2% and among the reference group of animals was 2.3%. The relationship between mean genotype concordance rate per animal and average relatedness of the animal to the reference population is illustrated in Figure 2. A positive correlation of 0.13 (P < 0.001) existed between animal mean genotype concordance rate and average relatedness to the reference population estimated using pedigree information; the correlation was 0.44 (P < 0.001) when the average relatedness to the reference population was replaced by the maximum relatedness to the reference population. The mean (s.d. in parenthesis) genotype concordance rate per animal, for animals with no parent in the reference population (n = 98), only one parent in the reference population (n = 632) or both parents in the reference population (n = 34) was 0.927 (0.022), 0.952 (0.015) and 0.991 (0.002), respectively; the respective statistics for the allele concordance rate was 0.962 (0.012), 0.975 (0.008) and 0.995 (0.001).
Association (r = 0.13) between average genotype concordance rate per animal in the test group and average relatedness to the reference population.

Impact of imputation on genomic prediction
The number of animals included in the reference population for the estimation of SNP effects as well as the summary statistics comparing the DGVs of the 764 test group estimates using real or imputed genotypes is detailed in Table 2. Slightly better concordance, in the population as a whole, was observed when the posterior genotype probabilities were used instead of the most likely genotype for the test group animals, especially in animals with no parent in the reference population; on average the correlation with the DGVs estimated using the real genotypes increased by 0.004 when the posterior genotype probabilities were used instead of the most likely genotypes and therefore it is the results using the former that are presented in Table 2.
The differences among traits in number of animals included in the reference population for the estimation of SNP effects is a function of the heritability of the traits, which is reflected in the number of sires reaching the reliability threshold imposed, as well as whether or not international genetic evaluations are available for the trait under investigation.
DGVs estimated using the imputed genotypes were overestimated (P < 0.05) compared with when the real genotypes were used for all three yield traits, calving interval, gestation length and locomotion; underestimation (P < 0.05) was evident for survival as well as both carcass conformation and carcass fat score. The Irish total merit index, the EBI (Berry et al., Reference Berry, Shalloo, Cromie, Olori, Veerkamp, Dillon, Amer, Evans, Kearney and Wickham2007), was also overestimated (P < 0.05; Table 2). The differences between the DGVs predicted using the real or imputed genotypes were normally distributed for each trait. The s.d. of the difference between the DGVs predicted using either the real or imputed genotypes varied from 0.13 (progeny carcass fat score) to 0.47 (locomotion) of the s.d. of the DGVs of the 746 test group animals when estimated using their real genotypes.
The correlation between the DGVs of the test group animals when their real or imputed genotypes were used in the genomic prediction varied from 0.92 (locomotion) to 0.99 (cow carcass weight and progeny carcass fat). The correlation between the EBI estimated from the weighted sum of the individual DGVs predicted using the real or imputed genotypes was 0.97. With the exception of locomotion, the regression of the DGVs of the test group of animals estimated using the real genotypes on the DGVs estimated using the imputed genotypes were close to unity and only differed (P < 0.05) from unity for perinatal mortality, progeny carcass conformation and fat score, and locomotion.
Discussion
The motivation for this study was to quantify the accuracy of imputation from a commercially available low-density SNP marker panel to higher density SNP marker panel with the objective that, if successful, reducing the cost of genomic predictions. The results clearly show that, on average, high accuracy of imputation can be achieved, especially where the pedigree of an animal has been genotyped on the Bovine 50K and is included in the reference group. It should be noted, however, that the accuracy of imputation is likely to be biased downwards slightly as genotyping errors in the ‘real’ genotypes to which the imputed genotypes were compared, may exist, although the impact is likely to be small. Furthermore, incorrect genome positioning of some SNPs may also affect the accuracy of haplotyping and therefore imputation.
Imputation accuracy
The accuracy of imputing the unobserved, approximately 95% of the SNPs on the higher density panel was, on average, high although variation among animals did exist corroborating the large variation in imputation accuracy per animal also reported by Weigel et al. (Reference Weigel, van Tassell, O'Connell, VanRaden and Wiggans2010a). Furthermore, the high allelic R 2 indicates little loss in statistical power for association studies by using the most likely imputed genotype compared with, if the real genotype was used.
Several studies have evaluated the accuracy of imputation in human populations (Browning and Browning, Reference Browning and Browning2007; Hao et al., Reference Hao, Chudin, McElwee and Schadt2009), some of which also compared different software packages available for imputation (Howie et al., Reference Howie, Donnelly and Marchini2009; Nothnagel et al., Reference Nothnagel, Ellinghaus, Schreiber, Krawczak and Franke2009). However, few studies have attempted to quantify the accuracy of imputation from lower to higher density panel in real life cattle populations (Druet and Georges, Reference Druet and Georges2010; Weigel et al., Reference Weigel, van Tassell, O'Connell, VanRaden and Wiggans2010a; Zhang and Druet, Reference Zhang and Druet2010) or between different marker panels in cattle (Druet et al., Reference Druet, Schrooten and de Roos2010). Studies using simulated cattle populations have also been undertaken (Habier et al., Reference Habier, Fernando and Dekkers2009). Allele concordance rate was evaluated in this study as well as genotype concordance rate because genomic selection in Ireland (Berry et al., Reference Berry, Kearney and Harris2009) currently uses SNP effects based on the number of copies of a given allele.
Weigel et al. (Reference Weigel, van Tassell, O'Connell, VanRaden and Wiggans2010a) using a reference panel of 43 385 SNPs on 2542 Jersey cattle evaluated two freely available software packages for imputation (i.e. fastPHASE and IMPUTE). The test population in the study of Weigel et al. (Reference Weigel, van Tassell, O'Connell, VanRaden and Wiggans2010a), which is comparable with how the test group of animals were generated in this study, was the ‘future study sample’ and consisted of 604 Jersey cattle. When only 5% (i.e. similar to the 5.3% average in this study) of the 43 385 SNP genotypes in the reference population of Weigel et al. (Reference Weigel, van Tassell, O'Connell, VanRaden and Wiggans2010a) were known in the test population, the genotype concordance rate varied from 0.77 to 0.88 for BTA1 depending on the approach used; similar results were reported for BTA15 and BTA28, which were the only other two chromosomes investigated in that study. In this study, the accuracy of imputation, even after the removal of SNPs with low MAF and poor call rate as undertaken by Weigel et al. (Reference Weigel, van Tassell, O'Connell, VanRaden and Wiggans2010a), was higher.
Zhang and Druet (Reference Zhang and Druet2010) using a panel of 3000 SNPs chosen based on a combination of equal distribution across the genome and high MAF, reported an allelic imputation error rate (identical to one minus the allele concordance rate reported in this study) of approximately 0.03 for 2734 Dutch Holstein bulls using a reference population of 1000 Dutch Holstein bulls. This is similar to the allele concordance rate reported in this study.
A contributing factor to the increased accuracy of imputation in this study over the accuracy reported by Weigel et al. (Reference Weigel, van Tassell, O'Connell, VanRaden and Wiggans2010a) could be the larger size of the reference population in this study (4725 v. 2542), which has been shown to improve the accuracy of imputation, for some imputing algorithms at least, in both cattle (Zhang and Druet, Reference Zhang and Druet2010; Weigel et al., Reference Weigel, de los Campos, Vazquez, Rosa, Gianola and Van Tassell2010b) and human populations (Browning and Browning, Reference Browning and Browning2009). However, Zhang and Druet (Reference Zhang and Druet2010) reported little benefit in accuracy of imputation, based on the algorithms they used, for reference population sizes >1000 individuals. Another reason for the difference in imputation accuracy compared with that of Weigel et al. (Reference Weigel, van Tassell, O'Connell, VanRaden and Wiggans2010a) was that Weigel et al. (Reference Weigel, van Tassell, O'Connell, VanRaden and Wiggans2010a) included a random selection of SNPs in the lower density panel, whereas SNPs on the Bovine3K were selected so as to achieve an even distribution of polymorphic SNPs across the bovine genome, much like the approach adopted by Zhang and Druet (Reference Zhang and Druet2010). Other reasons for the differences between studies include differences in software (i.e. algorithms) used as well as other possible factors including population structure differences such as linkage disequilibrium within the breed/population under investigation as well as the relatedness between the reference and test group population, which is known to influence imputation accuracy (Figure 2; Zhang and Druet, Reference Zhang and Druet2010).
No description of the average relatedness of the test group evaluated by Weigel et al. (Reference Weigel, van Tassell, O'Connell, VanRaden and Wiggans2010a) with the reference population was presented, although 595 sires and 580 maternal grandsires of the 604 animals in the test group were genotyped for the higher density marker panel and included in the reference population. Nonetheless, Weigel et al. (Reference Weigel, van Tassell, O'Connell, VanRaden and Wiggans2010a) reported no difference in imputation accuracy in animals that had progeny or pedigree genotyped compared with having no such information. Druet et al. (Reference Druet, Schrooten and de Roos2010) and Zhang and Druet (Reference Zhang and Druet2010) using both linkage disequilibrium and linkage analysis in different, although overlapping data sets, also clearly showed an increased accuracy of imputation when the animals to be imputed were more closely related to the reference population. Therefore, to maximise confidence in the imputation of genotypes, high-density genotypes of the pedigree of the animal should be included in the reference population.
Effect on genomic prediction
Higher accuracies of genomic predictions were obtained when the posterior probability of an imputed genotype was used rather than the most likely genotype, which is not unexpected as the use of the posterior probability accounts for the uncertainty of the imputation. Although several studies in human genetics have evaluated the impact of imputation on the power of genome-wide association studies (Marchini et al., Reference Marchini, Howie, Myers, McVean and Donnelly2007; Servin and Stephens, Reference Servin and Stephens2007; Hao et al., Reference Hao, Chudin, McElwee and Schadt2009), we are aware of only one recent study (Weigel et al., Reference Weigel, de los Campos, Vazquez, Rosa, Gianola and Van Tassell2010b), which has quantified the impact of imputation of genotypes on genomic predictions using real data in cattle. In the present study, the accuracy of genomic predictions from imputed genotypes were compared with DGVs derived from real genotypes rather than comparing with predicted transmitting abilities from traditional genetic evaluations as a large proportion of the animals in the test group were cows or young test sire that had no phenotypic information and therefore were not of high reliability based on traditional genetic evaluations.
Weigel et al. (Reference Weigel, de los Campos, Vazquez, Rosa, Gianola and Van Tassell2010b) using a reference population of 1446 Jersey AI sires for milk yield, protein percentage and daughter pregnancy rate, genotyped on the Bovine50K panel reported that the predictive ability of DGVs using 2942 SNPs (i.e. similar to this study) coupled with imputation, was approximately 97% of that of when using the real genotypes; SNP effects in that study were estimated using a Bayesian approach. This conclusion is similar to the mean correlation (0.97) in the present study between DGVs estimated using the Bovine3K panel and the DGVs predicted using the Bovine50K panel. The lower correlations between DGVs predicted using real or imputed genotypes evident for some traits in this study appear to be related to the number of animals included in the reference population for the estimation of SNP effects. The exceptions were direct and maternal calving difficulty, which had relatively weak correlations between the DGVs estimated using real or imputed genotypes (0.94 to 0.95) despite relatively large training populations sizes (1112 to 1403 animals) for the estimation of SNP effects. One possible contributing factor could be the contribution of large QTLs to these phenotypes and the accuracy of imputation may be poor in these genomic regions. Cole et al. (Reference Cole, VanRaden, O'Connell, Van Tassell, Sonstegard, Schnabel, Taylor and Wiggans2009) reported a region of BTA18 in Holstein cattle to have a large association with genetic merit for direct and maternal calving ease using SNPs from the Bovine50K panel.
Weigel et al. (Reference Weigel, de los Campos, Vazquez, Rosa, Gianola and Van Tassell2010b) did not report any other statistics comparing the DGVs estimated using high- and low-density marker panels but the results from this study suggest little mean difference in DGVs generated from the two methods and that a unit change in the DGVs estimated using the real genotypes was associated with a near unity change in DGV estimated using the imputed genotypes. Furthermore, where bias in the mean did exist it was neither a systematic underestimation nor overestimation of the DGVs, which has important ramifications for the ranking of animals using different genotype platforms. The bias in the total merit index, although statistically significant, is biologically insignificant.
In conclusion, the cost of genomic selection can be considerably reduced by genotyping on the Bovine3K and, through the use of imputation algorithms, obtain in silico genotypes on the Bovine50K. However, key to accurate imputation is knowledge of the high-density genotypes of the pedigree of the animal being imputed. Lowering the costs of genomic selection will increase its uptake, especially by farmers. This will, over time, increase the size of the reference population for the estimation of SNP effects, thereby increasing the accuracy of prediction and subsequently genetic gain.
Acknowledgements
Useful discussions with Brian Browning on the implementation of the Beagle software are gratefully acknowledged. Genotypes made available through sharing with international partners as well as funding from national (RSF-06-0353; RSF-06-0428) and European Union Framework 7 funding (http://www.robustmilk.eu) are also gratefully acknowledged.