Health care providers (HCPs) often acquire endemic and epidemic seasonal infectious diseases resulting from exposures at work in the health care setting and from exposures in the community. It has been shown that HCPs may serve as an important vehicle for the spread of influenza to other HCPs and patients.Reference Poalillo, Geiling and Jimenez1Reference Salgado, Farr, Hall and Hayden2 The magnitude of this hazard during seasonal or pandemic influenza remains poorly defined. It has been clearly demonstrated that HCPs are at high risk for influenza infection. In a study performed in the United Kingdom using serological testing to diagnose influenza infection, 20% to 27% of HCPs contracted influenza during community outbreaks in the 1993-1994 epidemic before vaccination of HCPs became widely recommended.Reference Elder, O’Donnell, McCruden, Symington and Carman3 More recently, during the first wave of the novel influenza A (H1N1) pandemic, in spring 2009, 50% of H1N1 influenza infection among HCPs was shown to have been acquired in the workplace.4 Additional evidence suggests that a large proportion of HCPs with influenza-like illnesses continue to work, posing a risk to both patients and other HCPs.Reference Rosvold and Bjertness5Reference Lester, McGeer, Tomlinson and Detsky6Reference Turnberg, Daniell and Duchin7
Absenteeism of HCPs remains an important but incompletely understood area of disaster medicine.Reference Abramson, Morse, Garrett and Redlener8 A growing body of literature suggests that HCPs are frequently unwilling to report for duty during a pandemic.Reference Chaffee9Reference Irvin, Cindrich, Patterson and Southall10Reference Damery, Wilson and Draper11Reference Mackler, Wilkerson and Cinti12 Reluctance to work represents an additional hazard to staffing adequacy in emergency planning and response efforts. Results from recent surveys of first responders, health care personnel, and public health staff indicate that absenteeism rates of HCPs during a pandemic could range from 50% to 85%.Reference Irvin, Cindrich, Patterson and Southall10Reference Damery, Wilson and Draper11Reference Mackler, Wilkerson and Cinti12Reference Santos, Bristow and Vorenkamp13 This was the experience in many health care facilities directly affected by the severe acute respiratory syndrome (SARS) outbreak,Reference Baumann, Blythe and Underwood14Reference Maunder, Hunter and Vincent15 and a report from the H1N1 influenza pandemic indicated a 3.6-fold increase in staff sick calls at the peak of the epidemic.Reference Murray, Grant, Bryce, Chilton and Forrester16 Both inability and unwillingness to work may cause serious service disruption during a pandemic.
Although the growing body of research on willingness to work in a disaster is useful, this knowledge cannot directly predict events and behaviors during pandemics.Reference Garrett, Park and Redlener17 Hanfling and Hick suggest the need for a mechanism to recognize real-time or near-real-time requirements for the transition of patient and staff management from a conventional strategy to a surge strategy.Reference Hanfling and Hick18 Indicators that are likely to help guide this transition include measures such as hospital patient census, staffing availability, staff–patient ratios, critical resource availability (eg, ventilators), and measures of disease burden in the community.Reference Hanfling and Hick18
The objectives of this study were to present a method by which to monitor sick leave use in near real time within a large health care system during the H1N1 influenza pandemic and to assess, using time series analysis, whether the pandemic had a significant effect on sick leave use.
METHODS
The Veterans Health Administration (VHA) is an integrated health care–delivery system with 246 800 full-time equivalent (FTE) staff at the beginning and approximately 257 500 FTE at the end of 2009, working in 153 hospitals, 958 outpatient clinics, and 133 community living centers. In addition, VHA is organized in 21 regional business units, known as Veterans Integrated Service Networks. VHA is the health care arm of the Department of Veterans Affairs and follows federal sick leave rules and usage policies determined by the Office of Personnel Management.19 During the 2009 pandemic, VA and VHA leadership instructed sick employees to stay home.
Aggregate sick leave use for all full- and part-time VHA paid employees was determined for each 2-week pay period (80 hours) between January 2004 and December 2009. Sick leave use was defined as the total sick leave hours taken during a 2-week pay period divided by the total number of FTE. In addition, absolute hours of sick leave were examined to determine the proportion of use during peak pandemic periods to calculate estimates of excess attributable risk and economic burden resulting from work loss. Economic burden because of work loss was calculated by multiplying excess hours (over 2004-2008 average use) during 3 peak pandemic pay periods by an average hourly wage rate of $38.39.20
Sick leave use by pay period during 2009 was compared with sick leave use per pay period in 2004-2008 to determine whether trends during 2009, specifically during the first 2 waves of the H1N1 influenza pandemic, differed significantly from use in previous years. Pandemic waves were defined as the periods when the weighted proportion of HCP visits for influenza-like illnesses was ≥2.2% using data from the US Outpatient Influenza-like Illness Surveillance Network (Centers for Disease Control and Prevention, Atlanta, GA).21 Using this criterion, the first wave of the H1N1 influenza pandemic was defined as beginning April 19, 2009, and ending May 2, 2009. This corresponded with VHA pay periods 8 (April 12-April 25, 2009) and 9 (April 26-May 9, 2009). The second wave of the pandemic was August 23, 2009, through January 2, 2010, and these dates corresponded with pay periods 18 (August 30-September 12, 2009) through 26 (December 20, 2009-January 2, 2010).
To determine the relations between sick leave use and evolution of the 2009 H1N1 influenza pandemic among clinical (physicians, nurses, and other allied health care professionals) and nonclinical staff in VHA, the ratio of sick leave use between clinical and nonclinical staff was calculated and plotted. The measure used was a ratio of ratios and was calculated as ([sick leave hours per FTE per pay period in 2009 for clinical staff/average sick leave hours per FTE per pay period in 2004-2008 for clinical staff] /[sick leave hours per FTE per pay period in 2009 for nonclinical staff/average sick leave hours per FTE per pay period in 2004-2008 for nonclinical staff]). Analysis of variance (ANOVA) was used to test for differences in the ratios of sick leave use between clinical and nonclinical staff.
Because a time series may exhibit systematic variation in the form of trend, seasonal variation, cyclical variation, and the effect of events, including illness, autoregressive integrated moving average (ARIMA) models were used to allow the identification of and model various components potentially contributing variation to the time series and determine the type and significance of the event.Reference Box, Jenkins and Reinsel22 In the present analysis, we hypothesized that the H1N1 influenza pandemic would have a temporary effect on employee sick leave use and included a pulse variable in the model to represent this effect on the time series for 1 time interval.
An ARIMA (1,1,1) (0,1,1)12 model was selected to investigate the sick leave time series data. The model included the following terms: 1 autoregressive term to account for the correlation between any given month's proportion of sick leave usage and the previous month's proportion, plus error; a first difference term to account for the linear trend in the time series and any seasonal difference; a moving average term to account for correlation between the current and previous month's error terms and an additional moving average term to offset the seasonal difference; and an event variable modeled as a pulse (temporary effect) in October 2009. ARIMA models were conducted using proc arima in SAS 9.2 (SAS Institute Inc, Cary, NC).
RESULTS
Between 2004 and 2008, the average number of sick leave hours used per 2-week pay period per FTE was 3.28 hours (standard deviation 0.43 hours) with a range between 1.54 and 4.67 hours in any given pay period. During 2009, the average number of sick leave hours used per FTE was within this historical range.
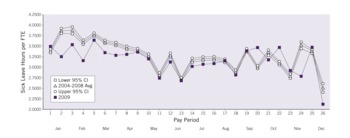
During the first wave of the H1N1 influenza pandemic there was no significant difference in the average number of sick leave hours used per FTE in 2009 compared with the same time periods from 2004 through 2008 (Figure 1). In the second wave, the average number of sick leave hours used per FTE increased in pay periods 20 (September 27-October 10, 2009) and 22 (October 25-November 7, 2009) compared with the historical data (3.46 hours per FTE in pay period 20 in 2009 vs 3.00 in 2004-2008; 3.46 in pay period 22 vs 3.09 in 2004-2008).
Veterans Health Administration employee sick leave usage per full-time equivalent (FTE) by pay period, 2004-2009.

CI, confidence interval.
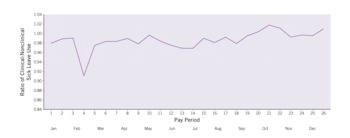
Examination of the ratio of ratios between clinical and nonclinical staff sick leave use showed that nonclinical staff used sick leave at a consistently greater rate than clinical staff during the 2004-2008 baseline period and during the nonwave periods of the 2009 pandemic (Figure 2). During the second pandemic wave, however, the ratio of ratios of clinical to nonclinical staff sick leave use changed directions because clinical staff were using relatively more sick leave than were nonclinical staff for 3 successive 2-week pay periods, 20 to 22 (September 27-November 7, 2009), compared with their respective 2004-2008 baseline period. Clinical staff used 0.4%, 1.8%, and 1.1% more sick leave in these 3 pay periods, respectively. ANOVA results comparing the simple ratio measures between clinical staff and nonclinical staff during the second pandemic wave were not significant; however, comparing the ratio measures for each group in the nonwave vs second pandemic wave time period, ANOVA showed this difference to be significant (P = .002 for the clinical group, P = .008 for the nonclinical group).
Ratio of clinical to nonclinical sick leave use by pay period: 2009 compared with 2004-2008.

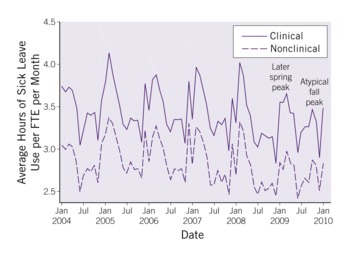
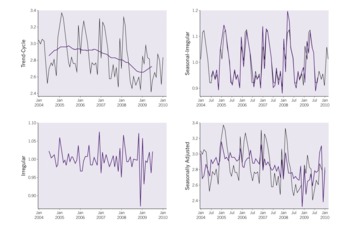
Overall, time series analysis revealed a decreasing linear trend in employee sick leave use (Figure 3). This feature of the time series is depicted in the decomposition plot (Figure 4, top left). The analysis also showed a clear seasonal component in sick leave use. Each year, sick leave use peaked each January, corresponding with patterns of typical seasonal influenza and other respiratory viruses, and then use decreased during the summer months (Figure 3). This feature of the time series is depicted in the decomposition plot (Figure 4, top right).
Sick leave use plotted as a time series, 2004-January 2010.

FTE, full-time equivalent.
Decomposition plots for clinical (top) and nonclinical (bottom) time series data.

Top left, Plot depicts trend component of time series. Top right, Removing trend, plot depicts seasonal component of data. Bottom left, Plot depicts irregular variation in the time series (not explained by trend or seasonality). Bottom right, Plot depicts time series adjusting for seasonal component in the data.
During 2009, however, the pattern of sick leave use differed from the 2004-2008 baseline, temporally related to the waves of the pandemic. A later peak in sick leave use was noted in the spring during April 12-April 25, 2009/pay periods 8 and 9 and a second atypical peak occurred in the autumn between September 27 and November 7, 2009/pay periods 20 to 22. These atypical peaks correspond to the first and second H1N1 influenza pandemic waves and are depicted as irregular variation (not explained by trend or seasonality) in the decomposition plot (Figure 4, bottom left). Modeled as a pulse, the pandemic at its peak in autumn 2009 had a significant, temporary effect on employee sick leave use. In the first month of the second pandemic wave, the average number of sick leave hours per FTE per month increased by 0.3904 (P = .003) for clinical staff and 0.3898 (P = .01) for nonclinical staff over the previous months (Figure 3).
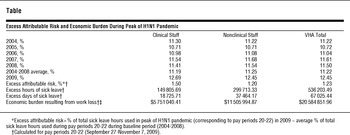
Finally, examination of the absolute hours of sick leave use during the 3 pay periods (20-22) corresponding to the peak of the H1N1 influenza pandemic indicated that 12.69% of the total amount of sick leave hours taken in 2009 by clinical staff occurred during those 3 pay periods compared with 12.45% for both nonclinical staff and VHA overall (Table). These proportions were higher than the proportion of hours taken during the same 3 pay periods for historical data (2004-2008 average use) and resulted in excess attributable risk in the range of 1.20% to 1.50%. Economic burden resulting from work loss in the second pandemic wave resulted in more than $20 million in work loss to VHA during the peak of the H1N1 influenza pandemic for the aggregate 67 025 days of sick leave taken in a 6-week period (Table).
Excess Attributable Risk and Economic Burden During Peak of H1N1 Pandemic

COMMENT
The VHA is the largest integrated health care system in the United States and provides care in all 50 states and in multiple US territories. The H1N1 pandemic was associated with a significant increase in employee sick leave use in the VHA and resulted in substantial economic burden resulting from work loss in a short period—$20 million in work loss for the aggregate 67 025 days of sick leave taken in a 6-week period. Although the increase in sick leave use was statistically significant at the peak of the pandemic and resulted in the noted work loss, no broad staffing issues related to the pandemic were recognized within VHA. Rather, we were able to show that clinical staff had a greater rate of sick leave use compared with nonclinical staff during the second but not the first wave of the H1N1 influenza pandemic, and that examination of sick leave data may provide a sensitive indicator of the impact of novel influenza illness. Our findings suggest that clinical staff may be at greater risk compared with non-clinical staff for illnesses that lead to sick leave; however, our study was not designed to measure whether infection caused by H1N1 influenza itself led to this difference. A 2010 study by Santos et al showed that physicians and other medical personnel had a higher influenza infection rate than did other types of employees and that clinical providers in the emergency department (ED) had the highest infection rate during the spring 2009 wave of the H1N1 influenza pandemic in a large hospital system in New York City.Reference Santos, Bristow and Vorenkamp13
The methods developed and presented in this article represent a means of conducting near-real-time syndromic surveillance that may prove useful in identifying and managing future influenza pandemics and other natural or human-made outbreaks of infection. In 2009, VHA had 257 500 FTE staff, provided health care services in all 50 states, and was the largest health care system in the United States. Monitoring patterns of sick leave use in a system this large, including the ratio between clinical and nonclinical staff sick leave use, may provide timely information to hospital administrators, public health officials, emergency responders, and others responsible for ensuring public safety. Syndromic surveillance systems were developed primarily in response to the anthrax attacks of 2001, but they are being applied more broadly to help determine the size, spread, and tempo of pandemics and other natural or human-made outbreaks of infection.Reference Henning23 These systems are typically characterized by use of automated procedures to capture near-real-time data on patient presentations or health indicators to identify anomalies that suggest an outbreak.Reference Bravata, McDonald and Smith24 Potential data sources for syndromic surveillance systems include many clinical sources such as ED or clinic total patient volume, total hospital or intensive care unit admissions from the ED, and ED visit outcome (diagnosis), but they also include alternative data sources such as school and work absenteeism, as presented here.Reference Henning23 Sick leave use surveillance among HCPs may be particularly useful for the early identification of pandemics, SARS-like events, or other natural or intentional outbreaks of contagious pathogens because HCPs are often exposed to potentially contagious patients. At present, pandemic severity is assessed only by case-fatality ratios, which reflect that although influenza is a significant cause of population mortality, only a small minority of infected people succumb to their illness. Even during the 2009 pandemic only 0.3% died of influenza. The surveillance mode described here adds a dimension that captures the economic consequences in a robust fashion and may prove to be a sensitive indicator of the severity of influenza and potential outbreaks of other transmissible infections.Reference Bravata, McDonald and Smith24
Syndromic surveillance data lend themselves to time series analysis, especially when data are collected at evenly spaced intervals so that ARIMA models can be employed. In the 2003 SARS outbreak, similar methods were used to predict and monitor hospital census in a Singapore tertiary hospital and to monitor the epidemic in China.Reference Earnest, Chen, Ng and Sin25Reference Lai26 The models developed in Singapore provided important information to administrators of the tertiary hospital on the number of isolation beds occupied by patients with SARS during the outbreak and allowed predictions of the number of isolation beds that would be required 3 days into the future.Reference Earnest, Chen, Ng and Sin25 The models developed in China were used to predict future cases of SARS in the country based on the daily probable new cases reported by the Ministry of Health.Reference Lai26 Controversy exists regarding the most appropriate analyses to conduct with data from syndromic surveillance systems in terms of what will be most useful for public health decision making,20 but these 2 examples and the results presented here illustrate the utility that time series analysis and models of syndromic surveillance data can provide.
One potential limitation of the analyses presented here is that they are based on aggregate data, which did not allow adjustment by individual employee characteristics; however, when monitoring sick leave use from a health care system perspective, aggregate measures appear most appropriate, are generally available, and lack the constraints associated with data containing protected health information. Another limitation was a 1-week lag in ascertaining sick leave use for VHA during the pandemic. This delay resulted from the process used for the aggregation of human resources data within VHA. This delay limits the utility of a syndromic surveillance system as a leading indicator of a pandemic or other event. Further development of the electronic systems may allow capture of data significantly earlier, however, and this is worthy of further exploration and study. Also, other types of leave, such as vacation and holiday leave, were excluded from the analyses. When examining historical trends of sick leave use, it is not unreasonable to look at patterns in any given year and attribute sick leave rates at particular times of the year to increased employee absence for vacations and holidays. We examined other types of leave data for VHA and found this to be the case, but these results did not affect the results of our analyses, likely because the 2 waves of the H1N1 pandemic did not occur during periods of typical vacation and/or holiday leave use (data not shown).
The use of sick leave is an imperfect measure of illness at the individual level because it can be used for reasons other than personal illness including appointments and caring for a family member. One aspect, especially during a pandemic, is that clinical staff may respond to the request to stay home when sick in a way that differs from nonclinical staff behaviors, driven by concerns about infecting patients. Again, our analyses focused on developing methods to monitor worker absenteeism across an entire health care system with the understanding that absences can result for a number of reasons with the same impact on the system. Finally, this study was not designed to incorporate the influence of employee influenza vaccination rates on sick leave usage. Differing vaccination uptake rates in clinical vs nonclinical staff could have affected the outcomes of our study; however, unlike many health care systems in the United States VHA has achieved a high vaccination uptake rate by all of its employees. The average self-reported rate of employee influenza vaccination in the 2009-2010 influenza season in VHA was 76.7%. The highest rates were reported by physicians (88.7%) and the lowest by nursing assistants (71.6%) and licensed practical nurses (70.8%; unpublished data). Self-reported rates of vaccination in nonclinical staff were between those of physicians and nursing assistants and licensed practical nurses and were close to the VHA average. Because vaccination rates were high overall among all employee types, it is unlikely that differing vaccination uptake rates affected the outcomes of our study.
CONCLUSIONS
The economic burden associated with the H1N1 pandemic resulting from increased sick leave and resulting work loss was substantial: During a 6-week period at the peak of the second wave of the pandemic, 67 025 days of sick leave were taken by VHA employees at a cost of approximately $20 million. Measures of sick leave use in a large health care system may represent a leading indicator of pandemic waves. Sick leave use monitored in near-real time using time series analysis techniques may be an important early indicator of pandemic severity with practical implications that should be considered in addition to the more traditional measures of influenza epidemic and pandemic severity.
Author Disclosures: The author reports no conflicts of interest.
Acknowledgment: The authors thank Dr Victoria Davey for reviewing the manuscript.