Introduction
Photoreceptors have the greatest energy demand in the body, mediated by densely packed mitochondria in their inner segments (IS), with cone photoreceptors having approximately ten times the number of mitochondria compared to rods (Hoang et al., Reference Hoang, Linsenmeier, Chung and Curcio2002; Linsenmeier, Reference Linsenmeier1986; Linsenmeier & Padnick-Silver, Reference Linsenmeier and Padnick-Silver2000; Narayan et al., Reference Narayan, Chidlow, Wood and Casson2017). Trichromatic vision in old world primates is achieved via signaling from three cone photoreceptor types with different spectral sensitivities to blue (420 nm), green (530 nm), and red (560 nm) light (Knowles et al., Reference Knowles, Davson and Dartnall1977; Mollon, Reference Mollon1982). However, the relatively rare S-cones exhibit morphologically distinct IS (Curcio et al., Reference Curcio, Allen, Sloan, Lerea, Hurley, Klock and Milam1991) and share some biochemical similarities with rods (Nork et al., Reference Nork, McCormick, Chao and Odom1990). Further, their psychophysical responses saturate early, similar to rod photoreceptors rather than other cone types (Mollon & Polden, Reference Mollon and Polden1977). Although their number does not decline with age (Weinrich et al., Reference Weinrich, Powner, Lynch, Jonnal, Werner and Jeffery2017), there is evidence that S-cones are functionally vulnerable in aging and disease including diabetes (Greenstein et al., Reference Greenstein, Hood, Ritch, Steinberger and Carr1989).
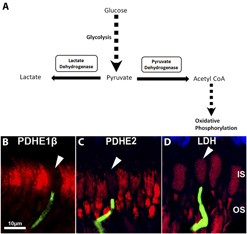
The retina has unique metabolic features (Hurley et al., Reference Hurley, Lindsay and Du2015; Narayan et al., Reference Narayan, Chidlow, Wood and Casson2017). Here, we ask if the distinctive characteristics of S-cones result from fundamental metabolic differences between these cells and other cone types. Metabolic activity is driven by ATP generated either via mitochondrial respiration or glycolysis. The separate pathways can be identified by either pyruvate dehydrogenase to mark mitochondrial oxidative phosphorylation or lactate dehydrogenase to mark glycolysis (Fig. 1A). The mitochondrial route of production is more efficient while glycolysis provides rapid ATP delivery, but only briefly. However, sustained glycolysis can be toxic because it results in the production of advanced glycation end products (AGEs) that undermine cell function and are associated with aging (Xing et al., Reference Xing, Zhang, Song, Lv, Hou and Li2013). We use staining against pyruvate dehydrogenase and lactate dehydrogenase to determine which metabolic pathways are employed by primate S-cones and if this differs from other cone types and why this should be.
(A) Schematic representation of pathways for ATP production via either pyruvate dehydrogenase leading to mitochondrial oxidative phosphorylation or via lactate dehydrogenase as part of glycolysis. (B–D) We use pyruvate dehydrogenase (PDH) and lactate dehydrogenase (LDH) markers to define these pathways labeling central primate retina. Labeling for PDH is subdivided into PDHE1β (B) and PDHE2 (C). PDHE1β is the rate limiting factor for the pyruvate dehydrogenase complex as it catalyzes the reaction of PDHE2. PDH is in red in B and C. S-cones are labeled in green and marked with a white arrow head. PDH label is confined to mitochondrial containing inner segments (IS). However, the S-cones are negative for both PDH forms. D is stained for LDH. Here, label is present in inner (IS) and outer segments (OS). All photoreceptors including S-cones are LDH positive. Blue staining to the top is the outer nuclear layer. These data are representative of all of the stained tissue from the different animals irrespective of eccentricity.

Materials and methods
All animal procedures complied with University College London Ethics Committee approval and were under a UK Home Office project license (PPL70/8379). They conformed to the UK Animal License Act (1986) and local regulations. Ocular tissues were acquired from Macaca fascicularis from an established colony under UK Home Office regulation and maintained by Public Health England. All of the animals in this colony live under normal lighting conditions. They spend a significant proportion of their time in an external environmental with natural light. When inside, the majority of light remains from the external environment. Hence, they are not subject to any form of light environment that could influence the factors examined in this study. Eyes were retrieved at the point of death after sedation with ketamine (10 mg/kg IM) and overdose of intravenous sodium pentobarbital (>100 mg/kg IV). The primary purpose of animal usage was different from the aims of this study and eyes were only retrieved after respiration and the heart had stopped. The eyes were removed rapidly and were fixed in 4% paraformaldehyde in 0.1 m phosphate buffered saline (PBS) for several days and then transferred to phosphate buffer saline containing 0.025% sodium azide. Eyes were washed in PBS, dissected, and the anterior tissues removed. A horizontal strip containing the retina, RPE, and choroid was removed running from the temporal periphery, through the macular and toward the nasal retina. These were cryoprotected in 30% sucrose and then embedded in optimal cutting temperature compound (OCT VWR, Lutterworth, UK). These were sectioned on a cryostat. Samples were taken from 5 young animals between 4–5 years and 5 old primates 14–15 years. Primates in this colony rarely lived beyond 18 years.
To determine if patterns of S-cone labeling in primates were conserved in other vertebrate retinae, mice and frogs (Xenopus levis) were also used in this study. Four–month-old male C57 BL/6 were housed in standard conditions. These were sacrificed (N = 4) by cervical dislocation and eye orientation marked by a small burn mark made to the dorsal aspect of the eye using a hot 18-gauge needle. Mature frogs (N = 4) were killed via pithing and eye orientation marked as above. The eyes from both species were enucleated and fixed in 4% paraformaldehyde in PBS for 1 h and then the anterior chamber was removed and the remaining eye cup cryoprotected in 30% sucrose overnight and embedded in OCT. All tissues were sectioned at 10 µm and slide mounted.
Immunohistochemistry
Sections were immunostained with the following markers: Rabbit monoclonal anti-Lactate Dehydrogenase from Abcam (Cambridge, UK) (ab134187, 1:200); Mouse monoclonal anti-Pyruvate Dehydogenase E1β subunit from Abcam, UK (ab110331, 1:200); a rabbit polyclonal anti-pyruvate dehydrogenase E2 from Novus Biologicals (Cambridge, UK) (NBP2-34065), a goat polyclonal anti OPN1SW (N-20 from Santa Cruz Biotechnology, Heidelberg, Germany) (sc-14363, 1:1000). A rabbit polyclonal voltage dependent anion channel 1 marker (VDAC) from Novartis Biologicals (Camberley, UK) (NBP1-45921). VDAC mediates ATP and pyruvate transport across mitochondrial membranes and is linked with metabolic activity and regulates Ca2+ transport across the membrane (Dubey et al., Reference Dubey, Godbole and Mathew2016). Secondary antibodies in the double labeling experiment were fluorescent conjugate Alexa Fluor 568 (1:2000, Invitrogen, UK) or 488 (1:2000, Invitrogen, ThermoFisher Scientific, Paisley, UK). The nuclei were counterstained with a nuclear marker 4′,6-diamino-2-phenylindole (DAPI) (Sigma-Aldrich, Gillingham, UK). For mice and frogs, 10 µm frozen sections were cut and thaw-mounted onto charged slides. Slides were immunostained with a rabbit polyclonal anti-pyruvate dehydrogenase E2 from Abcam (ab66511, 1:200) and a goat polyclonal anti-OPN1SW (N-20) from Santa Cruz Biotechnology, UK (sc-14363, 1:1000).
Slides were mounted in Vectashield (Vector Laboratories, Peterborough, UK) and coverslipped. Sections were viewed and images captured using an Epi-fluorescence and bright-field microscope (Olympus BX50F4, Olympus, Southend, UK) and a Nikon DXM1200 (Nikon, Kingston, UK) digital camera. In eyes from 5 primates, 3 sections 1.5 cm long were viewed for cone staining. The number of mitochondrial profiles stained with VDAC was counted in both S-opsin stained and non-S-opsin stained cones in 5 individual retinae from similar central locations in clearly identified inner segments that were complete within the section (S-opsin N = 7 cells, non-S-opsin 12 cells).
Resin embedded histology
Five eyes from young and 5 eyes from old primates were dissected and a horizontal strip of the neural retina was removed running from the periphery through toward the center. This was flat-mounted and processed for immunohistochemistry. After several PBS washes, the retinal tissues were blocked and permeabilized with 5% Normal Donkey serum in 3% (v/v) Triton X-100 in PBS for 2 h. Samples were incubated overnight in a goat polyclonal antibody to OPN1SW (N-20 from Santa Cruz Biotechnology, UK) (sc-14363, 1:1000) made in 1% Normal Donkey Serum in 3% Triton X-100 in 0.1 m PBS. After primary antibody incubation, samples were washed repeatedly in PBS and incubated in a biotinylated antigoat secondary antibody for 2 h at room temperature. After the secondary antibody incubation, the flat-mounts were washed several times and incubated in a ready to use horseradish peroxidase streptavidin solution (Vector Laboratories, UK) for 30 min, followed by a peroxidase substrate solution, 3,3-diaminobenzidine (DAB. DAKO, Ely, UK) for 5 min. The flat-mounts were then processed for plastic embedding and were fixed with 2% paraformaldehyde and 2% glutaraldehyde in PBS for 24 h, followed by repeated PBS washing. They were then post fixed in 1% OsO4 in 0.1 m PBS for 2 h, thoroughly washed in distilled water and dehydrated through a graded series of ethanols. Then infiltrated, polymerized, and embedded in Technovit 7100 historesin (Taab Laboratories equipment, Aldermaston, UK). Resin sections were cut at 2.5 µm, histologically stained with Sudan Black B, and mounted in Depex and coverslipped. Analysis was undertaken in eyes from 5 primates from 3 sections per animal that were 1.5 cm long.
Statistical analysis
For comparison between the two groups, the Mann–Whitney U test was used. Data were analyzed using GraphPad Prism version 5.0 for windows (GraphPad, San Diego).
Mitochondrial absorption modeling
Measurements of the optical absorbance of a suspension of mitochondria taken from guinea pig livers were extracted from the transmittance data as shown in Fig. 3 of Nakajima et al. (Nakajima et al., Reference Nakajima, Ishihara, Arai, Morimoto, Kikuchi, Kannari and Obara1993). After measuring their reduction and oxidation transmission curves, central absorbance values and bandwidths (FWHM) were derived for the selective absorption curves centered at 418 nm by interpolating a continuum across the band from both their reduced and oxidized measurements. This results in central absorbance values for the band alone of 0.061 and 0.055, respectively, yielding an average of 0.06 with an estimated error of ∼0.01. This calculation assumes that the difference between the reduced and oxidized (Nakajima et al., Reference Nakajima, Ishihara, Arai, Morimoto, Kikuchi, Kannari and Obara1993) transmission curves is entirely due to the continuous extinction and not to the Soret band absorption.
This average value was then scaled for the ratios of transmission path length and of the mitochondrial volume density values from the Nakajima et al. (Nakajima et al., Reference Nakajima, Ishihara, Arai, Morimoto, Kikuchi, Kannari and Obara1993) experiment and a schematic cone inner segment model consisting of a cylinder of diameter d μm and length l µm. To produce Fig. 4, we assumed d = 5 and l = 15 and that the IS of M/L-cones have a mitochondrial filling factor of unity for the M/L cones and 0.35 for the S cone. The transmission curves are than calculated using a Lorentzian absorbance profile having a FWHM of 45 nm.
Results
Retinae from the old world primate Macaca fascicularis were immunostained for pyruvate or lactate dehydrogenase (PDH/LDH) and S-opsin. Pyruvate dehydrogenase complex has three enzymes E1, E2, and E3 converting pyruvate into acetyl-CoA. PDHE1β is the rate limiting factor for the pyruvate dehydrogenase complex as it catalyzes the reaction of PDHE2. Cones were distinguished morphologically by their clear cone shaped IS. Cones were positive for both PDHE1β and PDHE2 with labeling confined to the mitochondrial containing IS. Staining for the two PDHE markers was very similar in cones across the retina. However, S-cones were consistently negative for both labels (Fig. 1B and 1C). Data shown in Fig. 1 are representative of all animal examined. All cones, irrespective of type, were LDH positive present throughout inner and outer segments indicative of their ability to use glycolysis (Fig. 1D). These data were consistent across animals and different retinal regions. Hence, S-cones do not appear to employ mitochondria for ATP production but likely rely on glycolysis.
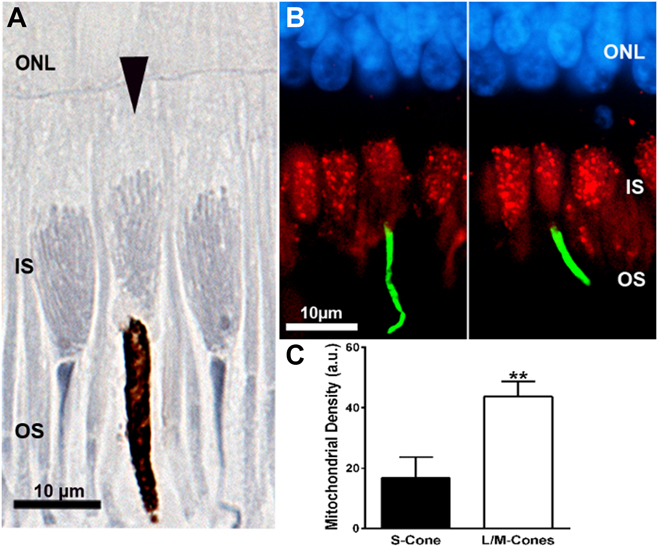
Mitochondria were revealed by staining with osmium and Sudan Black. Mitochondrial density was consistently lower in S-cones than other cone types in each of the animals used and at different retinal locations examined. Fig. 2A shows an S-cone (arrow head) and adjacent, two non-S-cones. Also in S-cones, mitochondria never extended to the tip of the IS as found in other photoreceptors. This was consistent in all retinae from the separate animals that were examined.
Primate cone inner segments (IS) where mitochondria have been labeled with two separate methods along with S-opsin. (A) Sections stained with osmium and Sudan Black. Here, mitochondria are seen as elongated structures within the IS oriented toward the OS. The central cone marked with an arrow head has an S-opsin positive OS. In this cell, mitochondrial density is relatively low and mitochondria do not extend fully to the OS. The OS of this cell and the associated ciliary region are enlarged with some distortion due to the deposition of DAB in the tissue. (B) Two images from the central retina stained with a voltage dependent anion channel (VDAC) present in mitochondria (red) and S-opsin (green). Photoreceptor nuclei in the outer nuclear layer (ONL) are stained in blue. (C) The area of VDAC label in the cones has been measured in S-opsin positive and S-opsin negative cells. There is >60% significant reduction in the area occupied by VDAC label in S-cones compared to other cone types. Reduced VDAC staining shown in B is consistent with reduced mitochondrial density shown in A and was a consistent across animals and different retinal regions.
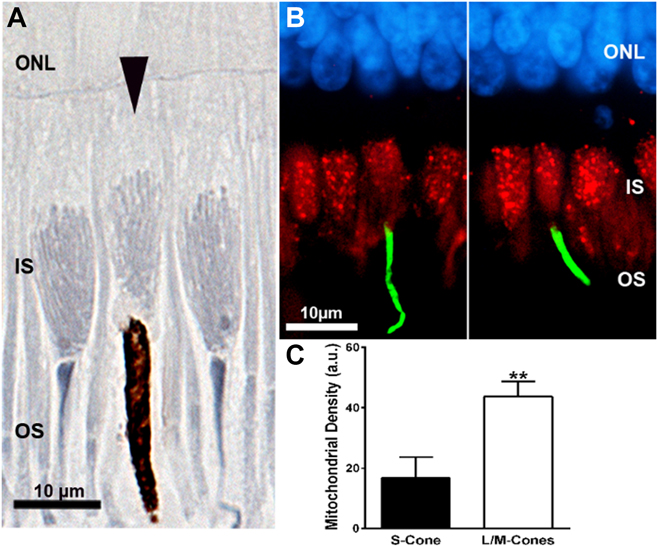
Sections were also stained for S-opsin and VDAC, which is present in outer mitochondrial membranes. Fig. 2B shows VDAC label in red and the S-opsin in green. VDAC profiles are confined to outer IS regions reflecting patterns as seen in Fig. 1B. However, in S-cones, there is markedly reduced label. The area occupied by VDAC labeled profiles was measured in S-opsin cones and the other cone types. In S-opsin cells, this was significantly lower (P < 0.01), being reduced by approximately 65% across the population (Fig. 2C). We only quantified VDAC label when confident of imaging the whole inner segment. However, reduced VDAC label was apparent in all positively identified S-cones from each animal and across different retinal locations.
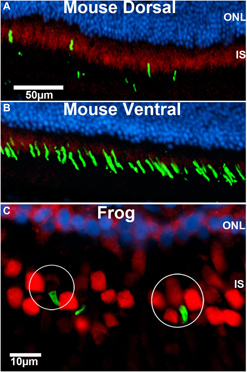
If primate S-cones are fueled by glycolysis, we ask if this a conserved feature of vertebrate photoreceptor function. Hence, we label both mouse and frog retinae for S-opsin and pyruvate or lactate dehydrogenase. Mice only express two cone opsins, S and M. They separate these with most S-cones located in the ventral retina, and most M cones in the dorsal retina, although many cones have been shown to express both opsin types particularly among the S cone population, although there is debate regarding the degree of this co-expression (Bowmaker, Reference Bowmaker2008). However, this does not change the fundamental point that the majority of S cones are located ventrally. In mouse, staining for pyruvate dehydrogenase was much greater in dorsal than ventral retina, consistent with the S-cone population being less reliant on mitochondrial function (Fig. 3A and 3B). However, clear isolation of individual cones was not reliable in mouse retinal section. Staining for lactate dehydrogenase was similar across the retina (data not shown). In sections from frogs, S-opsin cells were distributed throughout the retina. However, S-cones were mixed with some positive for pyruvate dehydrogenase and others negative (Fig. 3C). Again, staining for lactate dehydrogenase was relatively uniform (data not shown). Hence, fueling of S-cone function may be different between mammals and amphibians.
Staining for pyruvate dehydrogenase (red) and S-opsin (green) in mouse (A and B) and frog (C). In rodents, S-cones are largely confined ventrally, although a population of mouse cones does express both opsins. However, there is likely variability between strains in this respect and this does not disrupt the over differential distribution (Bowmaker, Reference Bowmaker2008). In this region of the retina, there was much less pyruvate dehydrogenase than in dorsal regions consistent with the notion that these cones may not be using mitochondrial respiration similar to primates. However, in frogs, S-cones were identified that were both positive and negative for pyruvate dehydrogenase. An example of each is circled.

Discussion
S-opsin cones have relatively few mitochondria and do not express pyruvate dehydrogenase, which is a key marker of mitochondrial respiration. They have reduced VDAC labeling consistent with the absence of pyruvate dehydrogenase and appear to fuel their activity via glycolysis, although S-cones appear not to be distinguished from other cone types on the basis of labeling for glucose transporters (Nihira et al., Reference Nihira, Anderson, Gorin and Burns1995). A driver for S-cone glycolysis is likely related to the reduced mitochondrial content in their IS. It had previously been noted by Curcio et al. (Curcio et al., Reference Curcio, Allen, Sloan, Lerea, Hurley, Klock and Milam1991) that at the light microscope level, human S-cone IS were morphologically different from those of M- and L-cones, being more cylindrical in shape with larger cross-sectional areas at the junction with the IS. Given the very high packing density of mitochondria in M- and L-cones, it is not surprising that reducing mitochondrial content by >60% influences IS morphology in S-cones. However, in spite of this, Curcio et al. (Curcio et al., Reference Curcio, Allen, Sloan, Lerea, Hurley, Klock and Milam1991) do not comment on the absence of mitochondria in the electron microscopic image of the single S-cone IS compared with that of the M/L cone they present (their Fig. 3). Ideally, our VDAC labeling should be backed up by EM in the separate cone classes and the mitochondria counted in S-cones and compared to their number in other cone types. However, the probability of encountering multiple S-cones in ultra-thin EM sections is so low that such an approach would be unrealistic. Even in plastic sections that are 2.5 µm thick, S-cones are rare. An additional question that is raised concerns how the S-cone manages intracellular events with reduced mitochndrial number. These organelles undertaken many function apart from generating cellular energy and are responsible for an array of signaling processes. An implication from the results of this study is that many of these functions may differ in primate S-cones compared to the other cone types.
Why should S-cones have reduced mitochondrial density and employ glycolysis as their energy source? An explanation is suggested by the reverse orientation of photoreceptors in the vertebrate retina which demands that incoming light has to traverse the mitochondrion-rich IS before detection. Mitochondria have a marked drop in their spectral transmittance at approximately 400–450 nm that spans the peak S-cone sensitivity at 420 nm (Bowmaker et al., Reference Bowmaker, Astell, Hunt and Mollon1991; Nakajima et al., Reference Nakajima, Ishihara, Arai, Morimoto, Kikuchi, Kannari and Obara1993). Bowmaker et al. (Bowmaker et al., Reference Bowmaker, Astell, Hunt and Mollon1991) noted the presence of a photostable pigment in the IS of cones of the tree shrew, Tupaia glis, which might be associated with a porphyrin Soret band (Brunet et al., Reference Brunet, Antoine, Lemoine and Dugourd2012). They show an absorbance spectrum with a peak at 418 nm from a cone IS transverse spectral measurement yielding an absolute peak absorbance of 0.02. They also suggest that this could be associated with cytochrome c, part of the final stage of the electron transport chain in mitochondrial ATP production. These data are consistent with the results we present. However, they do raise the question of why IS Soret band absorbance has not been identified before? The answer resides in the nature of micro-spectrophotometry as applied to photoreceptors. Here, individual outer segments are commonly dissociated and targeted by a light beam while horizontal. Absorbance characteristics are derived from a comparison of the beams component spectrum before and after it traverses the flat outer segment. In such experiments, efforts are made to avoid IS and Bowmaker et al. (Reference Bowmaker, Astell, Hunt and Mollon1991) findings of 420 nm absorbance by IS were fortuitous (Bowmaker personal communication).
Nakajima et al. (Nakajima et al., Reference Nakajima, Ishihara, Arai, Morimoto, Kikuchi, Kannari and Obara1993) measured the spectral absorbance of a known column density of suspended mitochondria extracted from guinea pig livers. Their transmission spectra showed a generally increasing extinction, extending into the blue, on which was superposed an absorption band with a width (FWHM) of about 45 nm and centered at 418 nm. This shows a close spectral similarity to the primate pigment measured by Bowmaker et al. (Bowmaker and Dartnall, Reference Bowmaker and Dartnall1980; Bowmaker Reference Bowmaker2008). Hence, low mitochondrial density may be necessary for S-cones simply because of the effect mitochondria have on spectral transmittance.
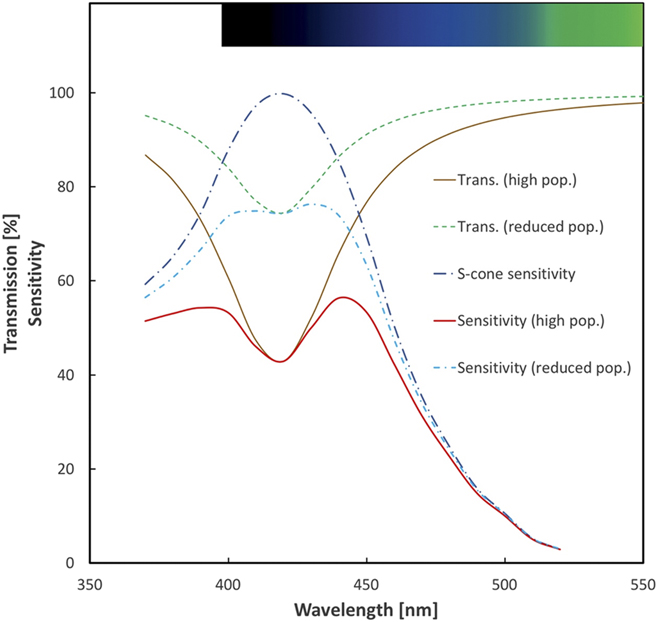
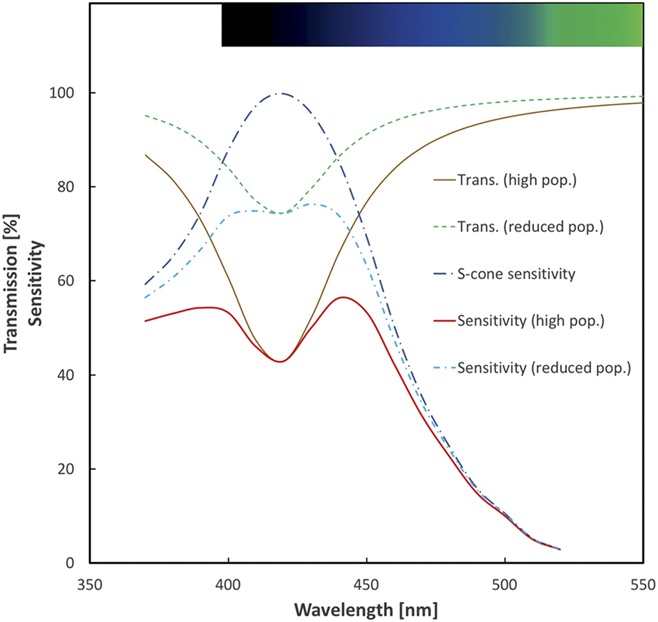
By isolating this band from the associated continuum extinction, we have scaled the Nakajima et al. (Nakajima et al., Reference Nakajima, Ishihara, Arai, Morimoto, Kikuchi, Kannari and Obara1993) absorbance result to the IS dimensions and mitochondrial content of primate cones. Note that the strength of the continuum extinction depends strongly on the redox state of the mitochondria while the band absorption remains constant. The result is expressed in Fig. 4, which shows the effect on the transmission of light in a longitudinal direction through the S- and the M/L-cones. We represent the IS as a cylinder with a diameter of 5 µm and a length of 15 µm, maximally filled with mitochondria representing the M/L-cones and a reduced population (by 65%) for the S-cones. Whilst only an estimate of the magnitude of the potential filtering effect: a loss of 35% in blue sensitivity for a full mitochondrial population and only 15% for the reduced population does provide a quantitatively feasible explanation for the special behavior of the primate S-cones. We stress that this model is based on data we have generated from primate. The evolution of the primate retina is unique among mammals both in acuity and in its ability to discriminate different wavelengths. While the mouse appears to share some features with primate, in a spatial association between glycolytic markers and the distribution of S-cones, it has followed a very different evolutionary pathway and remained largely nocturnal, preferring to avoid light when possible. Also its S-cones are sensitive to much shorter wavelengths than found in primates (Bowmaker, Reference Bowmaker2008). Further, we have made no attempt to examine mitochondrial content of its cone populations.
Schematic representation of the effect on primate S-cone responses to Soret band absorption by the population of mitochondria in the inner segment of the cell. This is based on our scaling of the mitochondrial absorbance measured by Nakajima et al. (Nakajima et al., Reference Nakajima, Ishihara, Arai, Morimoto, Kikuchi, Kannari and Obara1993) and our own estimates of mitochondrial numbers in primate S- and M/L-cones. The solid lines (brown and red) show the response as it would be if the S-cones had the same high complement of mitochondria seen in the M- and L-cones. The dashed lines (green and blue) show the higher response resulting from the reduced mitochondrial number seen in the S-cone cells. Integrals (between 370 and 470 nm) of the absorbed Dartnall et al. (Dartnall et al., Reference Dartnall, Bowmaker and Mollon1983) S-cone sensitivity curve with these two populations show a sensitivity loss of 35% with the high M/L cone population which is reduced to 15% loss with the reduced S-cone numbers.
If mitochondria spectrally filter, it should be possible to identify psychophysical irregularities in spectral sensitivity curves of human M- and L-cones in the region of the Soret band because of the high density of mitochondria in these cells. Both M- and L-cone sensitivity curves are asymmetric and have reduced sensitivity between 420–450 nm that may be due to porphyrin filtering (Stockman & Sharpe, Reference Stockman and Sharpe1998). This would potentially enhance discrimination between M/L- and S-cone sensitivities. However, such issues needed to be questioned directly in psychophysical experiments designed specifically to estimate potential mitochondrial filtering.
There is a wider evolutionary context to mitochondrial optical filtering in cone IS. In birds, reptiles, amphibians, and some fish, the cone IS contains large oil droplets with different chromatic properties that act as lenses channeling and spectrally filtering light before absorption by outer segment opsins (Kram et al., Reference Kram, Mantey and Corbo2010; Stavenga & Wilts, Reference Stavenga and Wilts2014; Vorobyev, Reference Vorobyev2003; Walls, Reference Walls1942; Wilby & Roberts, Reference Wilby and Roberts2017). Mitochondria in front of the droplet may act to focus light onto the droplet surface (Wilby & Roberts, Reference Wilby and Roberts2017). Droplets are absent in mammals with the exception of some marsupials where they are clear (Walls, Reference Walls1942). Our data indicate that the inner segment remains a region of optical filtering in mammals because of the presence of mitochondria.
The price paid for reducing mitochondria is increased reliance on glycolysis with its inherent problems from an increased pace of aging. Glycolytic reliance is toxic due to production of methylglyoxal, termed “the dark side of glycolysis”. Methylglyoxal mediates glycation of proteins forming AGEs that increase endoplasmic reticulum stress driving neuronal degeneration and/or reduced function (Xing et al., Reference Xing, Zhang, Song, Lv, Hou and Li2013). AGEs are also associated with diabetes and macular degeneration (Glenn & Stitt, Reference Glenn and Stitt2009; Sun et al., Reference Sun, Huang, Xu, Sun, Lv and Wang2017; Uribarri et al., Reference Uribarri, Woodruff, Goodman, Cai, Chen, Pyzik, Yong, Striker and Vlassara2010). Such processes may underpin the selective early decline in aged human S-cone function (Werner, Reference Werner2016). As primate S-cones are not lost with age (Weinrich et al., Reference Weinrich, Powner, Lynch, Jonnal, Werner and Jeffery2017), their functional decline is likely due to their distinct metabolism. However, throughout the vast majority of human evolution, lifespan was probably <40 years, which is an age prior to significant human S-cone decline (Werner, Reference Werner2016). Hence, adoption of glycolysis would have carried little cost when lifespan was short. Only with recent expansion in Western lifespan do its damaging consequences become apparent.
The evolutionary relationship between rods and cones may be more complex than originally thought. It is likely that early vertebrates had only cone photoreceptors, although this picture is now less clear (Morshedian & Fain, Reference Morshedian and Fain2015). However, it has been shown in mice that the origins of rods likely reside in their recruitment from S-cones, but that this is not the case in zebrafish (Kim et al., Reference Kim, Yang, Oel, Brooks, Jia, Plachetzki, Li, Allison and Swaroop2016). This may relate to similarities in the saturation characteristics of rods and S-cones (Mollon & Polden, Reference Mollon and Polden1977). It would be of interest to know if this also relates to the differences we find between primates and frogs in their distinct labeling patterns that imply that frog S-cones do not rely on glycolytic mechanisms.
S-cones are labile compared to M- or L-cones that again mark them out as distinct. During development, S-cones are the first to express opsin and many cells that subsequently express L- or M-opsin transiently express S-opsin (Cornish et al., Reference Cornish, Xiao, Yang, Provis and Hendrickson2004). There is a rare human condition termed enhanced S-cone syndrome (Haider et al., Reference Haider, Jacobson, Cideciyan, Swiderski, Streb, Searby, Beck, Hockey, Hanna, Gorman, Duhl, Carmi, Bennett, Weleber, Fishman, Wright, Stone and Sheffield2000) where S-cone function is elevated and S-cone number may be >10 times greater than normal (Ripamonti et al., Reference Ripamonti, Aboshiha, Henning, Sergouniotis, Michaelides, Moore, Webster and Stockman2014). This is at the expense of rods and the M and L cones. This result from mutations in the NR2E3 receptor transcription factor that likely switches cell fate determination, perhaps toward a default consistent with early expression patterns (Milam et al., Reference Milam, Rose, Cideciyan, Barakett, Tan, Gupta, Aleman, Wright, Stone, Sheffied and Jacobson2002). These features along with those described here mark S-cones out as distinct and as potentially more plastic than other photoreceptors.
Author contributions
JHK, TWW, and GJ conceived of the experiment. Experiments were performed by, JHK, TWW, MBP, HS, and RF. Data analysis was undertaken by JHK, TWW, HS, and RF. All authors wrote and revised the manuscript.
Author information
All authors declare that they have no competing interest. Correspondence and requests for materials should be addressed to g.jeffery@ucl.ac.uk.
Acknowledgments
The research was funded by the BBSRC (BB/N000250/1). We thank Public Health England for the supply of tissue used in this study and S. Holmes for her technical assistance. We also thank Jim Bowmaker and Andrew Stockman for the critical comments on our results.