1 Introduction
We investigate the motion of a rigid wedge diving across an air–water interface. Water entry problems have appealed to scientists and engineers alike for more than a century. The beauty of splashes was first examined using high-speed photography by Worthington (Reference Worthington1908) and later studied in the context of naval engineering problems (Von Kármán Reference Von Kármán1929; Wagner Reference Wagner1932). While naval-oriented research is still very active (Abrate Reference Abrate2011), understanding and predicting forces on entering objects is also relevant for other fields, such as air–water missiles (May Reference May1952), aerospace engineering (Seddon & Moatamedi Reference Seddon and Moatamedi2006), diving birds (Ropert-Coudert et al. Reference Ropert-Coudert, Gremillet, Ryan, Kato, Naito and Maho1994; Chang et al. Reference Chang, Croson, Straker, Gart, Dove, Gerwin and Jung2016) and lizard locomotion (Hsieh & Lauder Reference Hsieh and Lauder2004), as well as prevention of injury in Olympic diving (Harrison et al. Reference Harrison, Cohen, Cleary, Barris and Rose2012) and dissemination of seeds (Amador et al. Reference Amador, Yamada, McCurley and Hu2013), aroma (Ghabache et al. Reference Ghabache, Antkowiak, Josserand and Séon2014) and diseases (Gilet & Bourouiba Reference Gilet and Bourouiba2015; Joung, Ge & Buie Reference Joung, Ge and Buie2017).
In this study, wedges of width
 $d$
and opening angle
 $\unicode[STIX]{x1D6FC}$
are dropped under gravity
 $g$
from a height
 $H$
, as shown in figure 1(a). They reach the air–water interface with a velocity
 $V\approx \sqrt{2gH}$
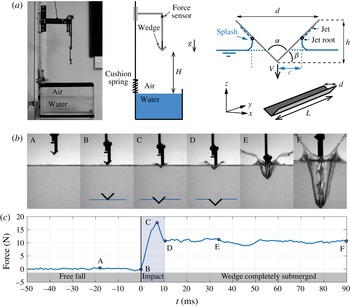
. Figure 1(b) shows the stages of water entry and corresponding vertical force acting on the supporting arm of a wedge of width
 $d=18$
mm and entry velocity
 $V=1.70~\text{m}~\text{s}^{-1}$
. This sequence illustrates several generic features of water entry. Shortly after first contact with the water surface, the vertical force quickly rises from 0 to a peak value; labels (B–C) in figure 1(b). The peak is very prominent and is reached before the wedge is completely submerged. This characteristic pattern is called ‘slamming’. The vertical force then decreases (C–D) and changes little once the wedge is fully submerged (D–E). Following submersion (D–E–F), two visually striking events occur. First, an air-filled expanding cavity is created in the wedge’s wake. Second, a curved splash is ejected upwards and sideways from the point of impact. The ejection velocity can be significantly higher than the wedge’s entry velocity
 $V$
: the thin and fast-moving splash is subject to aerodynamic interactions leading to non-trivial arabesques (E). This work is focused on the description and modelling of the vertical force generated during entry, as well as modelling the splash sheet kinematics. The first part deals with early stages of water entry (prior to the wedge’s total submersion), and in particular the transition from smooth to impactful entry as the wedge angle increases. The second part analyses, using a combination of empirical observations and low-order physics-based models, the long-term evolution of the splash projected upwards from the edges of the wedge during and following water entry.
(a) Experimental set-up. 3D-printed wedges of length
 $L$
, width
 $d$
and opening angle
 $\unicode[STIX]{x1D6FC}$
are attached to a vertical heavy slider and dropped from a height
 $H$
; they hit the air–water interface with a velocity
 $V\approx \sqrt{2gH}$
. Alternatively, the wedge is defined by the deadrise angle
 $\unicode[STIX]{x1D6FD}=(\unicode[STIX]{x03C0}-\unicode[STIX]{x1D6FC})/2$
and
 $h=(d/2)\tan \unicode[STIX]{x1D6FD}$
. As the wedge dives, water piles up underneath the wedge, and a jet is formed.
 $c$
designates the time-dependent horizontal location of the jet root. A force sensor mounted on the supporting arm measures the compression force during entry. (b,c) Typical water entry sequence and force measurement for an
 $\unicode[STIX]{x1D6FC}=90^{\circ }$
wedge of
 $d=18$
mm impacting at
 $V=1.70~\text{m}~\text{s}^{-1}$
. For large enough wedge angles (
 $\unicode[STIX]{x1D6FC}>70^{\circ }$
), the compression force peaks before the wedge is fully submerged; a smaller, quasi-constant force is observed after complete submersion.
 $t=0$
is defined as the first contact between the wedge and the water surface. The entry generates a thin and fast-moving splash, likely to interact with the surrounding air.

1.1 Impact forces on objects entering water
The fluid dynamics literature is divided into two types: those that focus on forces during impact, and others that focus on the cavity and splash formation. Von Kármán (Reference Von Kármán1929) was the first to estimate the slamming forces on wedges based on conservation of fluid-wedge momentum and the added mass effect. Shortly after, Wagner (Reference Wagner1932) presented a model based on potential flow theory, in which free surface elevation was taken into account. Potential flow models are relevant (i) for analysing large impact velocities where viscous effects are negligible and (ii) for solving for the flow on the leading part of the wedge (not past it), on which a vorticity-free flow is expected (see, for example, Park & Rhee Reference Park and Rhee2012). Most current models of the impact force during water entry are refinements of Wagner’s original work. Wagner’s original model provides good predictions of the impact force for nearly flat wedges (
 $\unicode[STIX]{x1D6FC}\approx 180^{\circ }$
), but leads to large overestimates at moderate opening angles (close to a two-fold error for
 $\unicode[STIX]{x1D6FC}=120^{\circ }$
: see Korobkin (Reference Korobkin2004)). Perhaps the most celebrated model among the improved derivations is the one of Logvinovich (Reference Logvinovich1972), which provides an accurate description of the maximum impact force and correctly predicts the pressure distribution on the wedge’s wetted surface; for more details, see Korobkin (Reference Korobkin2004) and Panciroli, Shams & Porfiri (Reference Panciroli, Shams and Porfiri2015). Zhao & Faltinsen (Reference Zhao and Faltinsen1993) and Zhao, Faltinsen & Aarsnes (Reference Zhao, Faltinsen and Aarsnes1996) were the first to propose a fully nonlinear solution for the coupled fluid-wedge system, and Mei, Liu & Yue (Reference Mei, Liu and Yue1999) developed a conformal mapping technique that built upon these findings. In a series of publications (Korobkin & Pukhnachov Reference Korobkin and Pukhnachov1988; Korobkin Reference Korobkin and Ohkusu1996, Reference Korobkin, Mori and Iwashita2001, Reference Korobkin2004), Korobkin offered a number of insightful analytical models of fluid entry under various conditions. Explicit finite-element methods have been employed by Bereznitski (Reference Bereznitski2001), Stenius, Rosen & Kuttenkeuler (Reference Stenius, Rosen and Kuttenkeuler2006), Wang, Luo & Soares (Reference Wang, Luo and Soares2012) and Calderer, Kans & Sotiropoulos (Reference Calderer, Kans and Sotiropoulos2014) to predict slamming loads. While many theoretical and numerical models predict impact forces on wedges of relatively small angles, there are few experimental studies that seek to validate these predictions (Zhao et al.
Reference Zhao, Faltinsen and Aarsnes1996; Wu, Sun & He Reference Wu, Sun and He2004; Yettou, Desrochers & Champoux Reference Yettou, Desrochers and Champoux2006; Tveitnes, Fairlie-Clarke & Varyani Reference Tveitnes, Fairlie-Clarke and Varyani2008). Even fewer studies consider and quantify the unavoidable three-dimensional effects of real-life experiments (Zhao et al.
Reference Zhao, Faltinsen and Aarsnes1996).
After the wedge is submerged, the presence of the cavity affects the hydrodynamic drag force. The flow past an object with a trailing cavity is expected to be more streamlined than past a fully immersed object. In the latter, vorticity, recirculation and turbulence are expected downstream of the object, angled or not (see, for instance, Rosenhead (Reference Rosenhead1939), Moffat (Reference Moffat1964) and Truscott, Epps & Techet (Reference Truscott, Epps and Techet2012)). Experimental measurements on spheres and disks entering water have shown that the drag coefficient is reduced by half when compared to the fully immersed case (May & Woodhull Reference May and Woodhull1948; Glasheen & McMahon Reference Glasheen and McMahon1996). There is, to our knowledge, no systematic model of how transient cavities affect drag on translating wedges. However, results about the influence of supercavities (induced by cavitation) on drag are available and show that the drag coefficient can be expressed as a function of the shape of the steady trailing cavity (Knapp, Daily & Hammitt Reference Knapp, Daily and Hammitt1970). We will tentatively apply these results to the transient (inertial) cavity generated by water entry, keeping in mind the physical origin of the cavity is different.
In the first part of this paper, we characterize the forces acting on the wedge during water entry (before and after submersion), and we compare our experimental results to existing theories. We show that wedges with large angles undergo ‘impactful’ entry, characterized by the presence of a large peak force before submersion. In contrast, low-angle wedges enter smoothly, with a force gradually rising from zero to a terminal value. We demonstrate that the transition between impactful and smooth entry can be predicted using Logvinovich’s model. We also show that the drag force acting on the wedge after submersion is quasi-constant and, because of the presence of the cavity, it is significantly lower than the drag force of an immersed wedge.
1.2 Splash and cavity evolution
The study of splashes and cavities dates back to the beginning of high-speed photography (Worthington Reference Worthington1908) and continues to be the topic of numerous publications (Birkhoff & Zarantonello Reference Birkhoff and Zarantonello1957; Duclaux et al. Reference Duclaux, Caille, Duez, Ybert, Bocquet and Clanet2007; Aristoff & Bush Reference Aristoff and Bush2009). Most studies consider either the dynamics of the cavity or the development of the splash. An air cavity evolves relatively slowly with respect to the object’s velocity and is thus easier to visualize and analyse. The retroaction of the cavity dynamics on the trajectory of the impacting object is of interest for the military, for directing bullets or air–water anti-torpedo missiles towards an underwater target (May Reference May1952; Birkhoff & Zarantonello Reference Birkhoff and Zarantonello1957). At very large impact velocities, the low-pressure area in the object’s wake triggers cavitation (Truscott, Epps & Belden Reference Truscott, Epps and Belden2014), which affects the stability of the object’s trajectory. At slower impact velocity, the cavity is primarily the result of inertia. Many research contributions focus on describing, classifying and modelling the cavity created by various impactors (Duclaux et al. Reference Duclaux, Caille, Duez, Ybert, Bocquet and Clanet2007; Aristoff & Bush Reference Aristoff and Bush2009; Truscott & Techet Reference Truscott and Techet2009; Marston et al. Reference Marston, Truscott, Speirs, Mansoor and Thoroddsen2016). Splashes, in contrast, are thin and fast-developing features of elusive nature. Unlike cavities, they are strongly dependent on the geometry of the object. Splashes have been extensively studied in the canonical problem of impacting spheres. Water entry of spheres is usually accompanied by a nearly vertical splash curtain (Worthington Reference Worthington1908; Aristoff & Bush Reference Aristoff and Bush2009). Entry of wedges, because of the large horizontal momentum imparted to the liquid, generally induces splashes curving outwards and downwards (Greenhow Reference Greenhow1987). These splashes are generally better defined, thicker, and less sensitive to wettability than splashes created by round objects, but they are considerably less studied than the latter.
For splashes, perhaps more than for any other aspects of water entry, the devil is in the details. Classically, water entry has been thought of as a problem driven by inertia for sufficiently high entry velocities. As Duez et al. (Reference Duez, Ybert, Clanet and Bocquet2007) pointed out, this view is essentially wrong. They demonstrated that capillary effects such as wettability have first-order effects on the cavity formation and subsequent splashes for spheres. Likewise, Marston et al. (Reference Marston, Truscott, Speirs, Mansoor and Thoroddsen2016) showed that capillary wrinkles originating from the contact line on the sphere are responsible for the dramatic splash shape upon ‘buckling’. Viscosity is also usually neglected, even though we can expect that for very thin fluid structures such as splashes, its effect could become important. Lastly, the surrounding air affects various aspects of the splash, including the ejecta (Quéré Reference Quéré2005; Xu, Zhang & Nagel Reference Xu, Zhang and Nagel2005), cavity collapse in axisymmetric problems (Gordillo et al. Reference Gordillo, Sevilla, Rodríguez-Rodríguez and Martínez-Bazán2005; Gekle et al. Reference Gekle, Peters, Gordillo, van der Meer and Lohse2010) and quasi-two-dimensional problems (Wang, Lugni & Faltinsen Reference Wang, Lugni and Faltinsen2015), and surface seal (Marston et al. Reference Marston, Mansoor, Truscott and Thoroddsen2015).
Attempts to simulate splashes have been met so far with mixed results, including for simple geometries such as wedges. In early models and simulations, the jet is either not considered at all (Wagner Reference Wagner1932; Logvinovich Reference Logvinovich1972), or cut off when leaving the wedge to avoid numerical difficulties (Zhao et al. Reference Zhao, Faltinsen and Aarsnes1996; Battistin & Iafrati Reference Battistin and Iafrati2003). Recent contributions use smoothed particle hydrodynamics (Gong, Liu & Wang Reference Gong, Liu and Wang2009), level-set immersed boundary methods (Calderer et al. Reference Calderer, Kans and Sotiropoulos2014) or boundary element methods based on potential flow theory (Wu et al. Reference Wu, Sun and He2004; Bao, Wu & Xu Reference Bao, Wu and Xu2016) to solve the full system and account for the free jet. However, most simulations either misrepresent the splash development (Calderer et al. Reference Calderer, Kans and Sotiropoulos2014) or fail to include potentially important parameters such as surface tension (Bao et al. Reference Bao, Wu and Xu2016). In short, existing descriptions of the splash shape lack a proper framework to help understand the effects of various physical forces on the splash evolution.
The second part of this study focuses on the cavity and splash evolution created by diving wedges. Using high-speed photography to reconstruct the shapes of the cavity and splash, we show that the cavity is self-similar for various entry velocities but the splash is not. In order to investigate the physics underlying the splash evolution, we develop a one-dimensional model based on the idea that the splash is primarily ballistic, and can be represented by a succession of discrete particles ejected from the free water surface. Our model bears similarity to previous models developed in the context of a moving fluid sheet (Gart et al. Reference Gart, Chang, Slama, Goodnight, Um and Jung2013), but it goes further in that it takes into account the sheet stretching and original contributions such as aerodynamic suction forces. The model shows, in conjunction with the experimental data, that the splash shape is the result of the interplay between aerodynamic interactions that favour bending and capillary effects that tend to cancel curvature.
2 Experimental set-up
Wedges were driven by gravity from a height
 $H$
to enter a water-filled rectangular acrylic tank measuring
 $51\times 26\times 32~\text{cm}^{3}$
. To ensure straight and reproducible entry conditions, a vertical tower
 $1.5$
m in height was used to guide the falling wedge; see figure 1(a). A wedge dropped from a height
 $H\leqslant 1.5$
m reaches the air–water interface with a velocity
 $V\approx \sqrt{2gH}\leqslant 3.5~\text{m}~\text{s}^{-1}$
.
The wedges were 3D-printed using Hatchbox PLA plastic of dimensional accuracy
 $\pm 0.05$
mm. We designed two sets of wedges: (i) we varied the opening angle
 $\unicode[STIX]{x1D6FC}$
from
 $60^{\circ }$
to
 $120^{\circ }$
while maintaining constant wedge width
 $d=36$
mm and length
 $L=150$
mm (aspect ratio
 $L/d=4.2$
) and (ii) we varied the projected area
 $L\times d$
from
 $1400$
to
 $5940~\text{mm}^{2}$
while maintaining constant aspect ratio
 $L/d=4.6$
and
 $\unicode[STIX]{x1D6FC}=90^{\circ }$
. Additionally, we used
 $90^{\circ }$
wedges of a smaller width
 $d=18$
mm but the same aspect ratio
 $L/d=4.2$
to check that several quantities were independent of
 $d$
. The mass of all moving parts
 $M$
consisting of the wedge and drop mechanism was approximately 875 g, with the mass of the wedge itself ranging between 15 g and 30 g. The weight
 $Mg$
was chosen so that it balances the average drag and impact forces during water entry, thus limiting acceleration or deceleration during water entry and allowing us to treat the velocity
 $V$
of the wedge as constant during water entry.
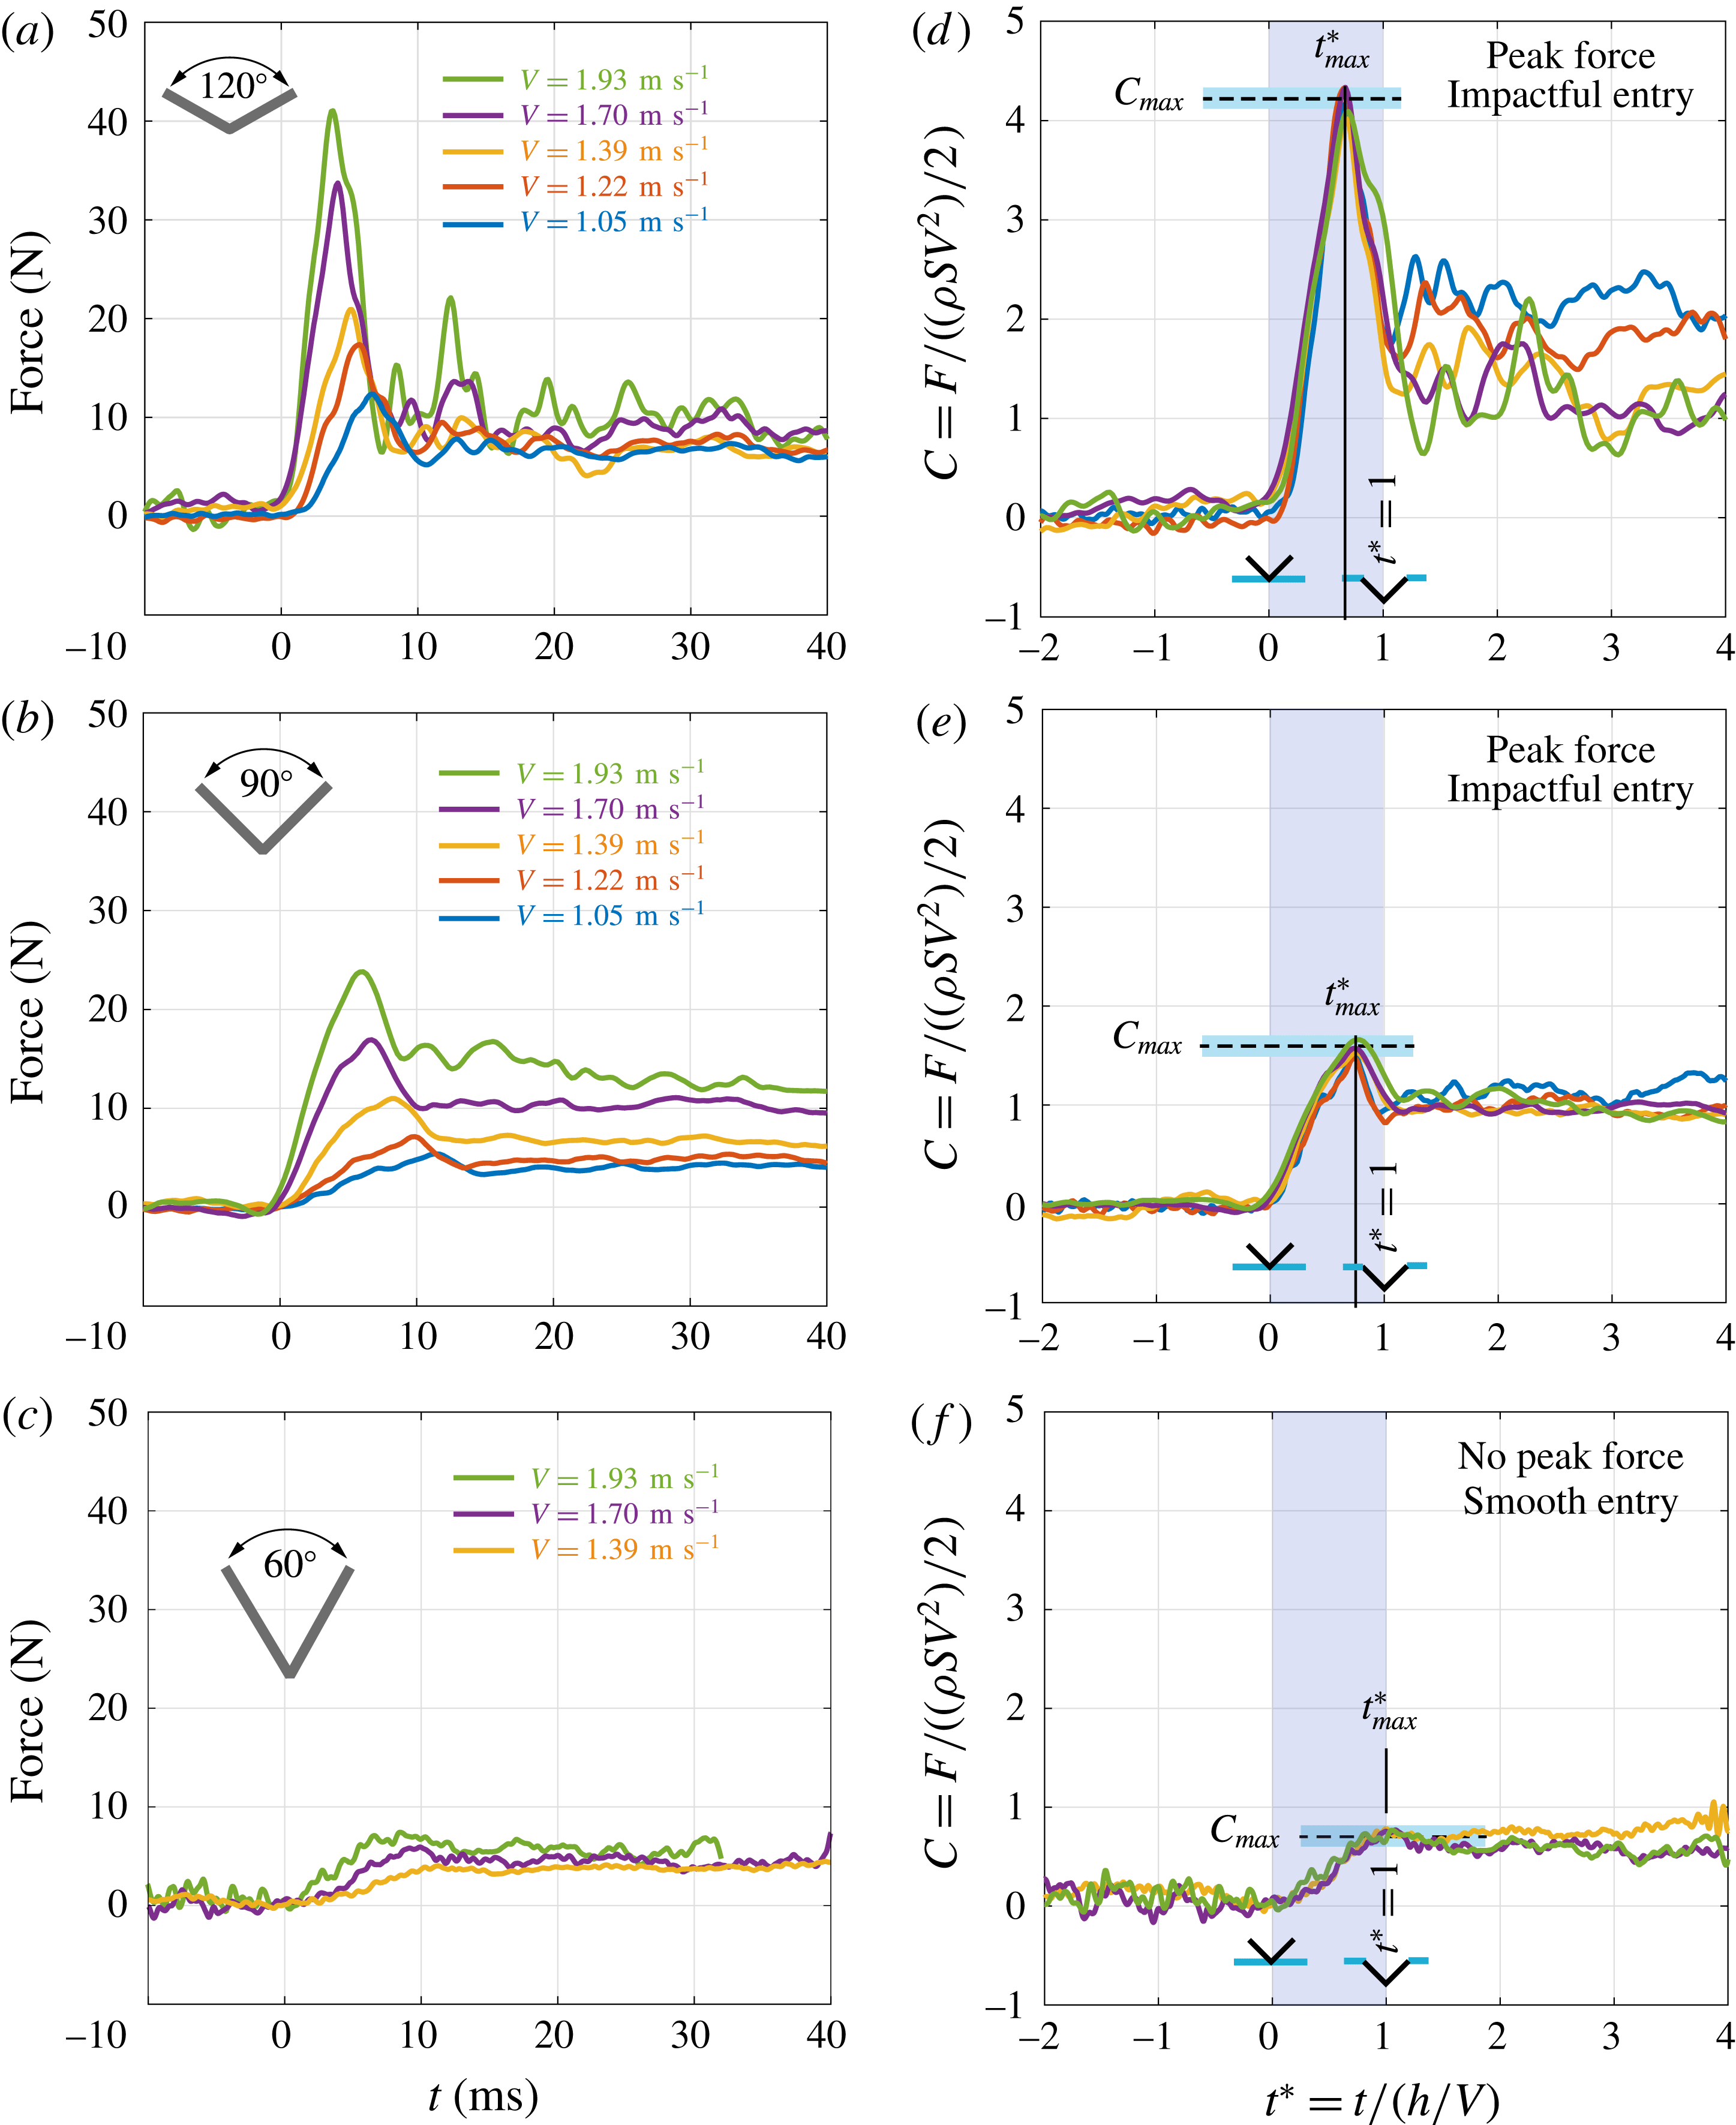
Dimensional (a–c) and non-dimensional (d–f) force history during water entry for
 $120^{\circ }$
,
 $90^{\circ }$
and
 $60^{\circ }$
wedges at various speeds. Note the almost perfect collapse of the force coefficient during the early stages of entry (d–f). A prominent peak force appearing for
 $t^{\ast }<1$
is observed for
 $\unicode[STIX]{x1D6FC}=120^{\circ }$
and
 $\unicode[STIX]{x1D6FC}=90^{\circ }$
, which we define as impactful entry; for smaller angles, such as in (c), the measured force gradually rises from
 $t^{\ast }=0$
(first contact) to
 $t^{\ast }=1$
(wedge fully submerged): the entry is smooth.
 $L=150$
mm,
 $d=36$
mm.

The water impact problem can be described by three non-dimensional parameters: the Weber number
 $We=\unicode[STIX]{x1D70C}dV^{2}/\unicode[STIX]{x1D70E}$
, where
 $\unicode[STIX]{x1D70C}=1000~\text{Kg}~\text{m}^{-3}$
is the water density and
 $\unicode[STIX]{x1D70E}=70\times 10^{-3}~\text{N}~\text{m}^{-1}$
is the surface tension of the air–water interface, the Froude number
 $Fr=V/\sqrt{gd}$
, where
 $g=9.81~\text{m}~\text{s}^{-2}$
is the gravitational constant, and the Reynolds number
 $Re=Vd/\unicode[STIX]{x1D708}$
, where
 $\unicode[STIX]{x1D708}=10^{-6}~\text{m}^{2}~\text{s}^{-1}$
is the kinematic viscosity of water. Given the experimental parameters, Weber numbers were in the range 200–2000, indicating fluid inertia should dominate surface tension effects. The Froude number ranged from 1.7 to 5, indicating that hydrostatic effects may have a noticeable contribution after the wedge is fully submerged. Lastly, the Reynolds number ranged between
 $10^{4}$
and
 $10^{5}$
, indicating that the effect of viscosity is negligible. It is worth noting that the relative influence of gravity with respect to surface tension can also be indicated by the Bond number
 $Bo=We/Fr^{2}=\unicode[STIX]{x1D70C}gd^{2}/\unicode[STIX]{x1D70E}$
, whose values fall in the range from 45 to 180, confirming that surface tension is not a major player in the forces acting on the wedge during water entry (but will be important in splash development).
Forces acting on the wedge were measured directly by means of a compression load cell (FC22, Measurement Specialties), secured between the horizontal arm connected to the sliders and the vertical rigid stem on which the wedge is mounted (see figure 1 b). An NI PCIe 6323 acquisition card was used to read data from the compression sensor at a rate of 8000 Hz. A spring was used to keep the wedge and stem in contact with the sensor during the free fall. The small elastic force from this spring was subtracted from the force measurements.
High-speed photography was used to characterize the development of the water jet and air cavity. Water entries were recorded at frame rates ranging between 1600 frames per second and 9000 frames per second using a Phantom Miro M-110 high-speed camera. A minimum of five videos were obtained for each condition with different wedge angles and dropping heights. For each case, we captured front, side, and angled views.
3 Forces during water entry
We characterize the forces acting on diving wedges before and after submersion, with particular emphasis on the gradual transition from impactful to smooth water entry as the wedge angle decreases.
3.1 Force measurements
Figure 2(a–c) shows the force evolution recorded by the force sensor for three wedges of opening angles
 $\unicode[STIX]{x1D6FC}=120^{\circ }$
,
 $\unicode[STIX]{x1D6FC}=90^{\circ }$
and
 $\unicode[STIX]{x1D6FC}=60^{\circ }$
, respectively, and for various entry velocities. As in figure 1(b), the force quickly rises from 0 to a positive value after impact. For
 $\unicode[STIX]{x1D6FC}=120^{\circ }$
and
 $\unicode[STIX]{x1D6FC}=90^{\circ }$
, the force peaks after entry, with peak values ranging from
 $10$
N to
 $40$
N, then decreases to a quasi-steady value once the wedge is fully submerged. For
 $\unicode[STIX]{x1D6FC}=60^{\circ }$
, the force gradually increases from 0 to a terminal value; no prominent peak force is observed. We call the first pattern ‘impactful entry’ and the second ‘smooth entry’.
Given the inertial flow regime (
 $Re>10^{4}$
), we scale force by
 $(\unicode[STIX]{x1D70C}SV^{2})/2$
, where
 $S=L\times d$
is the projected area of the wedge, and introduce the non-dimensional force coefficient
 $C=F/(\unicode[STIX]{x1D70C}SV^{2})/2$
. We also introduce a non-dimensional time
 $t^{\ast }=t/(h/V)$
by scaling time by the inertial time scale
 $h/V$
, with
 $t^{\ast }=0$
being the time of impact and
 $t^{\ast }=1$
corresponding to the instant when the wedge is fully submerged with respect to the undisturbed water surface. The dimensionless force coefficient is depicted in figure 2(d–f). For each wedge, the data of different entry velocities collapse for
 $t^{\ast }\leqslant 1$
, confirming that the force and time scales are appropriate. From these graphs, we extract a single value of the maximum force
 $C_{max}$
. We also mark the time
 $t_{max}^{\ast }$
when the maximum force happens:
 $t_{max}^{\ast }=0.66,\,0.73,\,1$
for
 $\unicode[STIX]{x1D6FC}=120^{\circ },\,90^{\circ },\,60^{\circ }$
, respectively. For
 $t^{\ast }>1$
, the force measurements do not collapse. We observe larger force coefficients at smaller entry velocities, particularly obvious for
 $\unicode[STIX]{x1D6FC}=120^{\circ }$
, which can be attributed to hydrostatic forces becoming significant as the Froude number approaches unity.
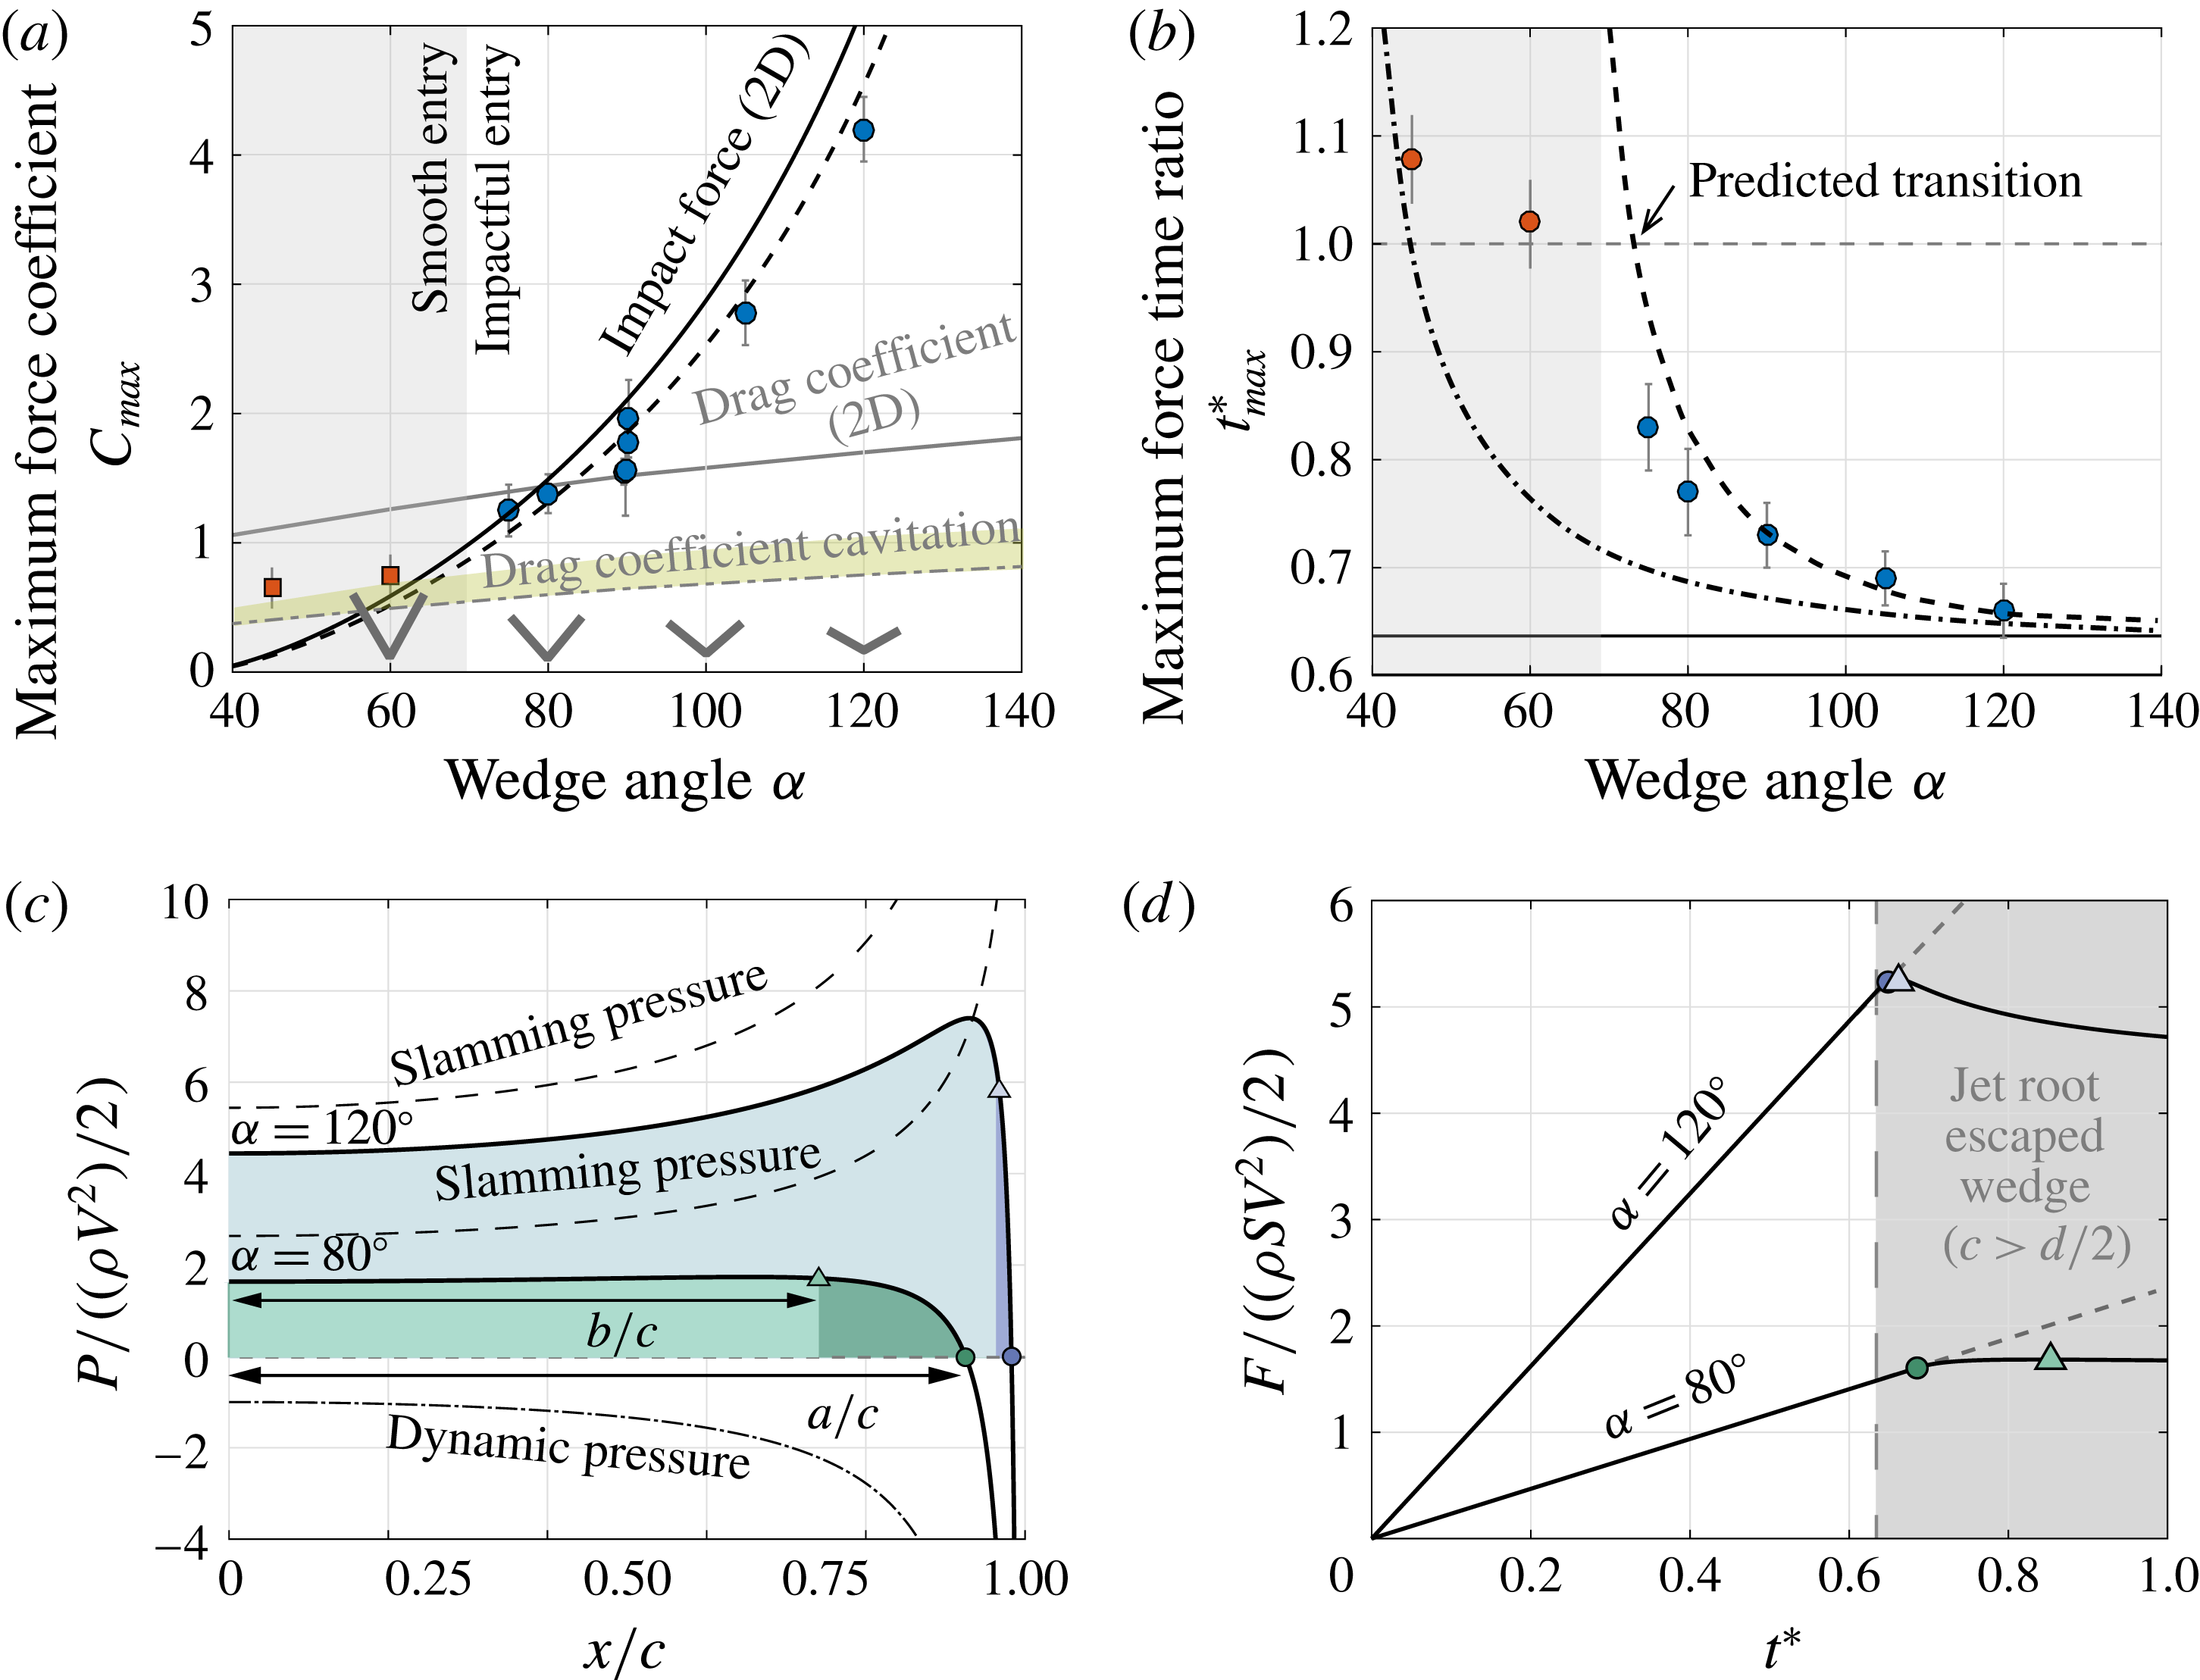
(a) The maximum force coefficient increases sharply with wedge angle
 $\unicode[STIX]{x1D6FC}$
, and follows theoretical predictions by Logvinovich (Reference Logvinovich1972) (solid line); excellent agreement is observed when Logvinovich’s two-dimensional theory is corrected for finite aspect ratio
 $L/d=4.2$
(dashed line). (b) For
 $\unicode[STIX]{x1D6FC}\leqslant 70^{\circ }$
, the maximum force happens roughly when the wedge is fully submerged (
 $t_{max}^{\ast }\approx 1$
), while for
 $\unicode[STIX]{x1D6FC}>70^{\circ }$
,
 $t_{max}^{\ast }$
drops sharply and converges to the naive prediction from Wagner’s theory
 $t_{max}^{\ast }=2/\unicode[STIX]{x03C0}$
. (c,d) The theoretical pressure profile can be used to improve the prediction for
 $t_{max}^{\ast }$
. Assuming the maximum force occurs when the negative pressure area completely escapes the wedge (
 $a=d/2$
, circles) leads to an analytical, refined estimation (dash-dotted line in panel b). In reality, the pressure integral (force
 $F$
) on the wedge reaches a maximum when
 $b=d/2$
(triangles), leading to a second numerical prediction (dashed line in panel b), providing the same trend as the experimental measurements. Transition to smooth entry is expected when the peak force occurs after the wedge’s submersion, that is,
 $t\geqslant 1$
(arrow in b). In (a,b), red square data points denote smooth entry, defined as the absence of prominent peak.

These measurements are repeated with wedge angles
 $\unicode[STIX]{x1D6FC}=60^{\circ }$
,
 $75^{\circ }$
,
 $80^{\circ }$
,
 $90^{\circ }$
,
 $105^{\circ }$
and
 $120^{\circ }$
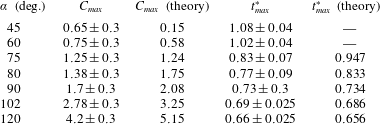
, leading to the values of
 $C_{max}$
and
 $t_{max}^{\ast }$
shown in figure 3(a,b) and table 1. Rather intuitively,
 $C_{max}$
increases sharply with
 $\unicode[STIX]{x1D6FC}$
, starting at
 $C_{max}=0.65$
for
 $\unicode[STIX]{x1D6FC}=45^{\circ }$
and reaching
 $C_{max}=4.2$
for
 $\unicode[STIX]{x1D6FC}=120^{\circ }$
, while
 $t_{max}^{\ast }$
decreases with
 $\unicode[STIX]{x1D6FC}$
, starting at
 $t_{max}^{\ast }=1.08$
for
 $\unicode[STIX]{x1D6FC}=45^{\circ }$
and plummeting to
 $t_{max}^{\ast }=0.66$
for
 $\unicode[STIX]{x1D6FC}=120^{\circ }$
. No prominent peak force was observed for wedges with
 $\unicode[STIX]{x1D6FC}\lesssim 70^{\circ }$
.
3.2 Force model
We show that (i) our experimental data compares favourably with Logvinovich’s model once three-dimensional effects are taken into account and (ii) the transition between smooth and impactful entry, occurring at
 $\unicode[STIX]{x1D6FC}\approx 70^{\circ }$
, can be anticipated using the same model.
Measured and theoretical force coefficient
 $C_{max}$
and time ratio
 $t_{max}^{\ast }$
(occurrence of maximum force).

Following Logvinovich (Reference Logvinovich1972), we consider the diving of a two-dimensional wedge of opening angle
 $\unicode[STIX]{x1D6FC}$
in the
 $(x,z)$
plane, with the wedge crossing the interface at a constant velocity
 $V$
. For convenience, we define the deadrise angle
 $\unicode[STIX]{x1D6FD}=(\unicode[STIX]{x03C0}-\unicode[STIX]{x1D6FC})/2$
. The hydrodynamic pressure everywhere in the fluid domain is given by the unsteady Bernoulli equation,
 $$\begin{eqnarray}p(x,z,t)=-\unicode[STIX]{x1D70C}\left(\frac{\text{d}\unicode[STIX]{x1D711}}{\text{d}t}+\frac{1}{2}|\unicode[STIX]{x1D735}\unicode[STIX]{x1D711}|^{2}\right),\end{eqnarray}$$
where
 $\unicode[STIX]{x1D711}$
is the velocity potential due to a horizontally expanding flat plate (plate of non-constant length to emulate the diving wedge) located on the free surface
 $z=0$
(see, for example, Howison, Hockendon & Wilson Reference Howison, Hockendon and Wilson1991):
 $$\begin{eqnarray}\unicode[STIX]{x1D711}=-V\sqrt{c(t)^{2}-x^{2}}.\end{eqnarray}$$
Here,
 $c$
is the location of the jet root defined as the extremity of the wetted surface (see figure 1
a), and is given by the so-called ‘Wagner condition’:
 $$\begin{eqnarray}c(t)=\unicode[STIX]{x03C0}Vt/(2\tan \unicode[STIX]{x1D6FD}).\end{eqnarray}$$
Relation (3.2) is valid for
 $|x|<c(t)$
, everywhere below the wedge’s wetted surface. The prediction of
 $c(t)$
is well supported by experimental measurements, as we show in § 4.1. The pressure on the contact region is given by (Korobkin Reference Korobkin2004)
 $$\begin{eqnarray}P(x,t)=-\unicode[STIX]{x1D70C}\left[\unicode[STIX]{x1D719}_{t}+{\textstyle \frac{1}{2}}V\sin (2\unicode[STIX]{x1D6FD})\unicode[STIX]{x1D719}_{x}+{\textstyle \frac{1}{2}}\cos (\unicode[STIX]{x1D6FD})^{2}(\unicode[STIX]{x1D719}_{x}^{2}-V^{2})\right],\end{eqnarray}$$
where
 $\unicode[STIX]{x1D719}$
is the velocity potential on the wedge’s surface, related to
 $\unicode[STIX]{x1D711}$
via the approximation
 $$\begin{eqnarray}\unicode[STIX]{x1D719}(x,t)\approx \unicode[STIX]{x1D711}(x,0,t)-V^{2}t=-V\sqrt{c(t)^{2}-x^{2}}+V^{2}t.\end{eqnarray}$$
For
 $\unicode[STIX]{x1D6FD}\ll 1$
, (3.4) becomes
 $$\begin{eqnarray}P(x,t)=-\unicode[STIX]{x1D70C}\left[\unicode[STIX]{x1D719}_{t}+{\textstyle \frac{1}{2}}(\unicode[STIX]{x1D719}_{x}^{2}-V^{2})\right].\end{eqnarray}$$
Substituting (3.5) into (3.6) leads to the approximate pressure distribution along the wedge:
 $$\begin{eqnarray}P(x,t)=\frac{1}{2}\unicode[STIX]{x1D70C}V^{2}\left[\frac{\unicode[STIX]{x03C0}}{\tan \unicode[STIX]{x1D6FD}}\frac{c}{\sqrt{c^{2}-x^{2}}}-\frac{c^{2}}{c^{2}-x^{2}}\right].\end{eqnarray}$$
The first term in (3.7), called the ‘slamming pressure’, comes from the unsteady pressure contribution in Bernoulli’s equation and is associated with the rate of change of momentum of the added mass (Faltinsen Reference Faltinsen2005). The second term comes from the quadratic term and represents the dynamic pressure contribution. Figure 3(c) shows the non-dimensional pressure
 $P(x,t)/(\unicode[STIX]{x1D70C}V^{2})/2$
as a function of
 $x/c$
, as well as the two contributions given by the first and second terms on the right-hand side of (3.7). The slamming pressure increases with distance from the wedge’s keel and diverges at
 $x=c$
; it also depends on the deadrise angle
 $\unicode[STIX]{x1D6FD}$
of the wedge. In contrast, the dynamic pressure is maximum at the keel and decreases with
 $x$
, tending to
 $-\infty$
as
 $x\rightarrow c$
, and is independent of the wedge’s angle. The total pressure is positive on most of the wetted region but becomes negative close to the jet root due to the dynamic pressure term. The sign change happens at
 $a/c=\sqrt{1-(\tan \unicode[STIX]{x1D6FD}/\unicode[STIX]{x03C0})^{2}}$
(marked by circular symbols in figure 3
c). This singularity is common to most modified Wagner models. It is regularized using the ansatz that only positive pressure matters (Logvinovich Reference Logvinovich1972; Korobkin Reference Korobkin2004): pressure should be integrated from
 $x=0$
to
 $x=a$
, which yields (accounting for both sides of the wedge)
 $$\begin{eqnarray}F(t)=2\int _{0}^{a(t)}P(x,t)\,\text{d}x=\unicode[STIX]{x1D70C}V^{2}c(t)\left[\frac{\unicode[STIX]{x03C0}^{2}}{2\tan \unicode[STIX]{x1D6FD}}-K(\unicode[STIX]{x1D6FD})\right],\end{eqnarray}$$
where
 $$\begin{eqnarray}K(\unicode[STIX]{x1D6FD})=\frac{\unicode[STIX]{x03C0}}{\tan \unicode[STIX]{x1D6FD}}\left[\frac{\unicode[STIX]{x03C0}}{2}-\arcsin (a/c)\right]-\frac{1}{2}\ln \left[\frac{1+a/c}{1-a/c}\right].\end{eqnarray}$$
To predict the maximum force, we assume that it is reached when the wetted length
 $c$
equals the wedge’s half-width
 $d/2$
, that is to say, when the splash root escapes the wedge. From (3.3), we get that
 $t_{max}^{\ast }=2/\unicode[STIX]{x03C0}\approx 0.636$
, independently of
 $\unicode[STIX]{x1D6FC}$
. Substituting this prediction for
 $t_{max}^{\ast }$
into (3.8), (3.9) leads to
 $$\begin{eqnarray}F_{max}=\frac{1}{2}\unicode[STIX]{x1D70C}SV^{2}\left[\frac{\unicode[STIX]{x03C0}^{2}}{2\tan \unicode[STIX]{x1D6FD}}-K(\unicode[STIX]{x1D6FD})\right].\end{eqnarray}$$
In figure 3(a,b), we compare
 $F_{max}/(\unicode[STIX]{x1D70C}SV^{2})/2$
and
 $t_{max}^{\ast }$
(solid lines) to experimental data. The prediction for
 $t_{max}^{\ast }$
matches roughly with the experimental data for large
 $\unicode[STIX]{x1D6FC}$
, but the discrepancy increases sharply as
 $\unicode[STIX]{x1D6FC}$
decreases. The force prediction
 $F_{max}/(\unicode[STIX]{x1D70C}SV^{2})/2$
is consistently larger (by approximately 15 %) than the force data for
 $\unicode[STIX]{x1D6FC}>90^{\circ }$
. One reason for this discrepancy stems from the fact that the prediction is based on two-dimensional theory while our wedges are not infinitely long (
 $L/d=4.2$
); it is thus necessary to consider three-dimensional effects. Following the suggestion of Zhao et al. (Reference Zhao, Faltinsen and Aarsnes1996), we correct Logvinovich’s two-dimensional prediction using results of Meyerhoff (Reference Meyerhoff1970), who calculated the added mass coefficients of rectangular plates of various length-to-width ratio. His calculations show that in order to accurately represent the effect of finite aspect ratio in situations where added mass plays an important role, two-dimensional predictions have to be corrected by a factor approximately equal to
 $1-d/(2L)$
. This results in a 12 % decrease in maximum force (dashed line in figure 3
a), which is in good agreement with the experimental data for moderate and large wedge angles.
The values of
 $F_{max}$
and
 $t_{max}$
are based on the assumption that the maximum force happens when
 $c=d/2$
. Yet, the theoretical pressure profile along the wetted length (figure 3
c) is negative from
 $x=a$
to
 $x=c$
. To refine the prediction of
 $t_{max}$
, we consider the maximum force to happen when the region of negative pressure has completely escaped the wedge (that is, when
 $a=d/2$
), which yields
 $t_{max}^{\ast }=(2/\unicode[STIX]{x03C0})(c/a)=(2/\unicode[STIX]{x03C0})/\sqrt{1-(2\tan \unicode[STIX]{x1D6FD}/\unicode[STIX]{x03C0})^{2}}$
. This improved prediction, represented in figure 3(b) as a dash-dotted line, increases sharply as
 $\unicode[STIX]{x1D6FC}$
decreases, but underestimates the experimental results, especially for moderate to large wedge angles. To refine the prediction further, we note that the integral of the pressure profile on the wedge continues to increase until
 $b=d/2$
, as shown in figure 3(c,d) (triangles). Numerical computation of this integral leads to a refined estimate of
 $t_{max}^{\ast }$
, represented as a dashed line in figure 3(b). This estimate is now in reasonable agreement with the experimental values for wedge angles down to
 $\unicode[STIX]{x1D6FC}\approx 80^{\circ }$
.
We now use the model to predict the transition from smooth and impactful entry. To this end, recall that the pressure on the wedge consists of two components: the ‘slamming’ pressure, which sharply increases with
 $\unicode[STIX]{x1D6FC}$
, and the dynamic pressure, which is independent of
 $\unicode[STIX]{x1D6FC}$
. For
 $\unicode[STIX]{x1D6FC}=120^{\circ }$
, the slamming pressure dominates, inducing a prominent peak in the pressure profile in figure 3(c). Consequently, the maximum force (indicated by triangles in figure 3
c) occurs immediately after the jet root leaves the wedge at
 $t_{max}^{\ast }\approx 2/\unicode[STIX]{x03C0}\simeq 0.636$
. This peak force before wedge submersion is characteristic of the impactful regime (see figure 2). As the wedge becomes sharper, the relative importance of the dynamic pressure increases and the pressure profile becomes flatter (figure 3
c). As a result, the time to reach the maximum force progressively increases. As it passes
 $t_{max}^{\ast }=1$
(wedge fully submerged), the entry is expected to be smooth: no peak before wedge submersion. This transition criterion gives
 $\unicode[STIX]{x1D6FC}\simeq 73^{\circ }$
(arrow in figure 3
b), in good agreement with the observed transition, between
 $60^{\circ }$
and
 $75^{\circ }$
. The important conclusion here is that the transition between the smooth and impactful regimes is expected to happen when the unsteady ‘slamming’ pressure has an effect comparable to the dynamic pressure, that is to say, when the rate of change of added mass is no longer the dominant effect. See supplementary movie 1, available at https://doi.org/10.1017/jfm.2018.273, for an illustration of the entry force in the smooth and impactful regimes.
Finally, it is interesting to compare the peak force with the drag force of a completely submerged wedge (figure 3
a). For large wedge angles, the peak force is significantly higher than the drag force. However, the peak force decreases sharply with the opening angle and, for
 $\unicode[STIX]{x1D6FC}<80^{\circ }$
, the measured maximum force becomes comparable to the drag coefficient of an immersed wedge. As
 $\unicode[STIX]{x1D6FC}$
decreases further, the peak force continues to decrease, in agreement with the impact force theory, to approximately half of the submerged drag force. This low value reflects that the drag force acting on diving wedges is smaller than we would expect for an immersed wedge, as we will explain in greater detail in the next section.
3.3 Drag force with a cavity
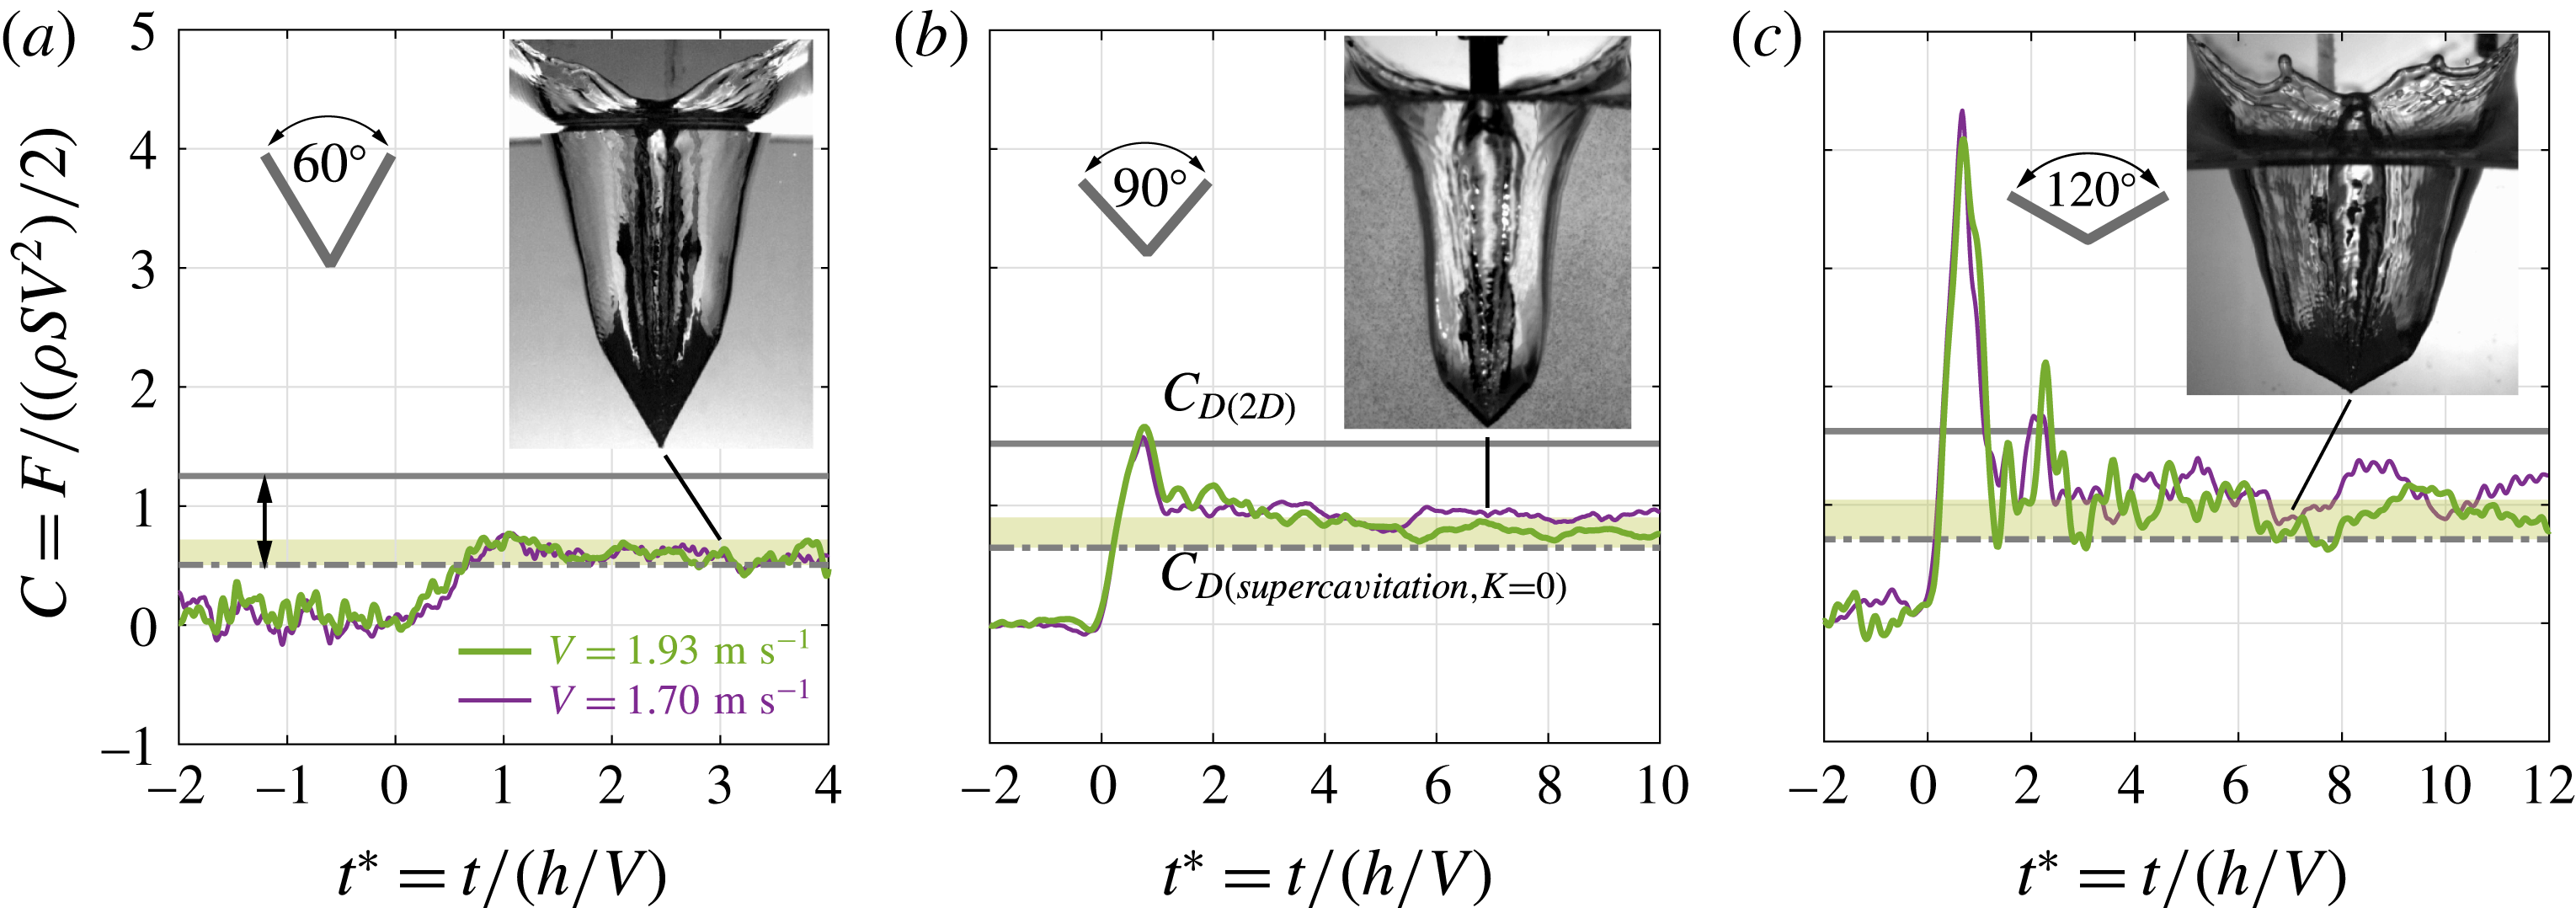
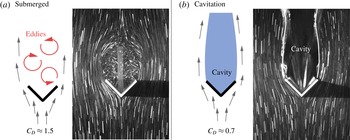
After submersion, the wedge reaches a quasi-steady regime characterized by a relatively small vertical force (figure 4). The measured force (dash-dotted line in figure 4) is significantly lower than the drag force on an immersed wedge of the same angle. The obvious difference between the two cases is the presence of the cavity in the wake of the diving wedge; see figure 5. The cavity has a notable effect on the wake of the wedge. There is no systematic model of how transient cavities affect drag on translating bodies; however, the influence of cavities on drag has been studied extensively in the context of cavitation (Knapp et al.
Reference Knapp, Daily and Hammitt1970). Cavitation studies show that the presence of the cavity induces a dramatic reduction in drag, in the range two to three times. The reduction depends on the cavitation number
 $K=(p_{\infty }-p_{vap})/(\unicode[STIX]{x1D70C}V^{2})/2$
, which compares the drop in Bernoulli pressure
 $(\unicode[STIX]{x1D70C}V^{2})/2$
with the pressure drop needed to reach vapour pressure
 $p_{\infty }-p_{vap}$
in order for cavitation to happen. Here,
 $p_{\infty }$
is the pressure far away from the object. Typically, complete cavitation is reported for values up to
 $K\approx 0.4$
, and partial cavitation happens beyond this value (Knapp et al.
Reference Knapp, Daily and Hammitt1970). Because the cavities in the present work are fully formed, a sensible range of value for
 $K$
is between 0 and 0.4. According to Knapp et al. (Reference Knapp, Daily and Hammitt1970) steady drag coefficients for supercavitating wedges can be expressed as
 $C_{D}=C_{D_{o}}(1+K)$
, with
 $C_{D_{o}}$
ranging from
 $0.489$
to
 $0.745$
for
 $\unicode[STIX]{x1D6FC}=60^{\circ }$
and
 $\unicode[STIX]{x1D6FC}=120^{\circ }$
. The corresponding ranges of
 $C_{D}$
, with
 $K$
varying from 0 to 0.4, are reported as a light khaki zone in figure 4 for each wedge angle. The experimental force measurements exhibit residual oscillations due to the drop mechanism. Oscillations notwithstanding, the predictions proved to be in good agreement with experimental data. It indicates that transient (inertial) cavities affect drag in the same way as cavitation.
Force history on wedges with opening angles
 $\unicode[STIX]{x1D6FC}=60^{\circ },90^{\circ },120^{\circ }$
, in the limit of small hydrostatic effects (
 $Fr>2.8$
). The non-dimensional drag force on the entering wedge is significantly smaller than the corresponding drag coefficients of an immersed wedge (solid grey line); it matches the drag force measured on cavitating wedges (dash-dotted line and green overlay).

Cavity and drag reduction. The presence of a transient cavity induces striking changes in the wedge’s wake and dramatically reduces the drag on the wedge.
 $\unicode[STIX]{x1D6FC}=90^{\circ }$
,
 $V\simeq 1~\text{m}~\text{s}^{-1}$
. Equivalent exposure for both pictures is
 $\unicode[STIX]{x0394}t=12$
ms.

4 Splash model
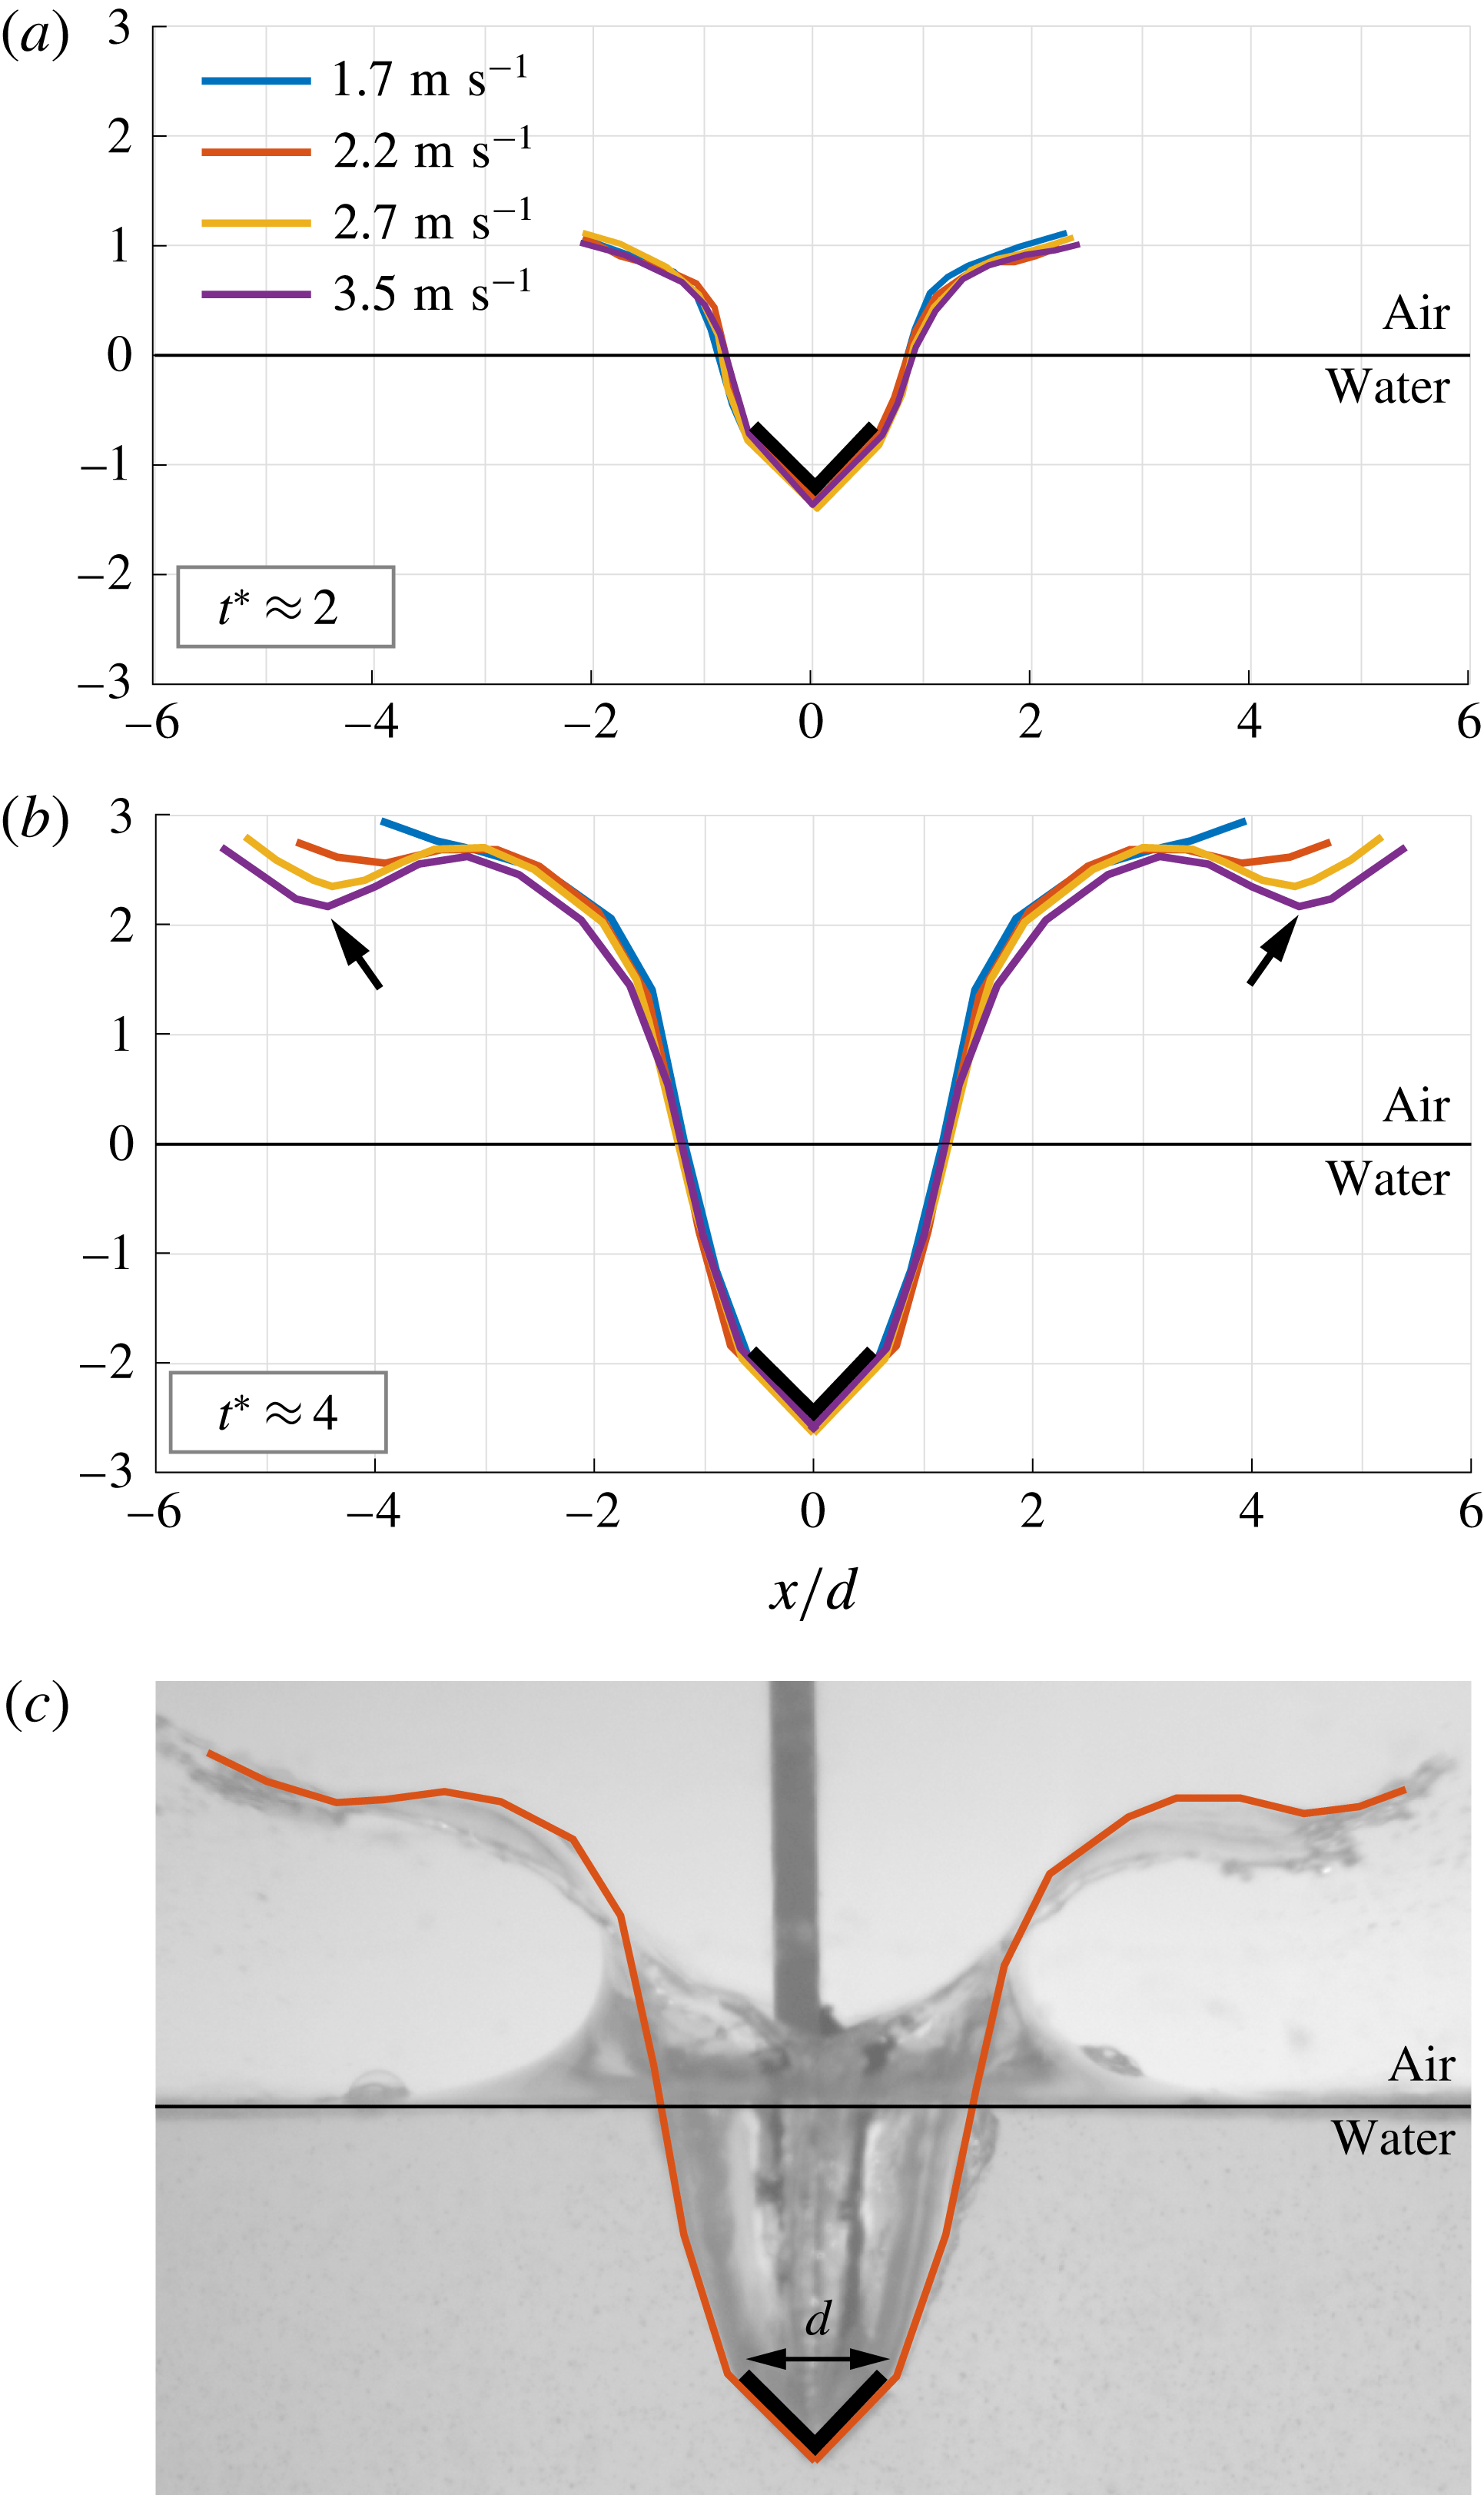
Snapshots of the splash and cavity shapes of a
 $90^{\circ }$
wedge entering water are shown at two time instants
 $t^{\ast }=2$
and
 $t^{\ast }=4$
in figure 6. At
 $t^{\ast }=2$
, the cavity and splash corresponding to different entry velocities
 $V$
have the same form (figure 6
a) but at
 $t^{\ast }=4$
the splashes exhibit notable differences (figure 6
b); at larger entry velocities, splashes extend further and develop a characteristic doubly curved shape that we call ‘arabesque’. The fact that the splashes coincide well at short times but not at longer times suggests that these variations are not due to initial conditions. To investigate the physics of the splash evolution, we develop a one-dimensional model of the splash using first principles and empirical observations.
Shape reconstruction for
 $\unicode[STIX]{x1D6FC}=90^{\circ }$
, at
 $t^{\ast }\approx 2$
(a) and
 $t^{\ast }\approx 4$
(b), in the limit of vanishing gravity effects (
 $V=1.7{-}2.5~\text{m}~\text{s}^{-1}$
,
 $Fr=4{-}8$
). (c) Example of reconstruction for
 $V=2.2~\text{m}~\text{s}^{-1}$
(
 $Fr=5.2$
), at
 $t^{\ast }\approx 4$
. The cavity is self-similar at all times, but the splash develops noticeable differences: as the entry velocity increases, the splash extends further and develops a double curvature. Notice the swelling of the dip (arrows).

4.1 Splash ejection: empirical observations
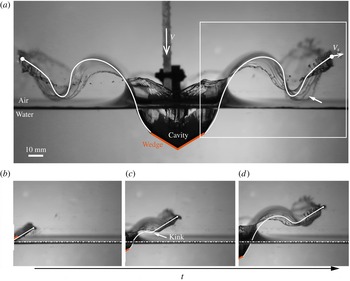
Using high-speed video recordings (see figure 7
a for an example), we systematically measure three relevant parameters of the splash kinematics at short times: the wetted length
 $c$
, jet speed
 $V_{so}$
and jet angle
 $\unicode[STIX]{x1D703}_{o}$
.
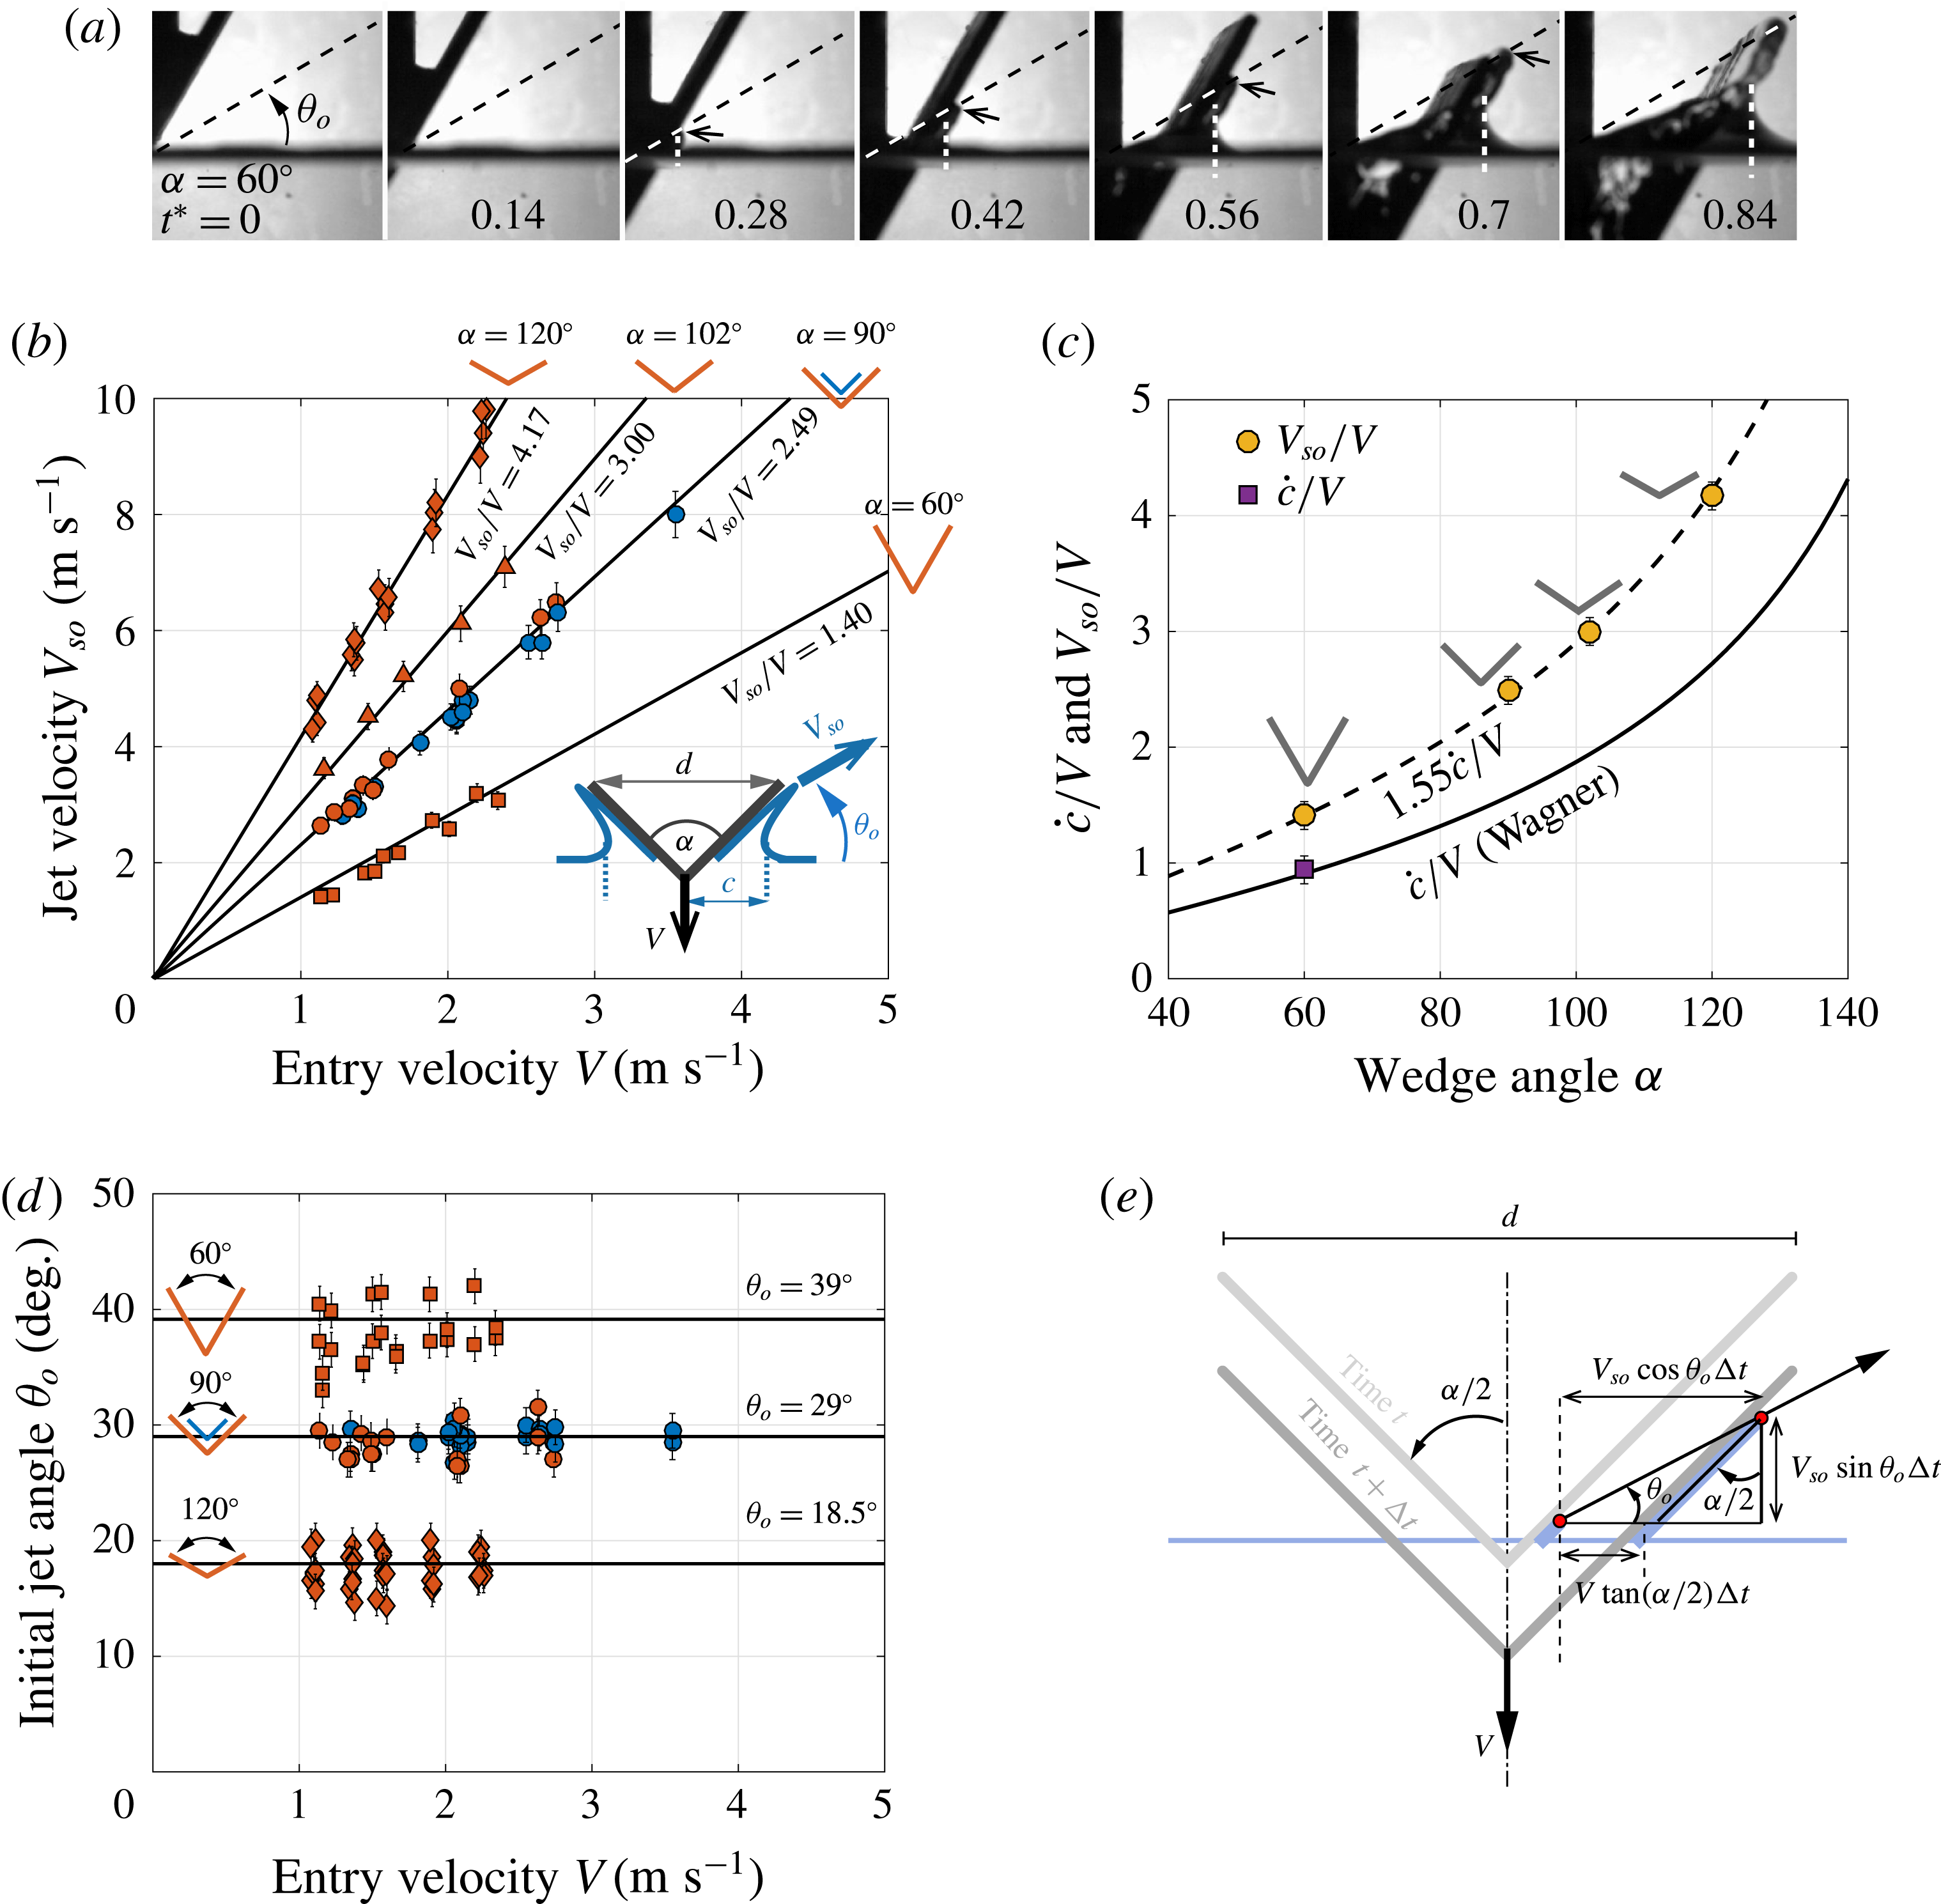
Jet root expansion and jet velocity, measured from high-speed video (a); the vertical white dashed line shows the location of the jet root; the black arrow shows the jet tip. (b) Splash tip velocity
 $V_{so}$
is proportional to entry velocity
 $V$
. (c) The coefficient of proportionality increases with
 $\unicode[STIX]{x1D6FC}$
, and is measured to be
 $1.55\times {\dot{c}}/V$
. (d) The initial jet angle is independent of
 $V$
. (e) Before submersion, the shooting velocity and pitch angle are constant in time, as imposed by the non-penetration condition.

Raw measurements of
 $V_{so}$
as a function of entry velocity
 $V$
are shown in figure 7(b). Clearly,
 $V_{so}$
is linearly proportional to
 $V$
, even at low entry speeds, and the coefficient of proportionality
 $V_{so}/V$
is an increasing function of
 $\unicode[STIX]{x1D6FC}$
. In figure 7(c), we plot
 $V_{so}/V$
versus
 $\unicode[STIX]{x1D6FC}$
and compare it to the expansion speed of the wetted length
 ${\dot{c}}/V$
obtained experimentally (purple squares) and theoretically (solid line) based on equation (3.3):
 $$\begin{eqnarray}{\displaystyle \frac{V_{so}}{V}}=1.55\left({\displaystyle \frac{{\dot{c}}}{V}}\right)={\displaystyle \frac{1.55\unicode[STIX]{x03C0}}{2\tan \unicode[STIX]{x1D6FD}}}.\end{eqnarray}$$
The jet angle
 $\unicode[STIX]{x1D703}_{o}$
between the trajectory of the water particles in the jet and the horizontal axis is reported in figure 7(d). The schematic in figure 7(e) highlights the theoretical predictions of
 $\unicode[STIX]{x1D703}_{o}$
and
 $V_{so}/V$
assuming that the jet stays in contact with the wedge’s surface, leading to the implicit equation for
 $\unicode[STIX]{x1D703}_{o}$
,
 $$\begin{eqnarray}\frac{\tan \unicode[STIX]{x1D6FC}}{\cos \unicode[STIX]{x1D703}_{o}-\sin \unicode[STIX]{x1D703}_{o}\tan \unicode[STIX]{x1D6FC}}={\displaystyle \frac{V_{so}}{V}}.\end{eqnarray}$$
Figure 7(d) shows that the theoretical predictions are in good agreement with the experimental measurements. Taken together, these observations imply that Wagner’s approach allows us to predict both the initial jet tip velocity
 $V_{so}$
and jet ejection angle
 $\unicode[STIX]{x1D703}_{o}$
, given a single corrective parameter (the 1.55 constant) that is independent of
 $\unicode[STIX]{x1D6FC}$
. We are now equipped to tackle the long-term evolution of the splash shape past the initial submersion of the wedge.
4.2 Splash model: kinematics and initial conditions
We develop a discrete fluid particle model of the splash based on the idea that the splash is primarily ballistic. The splash is represented by a succession of discrete particles
 $P_{j}$
,
 $j=1,2,3,\ldots \in \mathbb{N}$
. Particle
 $j$
is located at
 $\boldsymbol{r}_{j}=x(P_{j},t)\boldsymbol{e}_{1}+z(P_{j},t)\boldsymbol{e}_{3}$
, where
 $P_{j}$
is a Lagrangian label of particle
 $j$
, and moves at a velocity
 $\boldsymbol{v}_{j}=v_{x}(P_{j},t)\boldsymbol{e}_{1}+v_{z}(P_{j},t)\boldsymbol{e}_{3}$
under the influence of gravity, surface tension, and aerodynamic forces.
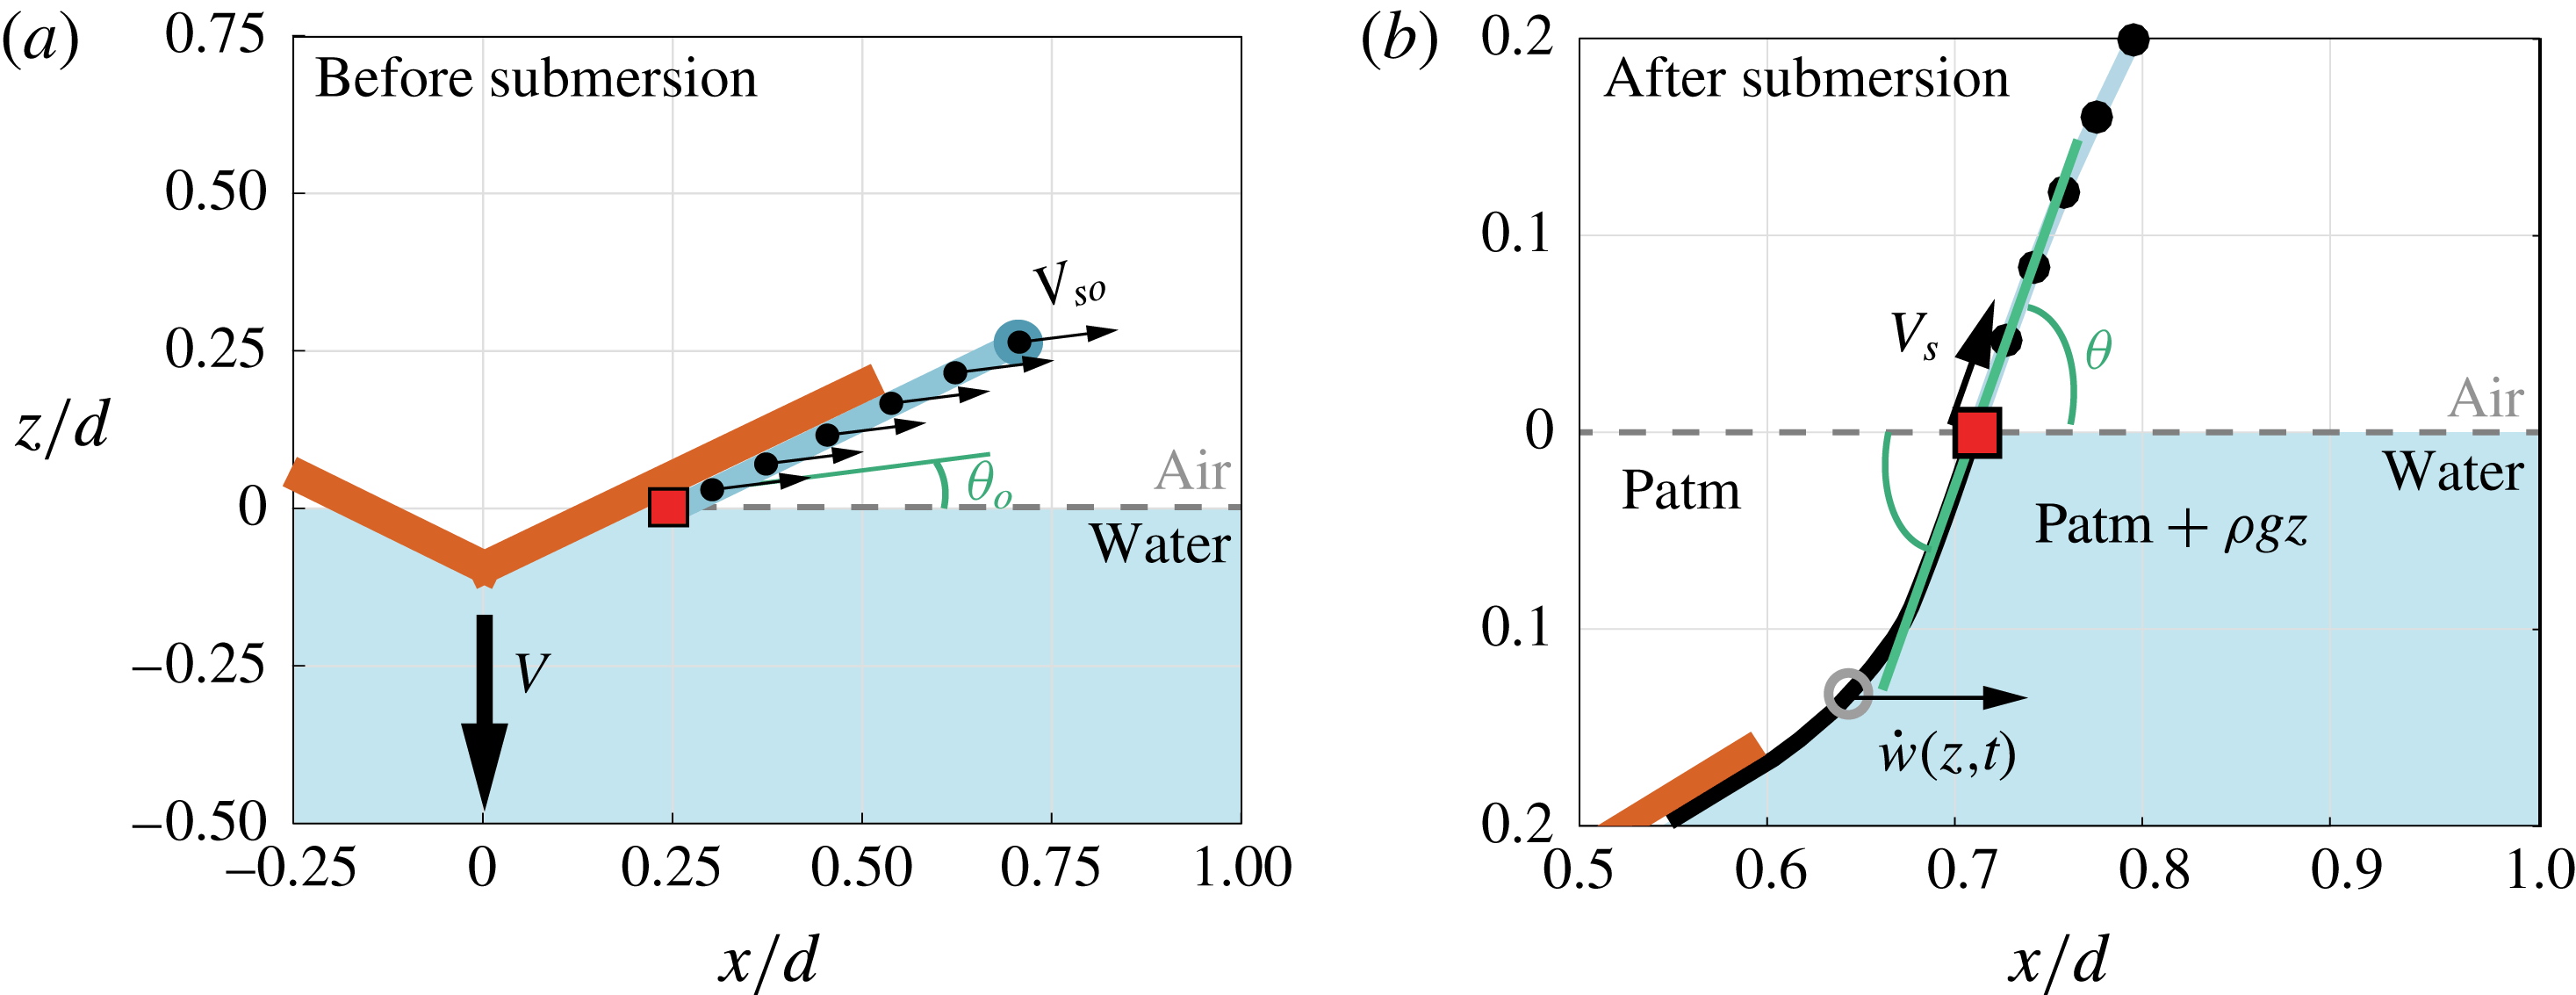
Initial conditions applied to shooting particles. (a) For times before wedge submersion, particles are shot with constant velocity
 $V_{so}$
and angle
 $\unicode[STIX]{x1D703}=\unicode[STIX]{x1D703}_{0}$
. (b) After submersion,
 $\unicode[STIX]{x1D703}$
is adjusted to maintain continuity with the cavity shape, and the shooting velocity
 $V_{s}$
decreases exponentially.

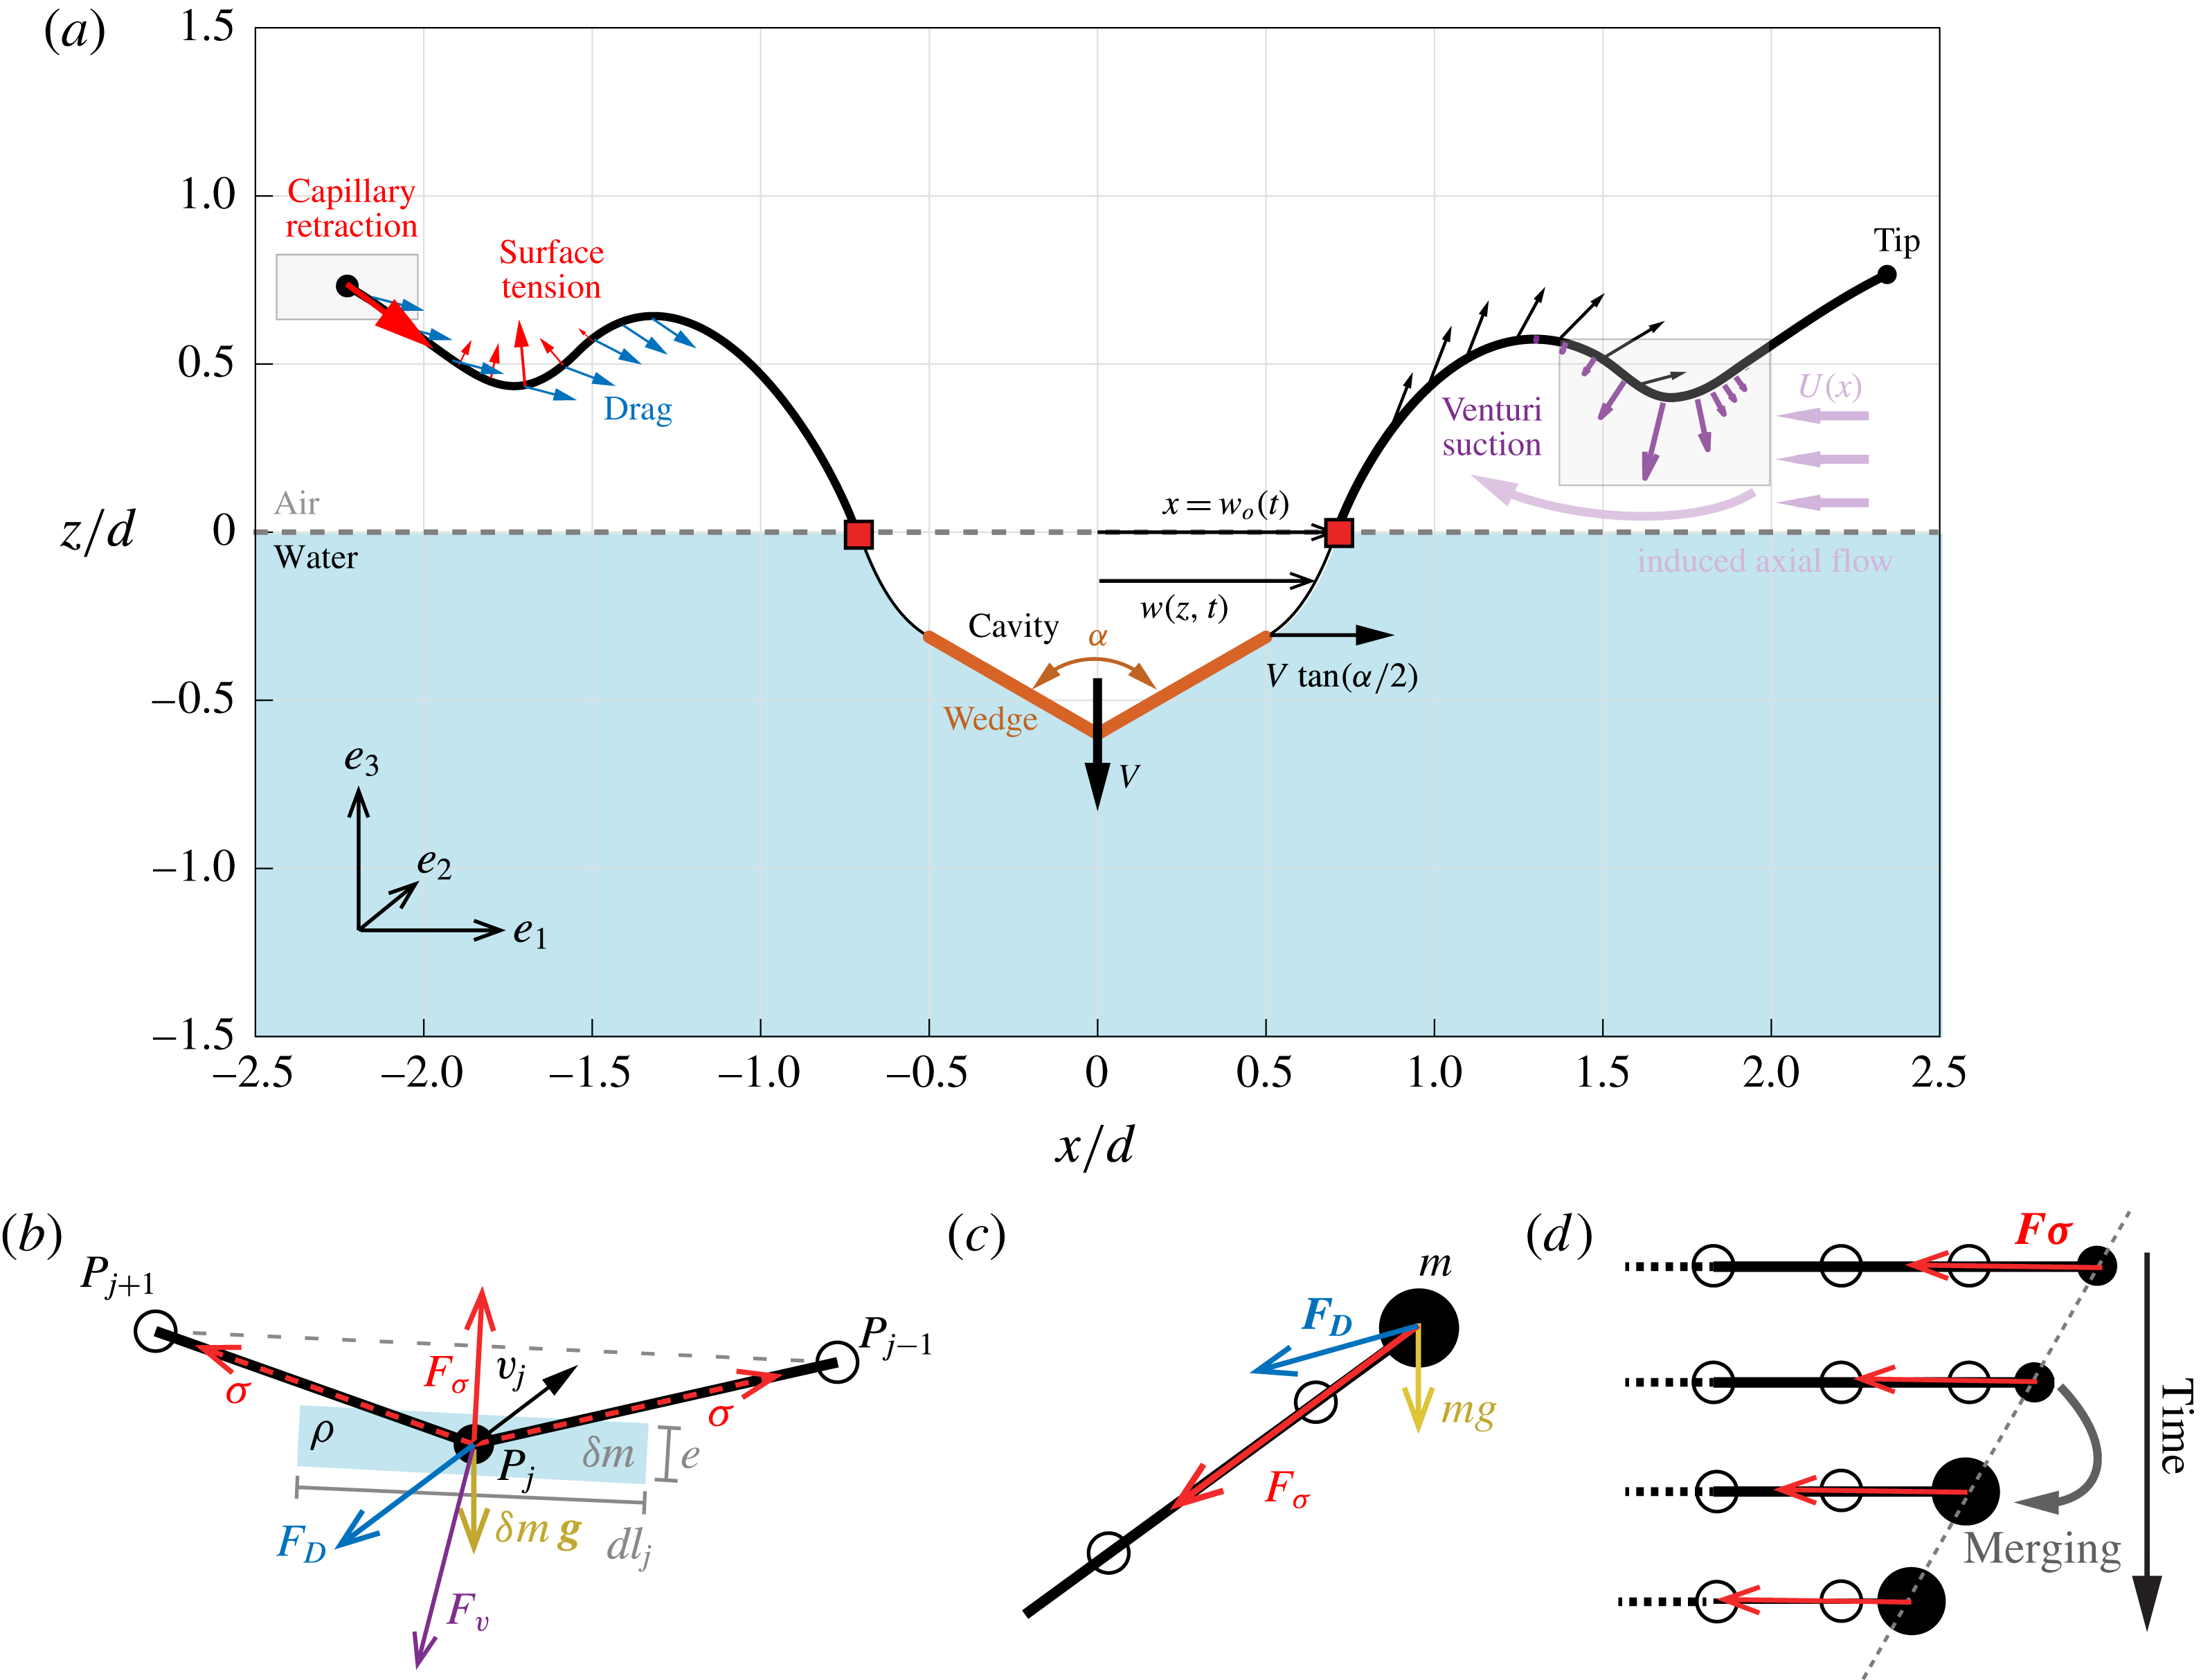
(a) Overview of the model and physical processes. The pitch angle is tied to the cavity local slope, and the shooting velocity decreases exponentially in time. Particles are subject to weight, drag, surface tension, and Venturi-induced suction. (b–d) Schematic representation of forces on an individual particle: (b) anywhere along the splash, and (c) at the tip, where capillary retraction takes place. (d) Initial stages of capillary retraction, showing the first particle merging. A straightforward merging routine allows the retraction speed to quickly converges to the Taylor–Culick velocity
 $V_{\unicode[STIX]{x1D70E}}=\sqrt{2\unicode[STIX]{x1D70E}/\unicode[STIX]{x1D70C}e}$
, independently of the merging threshold.

Particles are initially ejected from the water surface (
 $z=0$
) at a shooting point
 $x(P_{j},t_{j})$
, where
 $t_{j}$
represents the time of ejection of particle
 $j$
. Our goal in this section is to determine the initial conditions, shooting position and velocity, for each particle. To this end, it is convenient to represent the velocity
 $\boldsymbol{v}_{j}$
of particle
 $j$
by its speed
 $V_{s}(P_{j},t)$
and pitch angle
 $\unicode[STIX]{x1D703}(P_{j},t)$
measured from the horizontal.
Before the wedge is fully submerged, we make the assumption that the shooting point is located at the intersection of the undisturbed water surface with the wedge given by
 $x=Vt_{j}\tan (\unicode[STIX]{x1D6FC})$
, and all particles are assumed to eject with the same velocity
 $V_{so}$
and angle
 $\unicode[STIX]{x1D703}_{o}$
(figure 8
a). That is to say, for ejection time
 $t_{j}\leqslant h/V$
, the initial conditions of particle
 $P_{j}$
are given by
 $$\begin{eqnarray}V_{s}(P_{j},t_{j})=V_{so},\quad \unicode[STIX]{x1D703}(P_{j},t_{j})=\unicode[STIX]{x1D703}_{o},\quad x(P_{j},t_{j})=Vt_{j}\tan (\unicode[STIX]{x1D6FC}).\end{eqnarray}$$
This assumption is in agreement with the actual interface shape below the wedge (see figure 7) in that we consider the fluid pile-up as part of the splash.
After submersion,
 $t_{j}\geqslant h/V$
, the shooting point is located at the cavity wall
 $w(z=0)=w_{o}$
, where
 $w$
is the cavity half-width and
 $w_{o}$
is the value of
 $w$
at the free water surface (
 $z=0$
); see figure 8(b). The initial shooting conditions are now dependent on the time of ejection
 $t_{j}$
. Namely, the shooting velocity decreases with time and eventually decays to 0 while the base of the splash becomes steeper with time. We consider the ejection velocity to decrease exponentially such that
 $$\begin{eqnarray}V_{s}(P_{j},t_{j})=V_{so}\text{e}^{-(t_{j}-h/V)/\unicode[STIX]{x1D70F}_{s}},\end{eqnarray}$$
where
 $\unicode[STIX]{x1D70F}_{s}$
is a parameter that we set to
 $\unicode[STIX]{x1D70F}_{s}=0.025/V$
regardless of the wedge angle.
An implicit expression for the initial ejection angle
 $\unicode[STIX]{x1D703}(P_{j},t_{j})$
can be obtained by considering continuity between the slope of the splash and the slope of the cavity
 $w_{o}^{\prime }=\text{d}w/\text{d}z|_{z=0}$
,
 $$\begin{eqnarray}{\displaystyle \frac{V_{s}(P_{j},t_{j})\sin (\unicode[STIX]{x1D703}(P_{j},t_{j}))}{V_{s}(P_{j},t_{j})\cos (\unicode[STIX]{x1D703}(P_{j},t_{j}))-\dot{w_{o}}(t_{j})}}=\tan (w_{o}^{\prime }(t_{j})).\end{eqnarray}$$
Here,
 $\dot{w_{o}}(t_{j})$
and
 $w_{o}^{\prime }(t_{j})$
are, respectively, the horizontal speed and the slope of the cavity at
 $z=0$
and
 $t=t_{j}$
.
To close the system in (4.4) and (4.5), we need a model for the time evolution of the cavity wall
 $w$
. Duclaux et al. (Reference Duclaux, Caille, Duez, Ybert, Bocquet and Clanet2007) applied a slice-averaged model to the transient dynamics of axisymmetric cavities created by spherical or cylindrical bodies. Using an unsteady potential flow model per slice, Duclaux et al. (Reference Duclaux, Caille, Duez, Ybert, Bocquet and Clanet2007) found that the evolution of the cavity radius
 $R$
can be described at each value of
 $z$
by the Rayleigh–Plesset equation,
 $R\ddot{R}+(3/2){\dot{R}}^{2}=\unicode[STIX]{x0394}p$
, where
 $\unicode[STIX]{x0394}p=-gz$
is the pressure difference between the inside and the outside of the cavity at depth
 $z$
, assuming atmospheric pressure inside the cavity. This equation is not directly applicable to wedges – one would have to derive a new analytic expression for the slice-averaged flow potential assuming the wedge is infinitely long. However, because our wedges have a relatively short aspect ratio
 $L/d$
, we make the assumption that the equation derived in Duclaux et al. (Reference Duclaux, Caille, Duez, Ybert, Bocquet and Clanet2007) applies in a modified form. Namely, we postulate that
 $$\begin{eqnarray}w\ddot{w}+{\textstyle \frac{3}{2}}C_{c}{\dot{w}}^{2}=-gz,\end{eqnarray}$$
where
 $C_{c}$
is an ad hoc parameter (equal to 1 for axisymmetric cavities). By definition,
 $C_{c}$
is independent of
 $V$
, but we expect it to depend on the geometry of the wedge, represented by the aspect ratio
 $L/d$
and opening angle
 $\unicode[STIX]{x1D6FC}$
. The value of
 $C_{c}$
is adjusted for each wedge, by matching the cavity dynamics to high-speed experimental images. To obtain the cavity dynamics, we solve (4.6) per slice for all slices from the top of the submerged wedge to the undisturbed water surface subject to initial conditions
 $w(t=0)=d/2$
and
 ${\dot{w}}(t=0)=V\tan \unicode[STIX]{x1D6FC}$
.
Put together, equations (4.4), (4.5) and (4.6) form a closed set of equations that determine the initial conditions
 $V_{s}(P_{j},t_{j})$
,
 $\unicode[STIX]{x1D703}(P_{j},t_{j})$
and
 $x(P_{j},t_{j})$
for the ejection of particle
 $P_{j}$
for
 $t_{j}\geqslant h/V$
.
4.3 Splash model: force balance
Figure 9(a) shows an overview of the physical processes affecting the splash and the cavity evolution during water entry. Particles are shot at regular intervals of time in such a way to be initially separated by a constant distance
 $d\ell _{o}$
. The mass per unit length attributed to each particle is
 $\unicode[STIX]{x1D6FF}m=\unicode[STIX]{x1D70C}e_{o}d\ell _{o}$
, where
 $e_{o}$
is the initial thickness of the splash sheet, assumed to be constant during splash ejection. Each particle is subject to the following forces: weight
 $\unicode[STIX]{x1D6FF}m\,\boldsymbol{g}$
, drag
 $\boldsymbol{F}_{\boldsymbol{D}}$
, surface tension
 $\boldsymbol{F}_{\unicode[STIX]{x1D748}}$
, and a Venturi-induced suction
 $\boldsymbol{F}_{\boldsymbol{V}}$
. All forces are expressed per unit length of the splash sheet unless otherwise stated. The force balance on particle
 $j$
is given by
 $$\begin{eqnarray}\unicode[STIX]{x1D6FF}m\frac{\text{d}\boldsymbol{v}_{j}}{\text{d}t}=\unicode[STIX]{x1D6FF}m\,\boldsymbol{g}+\boldsymbol{F}_{\boldsymbol{D}}+\boldsymbol{F}_{\unicode[STIX]{x1D748}}+\boldsymbol{F}_{\boldsymbol{V}}.\end{eqnarray}$$
Drag
 $\boldsymbol{F}_{\boldsymbol{D}}$
on particle
 $j$
is calculated by considering the splash segment
 $\unicode[STIX]{x0394}\boldsymbol{r}_{j}=\boldsymbol{r}_{j-1}-\boldsymbol{r}_{j+1}$
of length
 $d\ell _{j}=\Vert \unicode[STIX]{x0394}\boldsymbol{r}_{j}\Vert$
, moving with velocity
 $\boldsymbol{v}_{j}$
at an angle of attack
 $\unicode[STIX]{x1D713}_{j}$
defined as the angle between
 $\boldsymbol{v}_{j}$
and
 $\unicode[STIX]{x0394}\boldsymbol{r}_{j}$
. This leads to (Andersen, Pesavento & Wang Reference Andersen, Pesavento and Wang2005)
 $$\begin{eqnarray}\boldsymbol{F}_{\boldsymbol{D}}=-{\textstyle \frac{1}{2}}C_{D}\sin ^{2}(\unicode[STIX]{x1D713}_{j})\unicode[STIX]{x1D70C}_{a}d\ell _{j}\Vert \boldsymbol{v}_{j}\Vert \boldsymbol{v}_{j}.\end{eqnarray}$$
Here,
 $C_{D}$
designates the drag coefficient for when the element is perpendicular to the incoming flow, which we fix at
 $C_{D}=2.5$
for all experiments. The drag force is calculated using the absolute travelling velocity of the fluid particle, and not its velocity relative to the ambient air. The effect of the air flow is considered independently in the Venturi-suction force made explicit later on in this section.
Surface tension is accounted for in the most straightforward way: each particle experiences a longitudinal traction of magnitude
 $\unicode[STIX]{x1D70E}$
from its closest neighbours, as represented in figure 9(b). For
 $j\neq 1$
, one has
 $$\begin{eqnarray}\boldsymbol{F}_{\unicode[STIX]{x1D748}}=\unicode[STIX]{x1D70E}\left(\frac{\boldsymbol{r}_{j-1}-\boldsymbol{r}_{j}}{\Vert \boldsymbol{r}_{j-1}-\boldsymbol{r}_{j}\Vert }+\frac{\boldsymbol{r}_{j}-\boldsymbol{r}_{j+1}}{\Vert \boldsymbol{r}_{j}-\boldsymbol{r}_{j+1}\Vert }\right).\end{eqnarray}$$
This force is normal to the local tangent
 $\unicode[STIX]{x0394}\boldsymbol{r}_{j}$
, and acts as a restoring force: it tends to cancel any shape curvature. The particle at the tip (
 $j=1$
) is a particular case: surface tension results in only one longitudinal force directed towards its next neighbour, leading to the retraction of the particle at the tip (figure 9
c). This retraction is observed in systems such as free sheets and ligaments (Marmottant & Villermaux Reference Marmottant and Villermaux2004; Lhuissier & Villermaux Reference Lhuissier and Villermaux2009). The speed of retraction, relative to the sheet, is constant and known as the Taylor–Culick velocity
 $V_{\unicode[STIX]{x1D70E}}=\sqrt{2\unicode[STIX]{x1D70E}/\unicode[STIX]{x1D70C}e}$
(Taylor Reference Taylor1959; Culick Reference Culick1960). To account for capillary retraction in our model, the receding particle of initial mass
 $\unicode[STIX]{x1D6FF}m$
has to merge with its successive closer neighbours, as shown in figure 9(d). When merging happens, (i) the new particle’s mass increases by
 $\unicode[STIX]{x1D6FF}m$
, (ii) the new particle is positioned at the centre of mass of the two former particles, and (iii) the new particle’s momentum is the sum of the momentum of the two former ones. Given these conditions, we observe that the retraction speed of the tip particle quickly converged to
 $V_{\unicode[STIX]{x1D70E}}$
, independently of the merging criteria (interparticle distance).
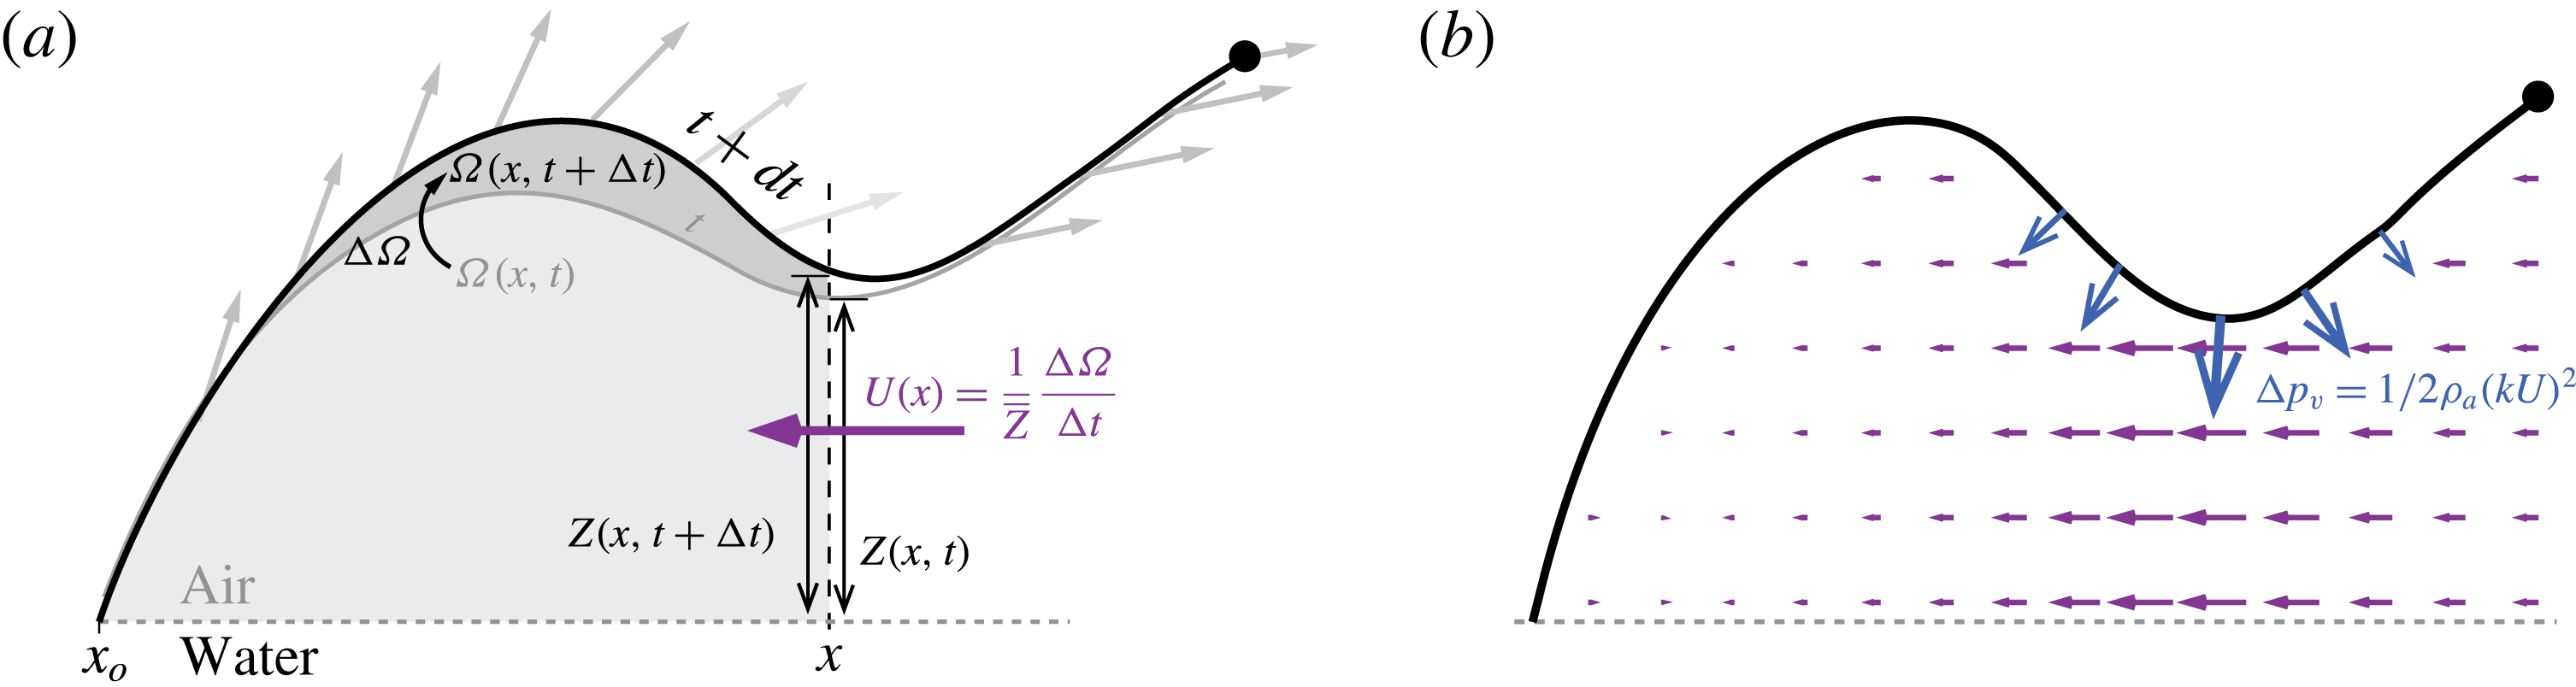
(a) Average axial velocity into the chamber is determined using volume conservation. (b) Typical calculated axial flow field (purple) and resulting suction force on the sheet (blue).

The Venturi-induced suction force
 $\boldsymbol{F}_{\boldsymbol{V}}$
has a significant effect on the late-stage development of the sheet. This suction happens because the motion of the splash dome induces an axial flow of air rushing in to fill the expanding chamber beneath it, as represented in figure 10. The air is accelerated through the gap between the undisturbed water surface and the lower part of the splash, causing the pressure to drop and generating a downward suction. To calculate this suction force, we begin by evaluating the volume
 $\unicode[STIX]{x1D6FA}(x,t)$
of the chamber under the splash
 $$\begin{eqnarray}\unicode[STIX]{x1D6FA}(x,t)=\int _{x_{o}}^{x}Z(\tilde{x},t)\,\text{d}\tilde{x},\end{eqnarray}$$
where
 $x_{o}$
is the position of the base of the splash and
 $Z(x,t)$
refers to the local height of the splash above the free water surface. Assuming the chamber is two-dimensional – that is, no flow in the direction perpendicular to the drawing plane – the average volume change
 $\unicode[STIX]{x0394}\unicode[STIX]{x1D6FA}(x,t)=\unicode[STIX]{x1D6FA}(x,t+\unicode[STIX]{x0394}t)-\unicode[STIX]{x1D6FA}(x,t)$
of the splash is related to the average flow
 $U(x,t)$
passing through the section
 $\bar{Z}=([Z(x,t)+Z(x,t+\unicode[STIX]{x0394}t)])/2$
, yielding
 $$\begin{eqnarray}U={\displaystyle \frac{1}{\bar{Z}}}{\displaystyle \frac{\unicode[STIX]{x0394}\unicode[STIX]{x1D6FA}}{\unicode[STIX]{x0394}t}}.\end{eqnarray}$$
Using Bernoulli’s principle between a position far away from the splash and the bottom of the sheet, we can estimate the pressure drop as
 $\unicode[STIX]{x0394}p_{v}=-(\unicode[STIX]{x1D70C}_{a}(kU)^{2})/2$
, where
 $kU$
is the corrected axial velocity. The correction factor
 $k$
accounts for the difference between the real system and the idealized model, including non-uniformity of this velocity in the vertical direction and three-dimensional effects. We expect
 $k$
to depend on
 $\unicode[STIX]{x1D6FC}$
:
 $k$
converges to
 $1$
as
 $\unicode[STIX]{x1D6FC}$
approaches
 $180^{\circ }$
because the splash evolves closer to the water surface and the lubrication approximation becomes more justified. We set
 $k=1.5$
for all computations presented in § 5 (
 $\unicode[STIX]{x1D6FC}=120^{\circ }$
). The magnitude of the suction force
 $\boldsymbol{F}_{\boldsymbol{V}}$
at particle
 $P_{j}$
is given by
 $\unicode[STIX]{x0394}p_{v}d\ell _{j}$
, where
 $\unicode[STIX]{x0394}p_{v}$
is evaluated at
 $x=x(P_{j},t)$
and
 $d\ell _{j}=\Vert \unicode[STIX]{x0394}\boldsymbol{r}_{j}\Vert$
, as previously defined. The direction of
 $\boldsymbol{F}_{\boldsymbol{V}}$
is along the local normal
 $\unicode[STIX]{x0394}\boldsymbol{r}_{j}^{\bot }/\Vert \unicode[STIX]{x0394}\boldsymbol{r}_{j}\Vert$
to the sheet, namely,
 $$\begin{eqnarray}\boldsymbol{F}_{\boldsymbol{V}}=-{\textstyle \frac{1}{2}}\unicode[STIX]{x1D70C}_{a}(kU)^{2}\unicode[STIX]{x0394}\boldsymbol{r}_{j}^{\bot }.\end{eqnarray}$$
We substitute expressions (4.8), (4.9) and (4.12) for
 $\boldsymbol{F}_{\boldsymbol{D}}$
,
 $\boldsymbol{F}_{\unicode[STIX]{x1D748}}$
and
 $\boldsymbol{F}_{\boldsymbol{V}}$
into (4.7). The resulting equations are integrated using an explicit forward Euler method with typical time step
 $dt=10^{-6}~\text{s}$
. The initial distance between particles
 $d\ell _{o}=100~\unicode[STIX]{x03BC}\text{m}$
is chosen to be of the order of the sheet thickness.
5 Splash evolution
Figure 11 presents the evolution of the splash following the impact of a
 $120^{\circ }$
wedge of width
 $d=36$
mm on the water surface at
 $V=1.92~\text{m}~\text{s}^{-1}$
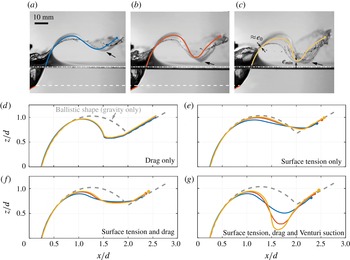
. The ejecta deforms into a fairly complex shape, characterized by two inversions of curvature from its base to its rim. Of particular interest is the formation of a dip, resulting from the strong downward pull of the thinnest and lowest part of the splash. As we demonstrate in the following, the existence of this singular feature is tied to two key ingredients: the generation of a kink at short times and the growth of this kink, favoured by aerodynamics and hindered by surface tension (figure 11
b–d). We also show that for moderate and large wedge angles, the Venturi effect is the dominant aerodynamic force driving the splash deformation.
(a) Snapshot taken 15 ms after impact of a
 $\unicode[STIX]{x1D6FC}=120^{\circ }$
wedge in water at
 $V=1.92~\text{m}~\text{s}^{-1}$
, and (b–d) preceding time evolution of the splash sheet; snapshots are
 $3.1$
ms apart. The leading part of the sheet is ejected with a speed
 $V_{s}\approx 4.5~\text{m}~\text{s}^{-1}$
. Note the strong downward suction of part of the splash sheet (white arrows) leading to its rapid fragmentation (see also supplementary movie 2). Computed shapes are superimposed in white.

(a–c) Experimental snapshots and corresponding computed shapes taken at
 $t^{\ast }=t/(h/V)\approx 2.8$
after impact for increasing impact velocity
 $V$
:
 $1.11,1.53,1.92~\text{m}~\text{s}^{-1}$
. Note that the dip in the splash sheet (black arrow) gradually swells as velocity increases. Panel (c) shows the last computable shape at
 $t^{\ast }\approx 2.6$
, for which the thinning ratio is
 $e_{min}/e_{o}\approx 1/30$
. (d–g) Quantification of the effect of the various forces. While neither drag or surface tension can account for the bending, Venturi-mediated suction does.

To highlight the effect of entry velocity, we reproduce in figure 12(a–c) three snapshots for gradually increasing entry velocity
 $V=1.11$
,
 $1.53$
and
 $1.92~\text{m}~\text{s}^{-1}$
, taken at the same dimensionless time
 $t^{\ast }=2.8$
. The snapshots are similar in many ways. Looking below the free water surface, the wedge’s penetration and cavity shapes are virtually the same. Above the free surface, the splash shapes share some similarities. For instance, the sheet rim, at the far right of each picture, is nearly at the same location. There is, however, one major difference between the three snapshots: the depth of the depression. In figure 12(a), the lowest part of the dip is at approximately half the height of the dome, while in figure 12(c), the depression nearly reaches the water surface. This difference can be, erroneously, attributed to the effect of drag on the fast-moving sheet. We shall show that this idea is essentially wrong, and while drag does have a significant effect on the water sheet, it only contributes little to the strong downward pull the dip of the splash sheet is subject to. Figure 12(d–g) uses our model to quantify the effect of various forces on the splash shape. Drag and surface tension, alone or combined, generate splash shapes that are nearly identical at different entry velocities (labelled by colour in figure 12). Venturi suction is needed to be able to reproduce correctly the observed shapes and variation with
 $V$
: the splash shape resulting from incorporating all forces is superimposed onto figure 12(a), showing excellent agreement between the one-dimensional model and the experimental observations.
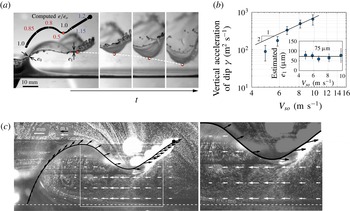
(a,b) Quantification of the strong downward pull on the thinnest (
 $e/e_{o}\approx 0.5$
) part of splash sheet. When surface tension effects are negligible, the acceleration is proportional to
 $V_{so}^{2}$
, suggesting a purely aerodynamic force. Assuming the associated aerodynamic pressure scales as
 $(\unicode[STIX]{x1D70C}_{a}V_{s}^{2})/2$
leads to an indirect estimate of the sheet thickness
 $e_{o}$
. (c) Visualization of the fluid motion around the splash at
 $t^{\ast }=0.7$
for
 $V=1.36~\text{m}~\text{s}^{-1}$
using oil droplets, highlighting the axial flow into the expanding chamber beneath the splash sheet (see also supplementary movie 2). The estimated average axial velocity (white) from mass conservation show good qualitative agreement with the experiment. The splash sheet and the velocity of individual particles within the sheet as shown in black.

5.1 Splash depression
In order to elucidate the nature of the vertical force causing the depression in the splash sheet, we examine the dynamics of the dip. In figure 13(a,b), we measure the vertical acceleration
 $\unicode[STIX]{x1D6FE}$
of a marker located at the local minima in the dip, designated by a red dot. The measurements are taken shortly after the downward dip becomes clear, in the time interval between the first two snapshots of figure 13. We find that acceleration is an increasing function of the splash velocity
 $V_{s}$
and, consequently, of
 $V$
, with values well above the gravitational acceleration: approximately
 $10g$
for the slowest velocity and up to
 $90g$
for
 $V_{s}=2.35~\text{m}~\text{s}^{-1}$
. Importantly, we find that for
 $V_{s}>7$
,
 $\unicode[STIX]{x1D6FE}$
is proportional to
 $V_{s}^{2}$
, suggesting the downward force has an aerodynamic origin.
We push the analysis further in order to determine the local thickness
 $e_{1}$
(and, thus, the initial thickness
 $e_{o}$
) and to derive a criterion for the growth of the dip. To this end, we write the force balance in the vertical direction on a small fluid element of length
 $d\ell$
, width
 $L$
and thickness
 $e_{1}$
. The forces are drag
 $\boldsymbol{F}_{D}$
, surface tension
 $\boldsymbol{F}_{\unicode[STIX]{x1D70E}}$
acting upwards, and an aerodynamically related downward suction
 $\boldsymbol{F}_{V}=(\unicode[STIX]{x1D70C}_{a}d\ell LV_{s}^{2})/2$
. We ignore
 $\boldsymbol{F}_{D}$
because the vertical velocity of the marker is at least five times smaller than
 $V_{s}$
. We are left with the force balance in the vertical direction
 $\unicode[STIX]{x1D70C}e_{1}Ld\ell \unicode[STIX]{x1D6FE}=\boldsymbol{F}_{\unicode[STIX]{x1D70E}}-\boldsymbol{F}_{V}$
. Dividing throughout by
 $Ld\ell$
, we get the balance law in terms of the pressure difference between a capillary contribution
 $\unicode[STIX]{x0394}p_{\unicode[STIX]{x1D70E}}$
and an aerodynamic contribution
 $\unicode[STIX]{x0394}p_{V}=(\unicode[STIX]{x1D70C}_{a}V_{s}^{2})/2$
,
 $$\begin{eqnarray}\unicode[STIX]{x1D70C}e_{1}\unicode[STIX]{x1D6FE}=-\unicode[STIX]{x0394}p_{\unicode[STIX]{x1D70E}}+\unicode[STIX]{x0394}p_{V}.\end{eqnarray}$$
From (5.1), we expect the growth of the dip to be inhibited when the restoring effect of surface tension overcomes the destabilizing effect of the suction pressure.
To derive a criterion for predicting the dip growth, we assume that the local radius of curvature of the splash scales as the wedge’s lateral size
 $d$
, in qualitative agreement with observation. The capillary pressure contribution is thus
 $\unicode[STIX]{x0394}p_{\unicode[STIX]{x1D70E}}\approx 2\unicode[STIX]{x1D70E}/d$
across the two interfaces. Substituting into (5.1), we get the following criteria for the growth of the dip:
 $(\unicode[STIX]{x1D70C}_{a}V_{so}^{2}>2\unicode[STIX]{x1D70E}/d)/2$
. For
 $d=36$
mm and
 $\unicode[STIX]{x1D70C}_{a}=1.25~\text{Kg}~\text{m}^{-3}$
, the criteria yield
 $V_{so}>2.5~\text{m}~\text{s}^{-1}$
. Our experimental trials correspond to
 $V_{so}$
between 4 and
 $10~\text{m}~\text{s}^{-1}$
, for which we always see dip growth, as expected. This criterion corresponds to
 $We_{a}>4$
when rewritten in terms of a modified Weber number
 $We_{a}=\unicode[STIX]{x1D70C}_{a}V_{so}^{2}d/\unicode[STIX]{x1D70E}$
. Unlike the Weber number commonly used in impact problems,
 $We_{a}$
depends on the density of air instead of water.
Equation (5.1) also yields an estimate of the local thickness
 $e_{1}=((\unicode[STIX]{x1D70C}_{a}V_{so}^{2}-2\unicode[STIX]{x1D70E}/d)/2)/\unicode[STIX]{x1D70C}\unicode[STIX]{x1D6FE}$
. A value of
 $e_{1}\approx 75~\unicode[STIX]{x03BC}\text{m}$
is obtained based on this expression; see inset of figure 13(b). We estimate
 $e_{1}/e_{0}\simeq 0.5$
and obtain
 $e_{0}\approx 150~\unicode[STIX]{x03BC}\text{m}$
, which is the value we adopted for all computational results presented in this work.
Figure 13(c) shows the flow visualization below the splash and validates the presence of a strong inward flow, at least of the same magnitude as the splash tip velocity. The relative variation of the horizontal magnitude is in good agreement with our model based on mass conservation, showing in particular a maximum below the dip.
5.2 Effect of non-dimensional parameters on splash shape
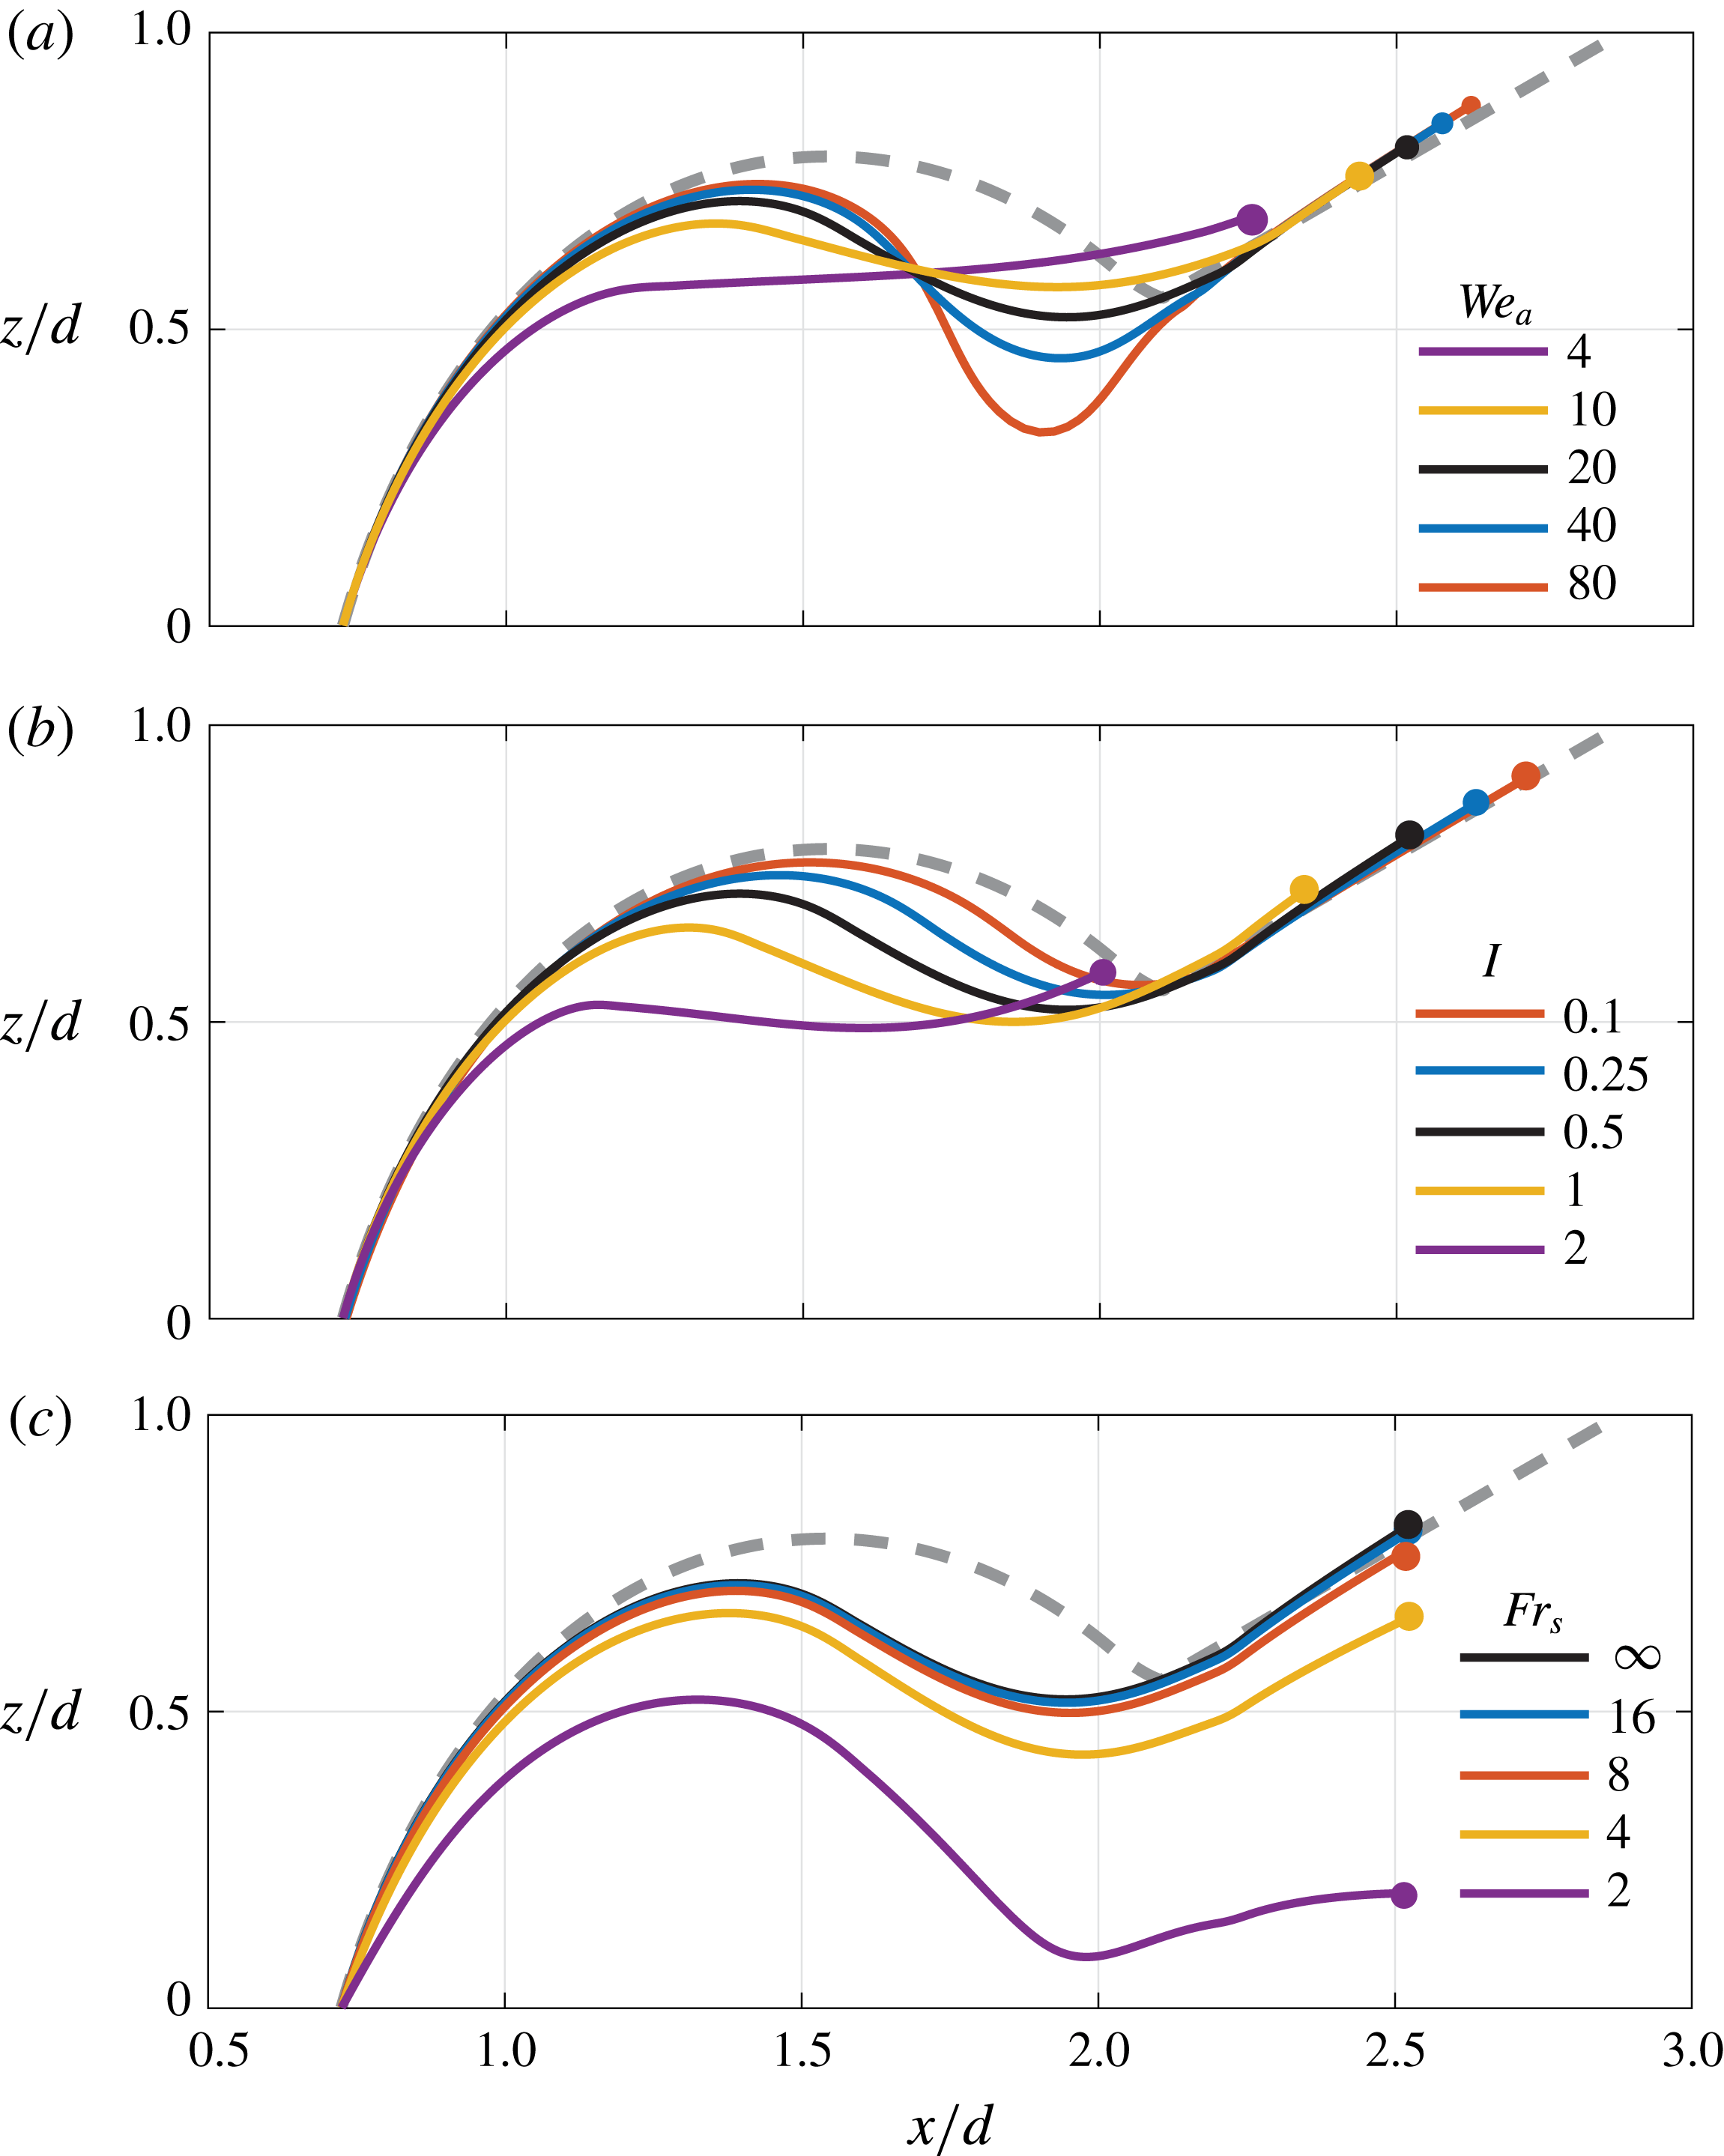
The modified Weber number
 $We_{a}$
reflects the competition between surface tension and aerodynamic suction. Figure 14(a) shows a schematic of the expected splash shapes for various
 $We_{a}$
. For low
 $We_{a}$
, the splash is shorter due to capillary retraction, and flatter because surface tension prevents the bending of the liquid sheet. For larger Weber numbers, the bending becomes more pronounced and the splash shapes reach further.
There are, however, two other effects that the splash shape depends on: drag and gravity. The primary effect of drag is to slow down the splash, in a fairly uniform fashion. One way to estimate the effect of drag on the splash shape is to calculate the relative deceleration of a particle along its trajectory. Let us consider the motion of a slice of splash, of mass
 $\unicode[STIX]{x1D6FF}m=\unicode[STIX]{x1D70C}e_{o}d\ell$
, travelling at velocity
 $v$
, over a distance proportional
 $d$
, and subject to a drag force
 $\boldsymbol{F}_{D}=(C_{D}\unicode[STIX]{x1D70C}_{a}d\ell v^{2})/2$
. According to Newton’s second law of motion, the deceleration can be approximated by
 $\unicode[STIX]{x1D70C}e_{o}\unicode[STIX]{x0394}v/\unicode[STIX]{x0394}t=(C_{D}\unicode[STIX]{x1D70C}_{a}v^{2})/2$
, which leads to, upon substituting
 $\unicode[STIX]{x0394}t\approx d/v$
,
 $$\begin{eqnarray}\frac{\unicode[STIX]{x0394}v}{v}\approx \frac{1}{2}C_{D}\frac{\unicode[STIX]{x1D70C}_{a}}{\unicode[STIX]{x1D70C}}\frac{d}{e_{o}}=\frac{I}{2}.\end{eqnarray}$$
The quantity
 $I$
is independent of
 $v$
and thus of the entry velocity
 $V$
, emphasizing that drag is not responsible for the various degrees of splash bending observed for different entry velocities
 $V$
. However, the shape of the splash is affected by changing
 $I$
, either by varying the air–water densities or by changing the dimensions of the wedge. Figure 14(b) shows the effect of
 $I$
on the splash shape. Smaller
 $I$
(thinner or lighter sheet) produces shorter splashes, without affecting the shape of the splash itself.
Lastly, we redefine a Froude number based on the splash velocity,
 $Fr_{s}=V_{so}/\sqrt{gd}$
, which reflects the competition between inertia and gravity. Figure 14(c) shows that decreasing
 $Fr_{s}$
(increasing gravity) induces a global downward motion and tilting of the whole splash. Significant differences are expected starting at
 $Fr_{s}=4$
. The experiments presented before are in the range
 $Fr_{s}=7.7{-}15$
, confirming gravity has indeed negligible impact on the splash shapes considered here.
Snapshots of the predicted shapes taken at
 $t^{\ast }=2.5$
showing the effect of the three non-dimensional parameters affecting the splash shape: (a)
 $We_{a}=\unicode[STIX]{x1D70C}_{a}V_{so}^{2}d/\unicode[STIX]{x1D70E}$
, (b)
 $I=C_{D}(\unicode[STIX]{x1D70C}_{a}/\unicode[STIX]{x1D70C})d/e_{o}$
and (c)
 $Fr_{s}=V_{so}/\sqrt{gd}$
.

5.3 Sheet fragmentation
The strong downward pull locally stretches the water sheet. To estimate the stretching ratio, given the initial sheet thickness that we estimated in the previous section (
 $e_{o}=150~\unicode[STIX]{x03BC}\text{m}$
), we need an estimate of the sheet thickness
 $e_{min}$
of the splash sheet at its lowest and thinnest point. Fortunately, we have access to
 $e_{min}$
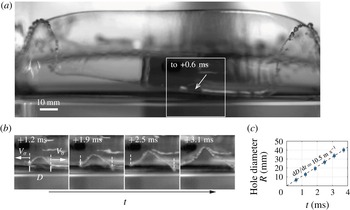
by observing a spontaneous puncture of the sheet. Figure 15 presents the time sequence of the expansion of a hole in the bottom of the sheet at
 $t^{\ast }\approx 2.5$
. The hole expands in all directions at a velocity
 $V_{\unicode[STIX]{x1D70E}}=\sqrt{2\unicode[STIX]{x1D70E}/\unicode[STIX]{x1D70C}e_{min}}$
, known as the Taylor–Culick velocity (Taylor Reference Taylor1959; Culick Reference Culick1960). We measure
 $V_{\unicode[STIX]{x1D70E}}=5.25\pm 0.05~\text{m}~\text{s}^{-1}$
and calculate
 $e_{min}=5.1\pm 0.3~\unicode[STIX]{x03BC}\text{m}$
. This is approximately 30 times smaller than the estimated
 $e_{o}$
, in agreement with the maximum stretching ratio of last computable shapes of figure 12(c) (
 $e_{min}/e_{o}\approx 50$
). More importantly, it underlines the dramatic stretching induced by the downward suction. These calculations are the first steps towards developing a low-order model of fragmentation to be pursued in future work.
(a,b) Front view of the splash at
 $t^{\ast }\approx 0.85$
for
 $V=1.15~\text{m}~\text{s}^{-1}$
showing the spontaneous opening of a hole on the thinnest part of the dip. (c) The hole expansion velocity is
 $2V_{\unicode[STIX]{x1D70E}}$
, where
 $V_{\unicode[STIX]{x1D70E}}=\sqrt{2\unicode[STIX]{x1D70E}/\unicode[STIX]{x1D70C}_{a}e_{min}}$
is the Taylor–Culick velocity, and provides an indirect measurement of the local sheet thickness
 $e_{min}\approx 5~\unicode[STIX]{x03BC}\text{m}$
,
 $30$
times smaller than the estimated initial sheet thickness
 $e_{o}$
.

6 Conclusion
We considered the dynamics of diving wedges. In the first part, we studied the force applied to the wedges during entry. We showed that while sharp wedges enter the water smoothly, obtuse wedges experience a large transient peak force before total submersion. The transition between smooth and impactful entry happens for
 $\unicode[STIX]{x1D6FC}\simeq 70^{\circ }$
. Our experimental measurements of the maximum force and the time of occurrence compare well with existing impact force theories (Logvinovich Reference Logvinovich1972), after incorporating corrections due to the finite aspect ratio
 $L/d$
of the wedge (Meyerhoff Reference Meyerhoff1970). We also showed that, after submersion, diving wedges are subject to smaller drag forces, approximately two-fold smaller, than the drag forces on immersed wedges. We show that this difference is due to the presence of the cavity, and that the magnitude of the drag is well predicted using existing cavitation theory, even though the origin of the cavity is different.
The second part of this study focused on the dynamics of the splash. We showed that while the entry velocity does not have any noticeable effect on the shape of the cavity, as noted by previous authors (Duclaux et al. Reference Duclaux, Caille, Duez, Ybert, Bocquet and Clanet2007), it does have a significant effect on the splash shape. Large velocities generally lead to increasingly more ample and further-reaching arabesques. We proposed a one-dimensional model of the splash, incorporating various physical forces acting on the ejected water sheet. We identified a Venturi-suction force caused by the air rushing in between the sheet and the water surface. This phenomenon is similar to the one observed by Thoroddsen et al. (Reference Thoroddsen, Thoroval, Takehara and Etoh2011) for impact of drops in water, but at a much larger scale and smaller velocity, allowing better visualization and seeding. The shape of the splash is driven by competition between Venturi suction that causes the instability of the sheet and surface tension that acts as a stabilizing force. For low-flying splashes, namely those created by large wedge angles, the Venturi suction overcomes surface tension and the splash sheet collapses onto the water surface.
The one-dimensional splash model satisfactorily captures the splash development, but it can be improved in several ways. First and foremost, one can take into account the water pile-up under the wedge. The main change would be that the occurrence of full submergence will happen quicker, and as a result, the outermost, straight portion of the splash will be shorter, most likely improving the model’s fidelity. To complete this approach, one would have to consider the pressure profile on the wedge to infer the initial conditions given to the water particle until the wedge is fully submerged with respect to the undisturbed surface. Although harder to implement, this method would bridge the gap between the pressure profile and splash shape: the kink in the splash shape would be expected to form shortly after the jet root escapes the wedge’s edge, because of the large pressure in this portion of the wetted region.
Another direction to improve the model is to account for the thickness of the splash and its dynamic evolution. Some impact models suggest that the thickness (measured at the jet root) is solely a function of the size and opening angle of the wedge (Pierson Reference Pierson1950), while the thickness scale
 $\sqrt{\unicode[STIX]{x1D708}D/V_{s}}$
, commonly used in sphere impact problems, includes both splash velocity and viscosity (Thoroddsen et al.
Reference Thoroddsen, Thoroval, Takehara and Etoh2011). Additionally, the thickness is expected to vary slowly along the splash sheet, being thinner at the tip area (excluding the rim), and thicker closer to the base. To our knowledge, little is known about this dependence, especially after the jet root has escaped. A better understanding of the mechanisms governing the splash thickness would form a first step towards developing a fragmentation theory.
Acknowledgements
The work of L.V., T.X., D.Y. and E.K. is partially supported by the National Science Foundation through the NSF CBET grant 1512192 and the Army Research Office through the ARO grant W911NF-16-1-0074 (both to E.K.). E.K. is grateful for sabbatical support from the Center for Computational Biology, Flatiron Institute, Simons Foundation, New York, NY 10010, USA.
Supplementary movies
Supplementary movies are available at https://doi.org/10.1017/jfm.2018.273.