INTRODUCTION
The development of improved cultivars is time consuming and costly. Thus, the way breeders’ seed is treated is of importance for the maintenance of varietal uniformity and the avoidance of degeneration. Elite cultivars have long been believed to be relatively permanent with limited or no important genetic variation. Numerous studies in several crops, however, have indicated significant intra-cultivar genetic variation, based upon either phenotypic differentiation (e.g. Sprague et al. Reference Sprague, Russell and Penny1960; Byth & Weber Reference Byth and Weber1968; Grogan & Francis Reference Grogan and Francis1972; Tokatlidis et al. Reference Tokatlidis, Xynias, Tsialtas and Papadopoulos2006; Fasoula & Boerma Reference Fasoula and Boerma2007) or on molecular techniques (Zhang et al. Reference Zhang, Gentzbittel, Vear and Nicolas1995; Olufowote et al. Reference Olufowote, Xu, Chen, Park, Beachell, Dilday, Goto and McCouch1997; Gethi et al. Reference Gethi, Labate, Lamkey, Smith and Kresovich2002). However, the genome undergoes constant renewal, remodelling and restructuring. The processes of intragenic recombination, unequal crossing-over, DNA methylation, excision or insertion of transposable elements and gene duplication, contribute to newly developed genetic variation (McClintock Reference McClintock1984; Rasmusson & Phillips Reference Rasmusson and Phillips1997; Cullis Reference Cullis2005; Morgante et al. Reference Morgante, Brunner, Pea, Fengler, Zuccolo and Rafalski2005). Moreover, during the whole process of cultivar maintenance and multiplication, contaminating and degrading forces such as outcrossing, mixing, volunteer plants, natural selection and seed-borne diseases all change the gene pool for the worse, and it is even possible for a complete loss of the improved features of the cultivar to occur (Laverack Reference Laverack1994; Parlevliet Reference Parlevliet2007). Improved cultivars may lose their identity and healthiness because of the aforementioned molecular and mechanical parameters. Peng et al. (Reference Peng, Cassman, Virmani, Sheehy and Khush1999) found that the maximum yield of the famous rice cultivar IR8 in the Philippines reduced by 20% over a period of 30 years. On the other hand, measures that reduce the risks of these negative forces, together with a proper maintenance selection, can neutralize these adverse effects on the gene pool or even turn them into positive ones by selecting sufficiently strongly (Parlevliet Reference Parlevliet2007).
Despite its importance, exploitation of intra-cultivar variation has not been widely investigated. Such a possibility in cotton could be useful for maintaining high standards of uniformity in the long term, and improving desirable agronomic characteristics. Undoubtedly, the magnitude of intra-cultivar genetic variation is likely to be limited, and so phenotypically recognizable only under optimal conditions that maximize phenotypic expression and differentiation. Such a condition is met when plants are grown at a very low density that reduces plant stress, allows maximum seedcotton production per plant and optimizes single-plant heritability by increasing genetic variance in proportion to environmental variance (Fasoula & Fasoula Reference Fasoula and Fasoula1997, Reference Fasoula and Fasoula2002; Tokatlidis et al. Reference Tokatlidis, Has, Mylonas, Has, Evgenidis, Melidis, Copandean and Ninou2010). Single-plant selection at very low density has been effectively employed to reveal exploitable intra-cultivar variation in maize (Zea mays L.) (Tokatlidis Reference Tokatlidis2000), bread wheat (Triticum aestivum L.) (Fasoula Reference Fasoula1990; Tokatlidis et al. Reference Tokatlidis, Xynias, Tsialtas and Papadopoulos2006) and soybean (Glycine max (L) Merr.) (Fasoula & Boerma Reference Fasoula and Boerma2007). In cotton, Fasoulas (Reference Fasoulas and Gillham2000) reported exploitable genetic variation within a cultivar for seedcotton yield and resistance to Verticillium wilt. In recent research (Tokatlidis et al. Reference Tokatlidis, Tsikrikoni, Tsialtas, Lithourgidis and Bebeli2008; Tsialtas et al. Reference Tsialtas, Tokatlidis, Tsikrikoni and Lithourgidis2008), single-plant selection within three elite cotton cultivars at the low density of 1·15 plants/m2 revealed significant variation for seedcotton yield, leaf carbon isotope discrimination, ash and K content and fibre length and micronaire scores. Subsequent to these findings, the main objective of the present study was to explore the response to intra-cultivar selection and whether this variation is exploitable to upgrade the cultivar's agronomic performance. For this purpose, in addition to first- and second-generation progeny lines (1GPLs and 2GPLs) tested at three locations at the same low density under which selection was performed, third-generation progeny lines (3GPLs) were tested at the standard commercial crop density over two locations and 2 years.
MATERIALS AND METHODS
Source material and experimental treatments
Source material consisted of three elite cotton cultivars, released in Greece by commercial companies: ‘Christina’, released in 1997 by Bios Agrosystems; ‘Corona’, released in 1992 by Delta and Pine Land; ‘Flora’, released in 2000 by Bayer Crop Science. These cultivars were chosen due to good adaptation and wide cultivation in northern Greece, where the selection process and progeny testing were conducted.
Experimentation was carried out during five successive growing seasons under irrigated conditions and in three locations representing the major cotton-producing areas of northern Greece. The first location (Site 1) was in Alexandroupolis region (40°51′N, 23°17′Ε, 9 m asl, a sandy clay loam soil with pH 7·3, organic matter 15·1 g/kg, N-NO3 41·8 mg/kg, P-Olsen 52 mg/kg and K 437 mg/kg). The second location (Site 2) was at the Aristotle University Farm of Thessaloniki (40°32′N, 22°59′Ε, 6 m asl, a clay loam soil with pH 7·6, organic matter 25·8 g/kg, N-NO3 17·9 mg/kg, P-Olsen 25 mg/kg and K 109 mg/kg). The third location (Site 3) was in the Larissa region (39°35′N, 22º36′Ε, 51 m asl, a clay loam soil with pH 7·9, organic matter 23·4 g/kg, N-NO3 15 mg/kg, P-Olsen 41 mg/kg and K 455 mg/kg). The selection was performed in the first location with seed of the selected plants obtained from flowers covered with paper bags to ensure self-pollination, while progeny testing was practised at low density at the three locations and at crop density at Site 1 and Site 2.
Selection and progeny (1GPLs and 2GPLs) testing at low density
Details have been presented in a previous paper (Tokatlidis et al. Reference Tokatlidis, Tsikrikoni, Tsialtas, Lithourgidis and Bebeli2008) and are summarized here briefly. The honeycomb methodology of selection and evaluation (Fasoulas & Fasoula Reference Fasoulas and Fasoula1995; Fasoula & Fasoula Reference Fasoula and Fasoula1997, Reference Fasoula and Fasoula2002) was applied at low density. For selection purposes, seedcotton yield of each plant, being at the centre of a circle of a given size, was expressed as a proportion of the mean yield of the surrounding plants in the circle (Batzios & Roupakias Reference Batzios and Roupakias1997), and plants with the highest relative value were selected.
On 17 April 2004, a honeycomb experiment incorporating three entries (R-3) was established at Site 1, involving a total of 550 plants of each cultivar, with plants being 1·0 m apart. The six plants per cultivar having the highest relative seedcotton yields compared to the mean yield of 61 surrounding plants were selected. The seed of each selected plant constituted a separate 1GPL.
In the next growing season, the 18 1GPLs (six from each cultivar), along with the original cultivars as controls, were established in R-21 honeycomb layouts at Site 1 (15 April 2005), Site 2 (20 April 2005) and Site 3 (14 April 2005) with a distance of 1·0 m between plants. The 21 entries were divided into three sets of seven, each set being the control cultivar and the six respective 1GPLs selected from it. Entries were coded in such a way that 60 replicates of each set were evenly distributed across the entire experimental area to ensure comparable conditions for each set. At Site 1, 10 plants with the highest yields on the basis of the average yield of 42 surrounding plants were selected from each 1GPL. Mixed ginned seed from the 10 selected plants within each 1GPL formed the respective 2GPL. As for the 1GPLs, the 2GPLs were evaluated in 2006 (sowing date 14 April for Site 1, 25 April for Site 2 and 15 April for Site 3) and the same selection technique led to 3GPLs.
Progeny (3GPLs) testing at the crop density
The 3GPLs were evaluated for seedcotton yield under standard crop density of 10 plants/m2. The experimental design was randomized complete blocks with three replications of single-row plots, 5·0×1·0 m, and 0·1 m between plants. Each set of a given cultivar and its 3GPLs constituted a randomized sub-block including marginal rows. Trials were planted on 30 and 20 April 2007, and again on 16 and 23 April 2008 at Site 1 and Site 2, respectively. Each plot was harvested separately and data on seedcotton weights adjusted to yield/ha.
One sample of the uppermost fully expanded leaves from both sites in 2007 was collected from each plot to estimate the physiological traits of carbon isotope discrimination (Δ), ash and K content. Fibre quality traits (length, uniformity, strength and micronaire score) were estimated in one sample per plot in Site 1 in both years, via high-volume instrumentation. Strength expresses the force required to break a bundle of fibres one tex unit in size (a tex unit is equal to the weight (g) of 1000 m of fibre). Micronaire is a measure of airflow through a compressed specimen of fibre that relates to fibre fineness and maturity. The techniques for assessment of physiological and fibre quality traits were consistent with the respective applied at low density (Tokatlidis et al. Reference Tokatlidis, Tsikrikoni, Tsialtas, Lithourgidis and Bebeli2008).
Data analysis
Mean yields per plant at low density were compared using the s.e.d., and coefficient of variation (CV) associated with particular means was calculated as well as the information provided previously (Tokatlidis et al. Reference Tokatlidis, Tsikrikoni, Tsialtas, Lithourgidis and Bebeli2008).
At crop density, yields were expressed on a plot basis and subjected to analysis of variance, where environment (location and/or year) effects were considered random and the cultivar effect was fixed.
RESULTS
Evaluation of 3GPLs at crop density for seedcotton yield
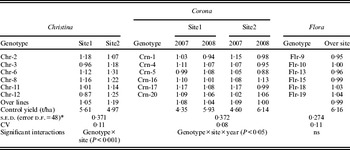
Analysis of variance for genotypes derived from cvar Christina indicated that year of test and genotype were highly significant (P<0·001). Genotype×site interaction was also highly significant (Table 1), while genotype×year and genotype×site×year interactions were not significant. Thus, for comparison purposes, seedcotton yields were combined across years. The mean yields of the control cvar Christina were 5·61 t/ha in Site 1 and 4·97 t/ha in Site 2. The six 3GPLs yielded 0·87–1·18 (average 1·05) of the control mean yield in Site 1 and 1·07–1·31 (average 1·19) of the control mean yield in Site 2. Two and four of the six 3GPLs were significantly higher yielding than the control in Site 1 (i.e. Chr-2 and Chr-8) and Site 2 (i.e. Chr-3, Chr-6, Chr-8 and Chr-12), respectively.
Mean seedcotton yield as a proportion of the control mean of the 3GPLs derived from cvars Christina, Corona and Flora evaluated at crop density (data across two sites and 2 years)

* Standard error difference to compare genotype yields across and within columns.
ns: not significant.
In genotypes related to Corona, the main effects of test year and genotype were significant. The genotype×site×year interaction was also significant and thus data from the four trials are given separately in Table 1. At Site 1 during 2007, yields of the 3GPLs ranged from 0·99 to 1·17 of Corona, and two lines differed significantly (Crn-5 v. Crn-17). In 2008, yields of the six 3GPLs ranged from 0·94 to 1·08 of the control yield, with lines Crn-4, Crn-5 and Crn-17 significantly higher yielding than line Crn-1. At Site 2 during 2007, the six lines averaged 5·01 t/ha, 9·0% higher than the control (4·60 t/ha), and line Crn-17 significantly out-yielded Corona (17%). In 2008, lines Crn-5 and Crn-16 were significantly lower (12%) and higher (13%), respectively, in seedcotton yield than the original cultivar.
In selections from cvar Flora, only the main effects of test year were significant. Pooled data over sites and years resulted in line yield ranging from 0·95 to 1·04 of the mean yield of Flora (6·16 t/ha), while the 3GPL overall yield was 6·12 t/ha (Table 1).
Response to selection for seedcotton yield
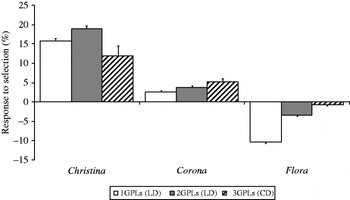
The overall response to selection in each generation is given in Fig. 1, with yield combined over lines, sites and years and expressed relative to the respective average control yield. In cvar Christina compared to the control, 1GPLs and the 2GPLs (tested at low density) produced 16 and 19% significantly higher yield respectively, with the 3GPLs tested at crop density giving 12% significantly higher yield. The yields of the 1GPLs and 3GPLS of cvar Corona did not differ significantly from the control, while the 2GPLs were 3·7% significantly higher yielding. In cvar Flora, the 1GPLs were 10% significantly lower yielding, while the 2GPLs and 3GPLs were similar to the original cultivar.
Average response to selection within cvars Christina, Corona and Flora estimated as average % yield deviation from the original cultivar of the 1GPLs and the 2GPLs at low density [pooled data over three sites adapted from Tokatlidis et al. (Reference Tokatlidis, Tsikrikoni, Tsialtas, Lithourgidis and Bebeli2008)], and of the 3GPLs at crop density (pooled data over two sites and 2 years). (Bar on each column indicates the respective s.e.d. with the control value).

Intra-cultivar variation for physiological and fibre properties at crop density
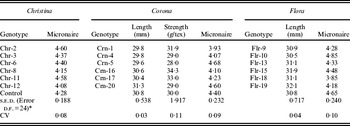
The analysis of variance did not depict significant genotype effects regarding the three physiological traits (data not shown). For the fibre quality properties, the genotype effects were significant for micronaire reading in cvar Christina, for length and micronaire reading in cvar Flora, and for length, strength and micronaire reading in cvar Corona. The genotype×year interactions were not significant. In the lines derived from cvar Christina, Chr-2 and Chr-11 had significantly higher micronaire values than Chr-8 and Chr-12 (Table 2). The cvar Flora-derived genotype Flr-19 had significantly longer fibre compared with three 3GPLs and the control. Line Flr-10 had the highest micronaire value and line Flr-18 had the lowest micronaire value, both significantly different than four and three of the remaining genotypes, respectively, whereas the micronaire value of Flr-18 was significantly lower than the control mean. Line Crn-5 was numerically the shortest in fibre length and significantly different from four Crn-3GPLs and Corona, while the numerically longest in fibre length was line Crn-20 which differed significantly from three 3GPLs. Line Crn-16 produced fibre significantly stronger than three of the Crn-3GPLs and Corona, whereas lines Crn-5 and Crn-20 had significantly greater micronaire values compared with lines Crn-1, Crn-4 and Crn-16.
Mean values for fibre quality properties of the 3GPLs derived from cvars Christina, Corona and Flora evaluated at crop density (data from Site 1 across 2 years)

* Standard error difference to compare the genotype means.
DISCUSSION
Intra-cultivar variation
At crop density, the magnitude of intra-cultivar variation (i.e. the relative superiority of the top over the bottom genotype) for seedcotton yield across sites and years averaged 0·22 for the 3GPLs of Christina (Chr-6 v. control), and 0·10 for the 3GPLs of Corona (Crn-17 v. Crn-5 and control) (Table 1). Significant differences among the 3GPLs at crop density were also discovered for fibre micronaire within the three cultivars, for fibre length within Corona and Flora, and for fibre strength within Corona (Table 2), but not for any of the three physiological traits.
There are important comparisons between these findings for the 3GPLs which were tested at crop density and the findings obtained at low density using 1GPLs and 2GPLs (Tokatlidis et al. Reference Tokatlidis, Tsikrikoni, Tsialtas, Lithourgidis and Bebeli2008). At low density, greater variability was observed. For instance, the magnitude of intra-cultivar variation for seedcotton yield averaged 1·25 (1GPLs) and 1·28 (2GPLs) for cvar Christina and 1·14 (1GPLs) and 1·26 (2GPLs) for cvar Corona. Moreover, at low density, significant heterogeneity was found for seedcotton yield within cvar Flora, for fibre length within cvar Christina, and for three physiological traits within the three cultivars (Tokatlidis et al. Reference Tokatlidis, Tsikrikoni, Tsialtas, Lithourgidis and Bebeli2008). This supports the hypothesis that very low densities accentuate phenotypic differentiation (Fasoula & Fasoula Reference Fasoula and Fasoula1997, Reference Fasoula and Fasoula2002; Tokatlidis et al. Reference Tokatlidis, Xynias, Tsialtas and Papadopoulos2006, Reference Tokatlidis, Has, Mylonas, Has, Evgenidis, Melidis, Copandean and Ninou2010), thus allowing even limited genetic variability to be identified. These findings are in agreement with those found in other studies (Fasoula Reference Fasoula1990; Fasoulas Reference Fasoulas and Gillham2000; Tokatlidis Reference Tokatlidis2000; Tokatlidis et al. Reference Tokatlidis, Xynias, Tsialtas and Papadopoulos2006; Fasoula & Boerma Reference Fasoula and Boerma2007). Because of the accumulated reports of intra-cultivar variation, continued selection under very low density has been proposed (Fasoula & Fasoula Reference Fasoula and Fasoula2002). In contrast to the typical maintenance stewardship, in which, elite cultivars are treated as permanent records and usually plants of ‘incorrect’ type are removed (Parlevliet Reference Parlevliet2007), the suggested technique is more a selection rather than a rouging process. It may progressively lead to new registration by the improvement of important agronomic traits, the required time for which is hard to be answered depending on both crop and cultivar.
Response to intra-cultivar selection
Averaged over sites, the cvar Christina- and cvar Corona-derived 1GPLs outperformed the original cultivars by 16 and 2·6%, respectively (Fig. 1). Even though more favourable environmental conditions prevailed when the 1GPLs were evaluated (Tokatlidis et al. Reference Tokatlidis, Tsikrikoni, Tsialtas, Lithourgidis and Bebeli2008), the advanced self-pollination of 2GPLs achieved greater increase in seedcotton yield over the controls (19% for Christina and 3·7% for Corona). With a few exceptions, both 1GPLs and 2GPLs exhibited lower CV for single-plant yields than their original parents (Tokatlidis et al. Reference Tokatlidis, Tsikrikoni, Tsialtas, Lithourgidis and Bebeli2008), suggesting homozygosity or homogeneity within the selected lines, and indicating that the selection imposed narrowed existing genetic variation within these two gene pools which had been assumed to be fairly homogeneous. By contrast, selection within cvar Flora resulted in 1GPLs with 10% lower average yield than the original cultivar but this decreased to 3·3% in the second generation (Fig. 1), and one possible cause was a considerable degree of heterozygosity in the original cultivar (Tokatlidis et al. Reference Tokatlidis, Tsikrikoni, Tsialtas, Lithourgidis and Bebeli2008). Across sites, the 1GPLs averaged a CV value 11% higher than cvar Flora, but the 2GPLs and the control averaged a similar CV value, suggesting variability due to heterozygosity. Whether the hypothesis is valid, repeated selfing is required to fix homozygosity and find out whether this variability is exploitable.
The positive response to selection within cvars Christina and Corona was verified at crop density. Over sites and years, their 3GPLs yielded 12 and 5·2% higher than the original cultivars respectively (Fig. 1). It has been suggested that phenotypic differentiation decreases at high densities due to increased interplant competition (Fasoula Reference Fasoula1990; Fasoula & Fasoula Reference Fasoula and Fasoula1997, Reference Fasoula and Fasoula2002; Tokatlidis et al. Reference Tokatlidis, Xynias, Tsialtas and Papadopoulos2006, Reference Tokatlidis, Has, Mylonas, Has, Evgenidis, Melidis, Copandean and Ninou2010). This constitutes a reasonable explanation to the fact that in cvar Christina the 19% overall superiority for the 2GPLs at low density decreased to 12% for the 3GPLs at crop density (Fig. 1). A similar influence of low- v. commercial crop-density conditions on the magnitude of entry differentiation has been reported in bread wheat (Fasoula Reference Fasoula1990; Tokatlidis et al. Reference Tokatlidis, Xynias, Tsialtas and Papadopoulos2006). Selection for seedcotton yield may not exclude cultivar improvement for other important agronomic traits either, and the case of high yielding line Crn-16 (Table 1) with the strongest fibre (Table 2) is instanced. Line Chr-6 that out-yielded cvar Christina by 22% at crop density (Table 1) was also superior for fibre length at low density (Tokatlidis et al. Reference Tokatlidis, Tsikrikoni, Tsialtas, Lithourgidis and Bebeli2008). Leaf carbon isotope discrimination, Δ, which reflects plant discrimination against 13CO2 and the assimilation of 12CO2 during photosynthesis, has been suggested as an indirect assessment of water use efficiency, since the two traits are negatively associated (Saranga et al. Reference Saranga, Jiang, Wright, Yakir and Paterson2004; Tsialtas et al. Reference Tsialtas, Tokatlidis, Tsikrikoni and Lithourgidis2008). Lines Chr-2, Chr-3 and Chr-8, as well as Crn-20, had significantly lower Δ values than the controls at low density (Tokatlidis et al. Reference Tokatlidis, Tsikrikoni, Tsialtas, Lithourgidis and Bebeli2008), showing a possible advantage under drought stress conditions. Honeycomb single-plant selection for seedcotton yield within the susceptible cvar Sindos 80 led to the resistant cvar Macedonia in terms of Verticillium wilt (Fasoulas Reference Fasoulas and Gillham2000). No progress from intra-cultivar selection was found in cvar Flora based on the 3GPLs performance at crop density (Fig. 1). Although cotton is a self-pollinated species, natural crossing may range from 0 to almost 0·5 (Xanthopoulos & Kechagia Reference Xanthopoulos and Kechagia2000). If the cross-pollination hypothesis is real in cvar Flora, it cannot be excluded that continuous selection at low density may lead to new lines capable of out-yielding cvar Flora, and leading essentially to a new cultivar. In tomato (Lycopersicon esculentum L.), exploitable genetic variation for yield was uncovered in advanced generations, after the point of achieving theoretical homozygosity, i.e. F7 generation (Christakis & Fasoulas Reference Christakis and Fasoulas2002).
Results from molecular studies indicate that the genome undergoes constant remodelling and restructuring, suggesting that it is more flexible and plastic than previously assumed (McClintock Reference McClintock1984; Zhang et al. Reference Zhang, Gentzbittel, Vear and Nicolas1995; Olufowote et al. Reference Olufowote, Xu, Chen, Park, Beachell, Dilday, Goto and McCouch1997; Rasmusson & Phillips Reference Rasmusson and Phillips1997; Gethi et al. Reference Gethi, Labate, Lamkey, Smith and Kresovich2002; Cullis Reference Cullis2005; Morgante et al. Reference Morgante, Brunner, Pea, Fengler, Zuccolo and Rafalski2005). If that is the case, then the observed response to selection within cotton cultivars may have important implications for cultivar maintenance and deserves further consideration. Laverack & Turner (Reference Laverack and Turner1995) stated that to maintain a cultivar true-to-type and healthy, removing off-type plants is an imprecise method. Gethi et al. (Reference Gethi, Labate, Lamkey, Smith and Kresovich2002) pointed out that breeders should take into account the within inbred line genetic variation in maize, particularly when sampling early released materials. The selection method of 1GPLs and 2GPLs at low density and the final performance test of the 3GPLs at crop density open up new prospects for similar studies with other cultivars and crops to determine how universal this rule may be. The practice of advancing generations or maintaining cultivars at commercial densities, may favour degeneration by increasing the relative contribution from strong competitor plants with low seed yields to the next generation compared to that of weak competitor plants with high seed yields (Fasoula Reference Fasoula1990; Fasoula & Fasoula Reference Fasoula and Fasoula1997, Reference Fasoula and Fasoula2002; Tokatlidis et al. Reference Tokatlidis, Xynias, Tsialtas and Papadopoulos2006, Reference Tokatlidis, Has, Mylonas, Has, Evgenidis, Melidis, Copandean and Ninou2010). On the other hand, cultivar improvement may result if selection continues at low density after the release of cultivars, covering an adequate number of sites. By this procedure, undesirable mutations or segregates may be removed, while exploiting those affecting yield, stability and other desirable traits. For instance, mote frequencies that represent a loss in yield and cause imperfections in yarn and cloth quality (Bolek Reference Bolek2006), or leaf morphology that affects yield, quality, maturity, water-use efficiency, etc. (Hao et al. Reference Hao, Yu, Dong, Fan, Ma, Song and Yu2008) might be improvable via intra-cultivar selection at very low density. By improving important agronomic traits and yield capacity for the farming-density conditions, a new registration may result. Intra-cultivar honeycomb selection at very low density resulted in progeny lines that, at farming-density, outperformed the cultivar by 8·0% (Fasoula Reference Fasoula1990) and 22% (Tokatlidis et al. Reference Tokatlidis, Xynias, Tsialtas and Papadopoulos2006) in bread wheat and by 10% in cotton (Fasoulas Reference Fasoulas and Gillham2000). Additionally, Tokatlidis et al. (Reference Tokatlidis, Xynias, Tsialtas and Papadopoulos2006) reported improvement of cultivar stability. Rasmusson & Phillips (Reference Rasmusson and Phillips1997) reported incremental genetic gains for several traits in a narrow gene pool of barley (Hordeum vulgare L.) and hypothesized that gain from selection within elite gene pools occurs because of variation present in the original gene pool as well as de novo generated variation. In maize, long-term selection studies for modified oil and protein showed that meaningful variation exists after 90 generations of selection (Dudley & Lambert Reference Dudley and Lambert2004).
In conclusion, the data reported herein suggest exploitable intra-cultivar variation in cotton. This variation may be due to latent variation, or epigenetic variation in response to environmental changes. Results of the present study and numerous supporting reports imply that the genomes of ‘pure line’ cultivars may not be as fixed as previously assumed. Continuous selection within elite cotton cultivars may prove to be a useful technique either to upgrade or to avoid gradual degeneration of genetic background and to maintain uniformity over longer periods of time. Low density, by accentuating the limited intra-cultivar variation, appears ideal to identify the existing and newly developed genetic differences, and to remove inferior plants and identify the superior ones. Hence, prospective analogous research in cotton and other crops may verify that the selection within elite cultivars at low densities as a maintenance of improvement process is a beneficial technique to secure optimal quality of breeder's seed.