Introduction
Poverty in the United States has been a general concern within the public, government, and academia, yet there are different perceptions about its causes. There is also controversy about the best strategy for antipoverty policies and how to evaluate the effect of welfare programs. Applied research based on empirical evidence of older adults’ poverty is warranted (Kwan and Walsh, Reference Kwan and Walsh2018). This study evaluates the effect of government transfers in alleviating poverty among American older adults by using up-to-date evidence from the Health and Retirement Study (HRS). Although existing studies have consistently found significant poverty alleviation effects of government transfers among older adults, many such analyses considered the aging population as a homogeneous group. This study provides a close look at antipoverty policies by distinguishing their varied effects within the aging population based on their heterogeneous social backgrounds. Findings contribute to the policy debate regarding the effectiveness of government transfers by using a new source of data and shed light on improving the design and implementation of antipoverty policies.
Poverty: demography and causes
Poverty and income inequality as a persistent and serious social problem have been well acknowledged in the U.S. In general, women, children, people who are Black/African American or Hispanic, and those living in a female-headed household are more likely to be at risk of poverty (Cellini et al., Reference Cellini, McKernan and Ratcliffe2008; Haveman et al., Reference Haveman, Blank, Moffitt, Smeeding and Wallace2015). Recent decades have witnessed a declining poverty rate among older adults while the poverty rate increased among children and people without a college education (Marchand and Smeeding, Reference Marchand, Smeeding, Moody and Sasser2016; Rushefsky, Reference Rushefsky2017). Despite the growing number of older adults, their poverty rate greatly decreased partly because of the efforts of government-based welfare programs (Moody and Sasser, Reference Moody and Sasser2018a). In contrast, due to a high divorce rate and out-of-wedlock births, those living in single female-headed households lack adequate support and resources and have become more vulnerable (Haveman et al., Reference Haveman, Blank, Moffitt, Smeeding and Wallace2015; Rushefsky, Reference Rushefsky2017).
From a broader perspective, poor socioeconomic environments such as the Great Recession in 2007 could result in job loss or salary decline, which further increases individuals’ financial vulnerability (Haveman et al., Reference Haveman, Blank, Moffitt, Smeeding and Wallace2015). However, government transfer programs implemented during harsh periods could play a major buffering role alleviating the adverse effects of economic recession (Bitler and Hoynes, Reference Bitler and Hoynes2016). In fact, social welfare program use was a common experience among Americans to get through financial difficulty (Rank and Hirschl, Reference Rank and Hirschl2002).
However, there are intensive arguments about the rationale of welfare programs because Americans cannot agree on the causes of poverty. On one hand, poverty is argued to be a personal inadequacy – poor people lack incentive and culture to work hard; therefore, government transfers not only cannot help them exit poverty, but also discourage them to work (Rector and Sheffield, Reference Rector and Sheffield2014; Bitler and Karoly, Reference Bitler and Karoly2015). On the other hand, poverty is suggested to be due to structural failure – current societal arrangements and economic contexts create inequality, leaving no opportunities for poor people to be upwardly mobile (Rank, Reference Rank2006; Brady, Reference Brady2019). These debates and shifts in the causes of poverty fundamentally determine the design of antipoverty strategy in the U.S. (Rushefsky, Reference Rushefsky2017).
The strategic focus of antipoverty policies in the U.S.
Broadly, four strategies have been used in the American government’s antipoverty policy design: preventive, alleviative, curative, and punitive (Rushefsky, Reference Rushefsky2017). As the debate on causes of poverty and evaluation of welfare programs has changed, the strategic focus of welfare programs also has gone through great punctuations (Haveman et al., Reference Haveman, Blank, Moffitt, Smeeding and Wallace2015). Most welfare programs, such as Social Security, are implemented via government transfers. In this section, we briefly review the history of antipoverty policies in the U.S. and discuss its strategic focus in each period.
In the early stage of U.S. welfare programs, in the 1930s when the Roosevelt administration initiated the New Deal to respond to the Great Depression, social insurance was first introduced as a preventive strategy to share risks among the public. Classical welfare programs included Social Security and unemployment compensation (Haveman et al., Reference Haveman, Blank, Moffitt, Smeeding and Wallace2015; Rushefsky, Reference Rushefsky2017). After nearly a century of development, the U.S. has built a social security net for the majority of its citizens. Although the preventive programs have very high costs, they have won wide public support (Moody and Sasser, Reference Moody and Sasser2018b).
Welfare programs grew dramatically in the 1960s and 1970s. Two major health insurance programs, Medicaid and Medicare, were developed. An alleviative strategy was applied because it was believed that government transfers could redistribute wealth and temporarily ease the financial burden of people living in poverty. Programs such as Supplemental Security Income (SSI) and the Supplemental Nutrition Assistance Program (SNAP, formerly known as Food Stamps) were introduced and targeted at populations with special needs (Rushefsky, Reference Rushefsky2017). In the meanwhile, the War on Poverty movement in the Kennedy and Johnson administrations enthusiastically adopted the curative strategy. That is, the government believed poverty could be cured by educating and nurturing children (Haveman et al., Reference Haveman, Blank, Moffitt, Smeeding and Wallace2015). Other supplemental methods such as promoting the community engagement of poor people and levying a negative income tax were also utilised in this period (Haveman et al., Reference Haveman, Blank, Moffitt, Smeeding and Wallace2015). However, these antipoverty policies failed to achieve good outcomes and were criticised as leading to welfare dependency and lowering the motivation of low-income individuals to work (Rushefsky, Reference Rushefsky2017).
In addition to the critics of War on Poverty policies, the government also faced the heavy financial burden on ever-growing welfare programs. Reform and retrenchment began in the 1980s (Haveman et al., Reference Haveman, Blank, Moffitt, Smeeding and Wallace2015). This period mainly used a punitive strategy because it was argued poverty was mainly due to individual failure and that government should play a small role (Rushefsky, Reference Rushefsky2017). It was believed that eligibility for welfare programs should differentiate between deserving and undeserving recipients (Ben-Shalom et al., Reference Ben-Shalom, Moffitt and Scholz2011). Influenced by these multiple factors, the government strengthened the management of welfare programs, cut the federal budget, and imposed requirements on welfare recipients by asking them to get training or work (Haveman et al., Reference Haveman, Blank, Moffitt, Smeeding and Wallace2015).
The reform persisted until the end of the twentieth century but has become tepid since the 2000s. Despite this reform, the magnitude of welfare programs has steadily and greatly increased due to demographic shifts and economic recession (Haveman et al., Reference Haveman, Blank, Moffitt, Smeeding and Wallace2015; Ziliak, Reference Ziliak2015). However, the focus of welfare programs has shifted from non-elderly and non-disabled families to families characterised by married couples, older adults, and recipients with disability (Moffitt, Reference Moffitt2015), illustrating the reform’s effort to distinguish people with special needs and deservingness in the twenty-first century (Ben-Shalom et al., Reference Ben-Shalom, Moffitt and Scholz2011).
Evaluation of welfare programs
Disputed evidence was found in evaluating the antipoverty program in the U.S. Some found the policy greatly reduced extreme or deep household poverty (Fox et al., Reference Fox, Wimer, Garfinkel, Kaushal and Waldfogel2015). In particular, Social Security significantly lowered the poverty rate among older adults (Moody and Sasser, Reference Moody and Sasser2018b). Medicare and Medicaid are essential to meet the health service needs of older adults and people with disability (Ben-Shalom et al., Reference Ben-Shalom, Moffitt and Scholz2011). Although some argued there might be behavioural side-effects in these welfare programs, they could not counteract the magnitude of benefits brought by social welfare programs (Ben-Shalom et al., Reference Ben-Shalom, Moffitt and Scholz2011). During the difficult times of economic recession, government transfers could reimburse the income loss due to the poor macro-economic environment (Fox et al., Reference Fox, Wimer, Garfinkel, Kaushal and Waldfogel2015).
Conversely, some strongly criticised the ineffectiveness of welfare programs. It was suggested that the welfare programs induced some unintended behaviours, such as reduced saving, discouraging marriage or work, and increased out-of-wedlock births (Bitler and Karoly, Reference Bitler and Karoly2015; Bitler and Hoynes, Reference Bitler and Hoynes2016), which diminish the norms of hard work and independence in American society (Rector and Sheffield, Reference Rector and Sheffield2014). Therefore, antipoverty programs not only could not ease poverty, but also seduced people living in poverty into the welfare trap and eroded social values (Rushefsky, Reference Rushefsky2017).
Other research suggested mixed results and provided an integrative perspective. For example, Meyer and Sullivan (Reference Meyer and Sullivan2012; Reference Meyer and Sullivan2013) indicated that some programs such as Social Security were effective while others only had minor effects in alleviating poverty. Ziliak (Reference Ziliak2015) also illustrated the moderate alleviation effect of the safety net on poverty despite the volume of welfare program growth. Wheaton et al. (Reference Wheaton, Giannarelli, Schiferl and Zedlewski2011) found the effectiveness of safety net policies varied from state to state but confirmed the benefits of federal programs. Fiszbein and Schady (Reference Fiszbein and Schady2009) argued for the need to develop a well-designed and managed system that could redistribute wealth rationally while avoiding the welfare trap.
Research objectives, questions, and assumptions
Despite the large volume of research on poverty, Kwan and Walsh (Reference Kwan and Walsh2018) indicated that poverty studies focused on older adults accounted for only a small proportion. Many studies have consistently found the significant effect of welfare programs, especially Social Security, Medicare, and Medicaid, in alleviating poverty among older adults (Ben-Shalom et al., Reference Ben-Shalom, Moffitt and Scholz2011; Rushefsky, Reference Rushefsky2017; Moody and Sasser, Reference Moody and Sasser2018b). However, we need to pay attention to how recent policy changes might affect older adults’ financial well-being. Meyer (Reference Meyer2013) indicated that the main streams of retirement income for older Americans had become less responsive and less available, which, combined with benefit reductions, would increase the fiscal insecurity of older adults. Therefore, new evidence is needed to update our view of the impact of government transfer programs on poverty among older adults in the new policy context. Other insufficiencies of the existing literature include the lack of real-world applied research and the need for a new source of data (Cellini et al., Reference Cellini, McKernan and Ratcliffe2008; Kwan and Walsh, Reference Kwan and Walsh2018). Many poverty studies on older adults in the United States have used data from the Panel Study of Income Dynamics or the U.S. Census Bureau. New sources of data are warranted to examine poverty from a different perspective (Cellini et al., Reference Cellini, McKernan and Ratcliffe2008). This study uses longitudinal HRS data from 2002 to 2014, thereby examining the effect of welfare programs from the perspective of a new source of data and contributing new evidence in this evolving policy context.
In addition, many previous studies categorised older adults as people aged sixty-five above and did not distinguish the heterogeneity within the aging population (e.g. Ben-Shalom et al., Reference Ben-Shalom, Moffitt and Scholz2011). There is major interpersonal variation because of socio-demographic differences. The effect of welfare programs might vary from group to group, which warrants more in-depth exploration. Therefore, this study distinguishes the poverty alleviation effect between groups with various demographic backgrounds by recognising the heterogeneity within the aging population. This approach provides a close look at the differential policy effects on the aging population. Findings subdivide welfare program effects among various sociodemographic groups and identify those who benefited the most or least, thereby providing further policy implications to help optimise resource distribution.
This study asks two primary research questions. First, did government transfers alleviate older adults’ poverty status from 2002 to 2014? Second, do the poverty alleviation effects of government transfers vary across different demographic groups of older adults? To address these questions, this study used the straightforward approach of comparing the poverty status of older adults when their incomes include and exclude government transfers. If the risk of them falling into poverty drops greatly when their incomes include government transfer, such a finding implies a poverty alleviation effect of government transfers.
However, it is essential to clarify that this approach is built on the counterfactual assumption that older adults’ incomes would be unaffected by the absence of the existing government transfers. This might not hold for some individuals. Previous studies have indicated people’s economic behaviour could change when they received assistance from the government, such as reduced saving or early retirement (e.g. Rushefsky, Reference Rushefsky2017). Conversely, those who did not receive government assistance may be motivated to continue working and invest in an individual retirement account, which subsequently increases their income from other sources (e.g. Bitler and Karoly, Reference Bitler and Karoly2015; Bitler and Hoynes, Reference Bitler and Hoynes2016). However, the straightforward approach adopted in this study assumes that older adults’ economic behaviour will not change when their incomes do not account for government transfers, with their incomes from other sources remaining the same. It must be noted, however, that we may never be able to know how older adults’ behaviour or incomes would change if they did not receive government transfers in the counterfactual context.
Methods
Data
Longitudinal data were retrieved from HRS, one of the most well-known longitudinal surveys on older adults in the U.S. HRS investigates the dynamics over time and the relationships among demographics, retirement, pensions, and health among American older adults. The survey has been conducted every two years since 1992 with a representative nationwide sample. RAND HRS Footnote 1 data is a user-friendly version of HRS and provides the poverty threshold variables from wave six (year 2002-2002) to wave twelve (year 2014-2015). Thus this study analysed only the longitudinal data from 2002 to 2014, covering seven waves of surveys. In 2002, there were 18,165 respondents in the sample.
Measure
Demographics
Sociodemographic information included sex, education, race, age, marital status, and region of residence. Sex, education, and race were time-invariant measures. Sex had two levels: male and female. Education measured the number of years of education. Race had three levels: White/Caucasian, Black/African American, and other. The values of other variables changed with time. Age was continuous. Marital status was recoded with two levels: with and without partnership. Regions of residence were defined by Census Regions and Divisions: Northeast, Midwest, South, and West.
Covariates
Control variables included self-reported health and household size. Self-reported health was measured by a single item ranging from 1 = excellent to 5 = poor. Household size was measured by the number of individuals living in the household.
Independent variables of interest
To quantify the magnitude of government transfers, we summed up respondents’ incomes from any kinds of government transfers in HRS measures, including Social Security Disability or Supplemental Security Income, Social Security retirement, unemployment or workers’ compensation, and other government transfers.
Dependent variables
RAND HRS provided the ratio of household income to Federal Poverty Level (FPL), which was obtained from the U.S. Census for the year prior to the interview wave. Note that the raw ratio of household income to FPL was computed after considering all types of government transfers and other income sources, as indicated by formula 1:
 $$\hskip-65pt\eqalign{ \scale 90%{{\rm{Ratio}}\;{\bf{with}}\;{\rm{gov}}\;{\rm{transfer}}\left( {{\rm{including}}\;{\rm{Social}}\;{\rm{Security}}} \right)} = {{all\;gov\;transfer + other\;income} \over {{\rm{FPL}}}}\hskip-48pt \cr \hskip-8pc=\scale 90%{{{\rm{total}}\;{\rm{household}}\;{\rm{income}}} \over {{\rm{FPL}}}}} \cr} $$
Previous studies have illustrated the major and significant poverty alleviation of Social Security on older adults (e.g. Rushefsky, Reference Rushefsky2017; Moody and Sasser, Reference Moody and Sasser2018b); Social Security could make up a large proportion of older adults’ income or the government transfers (Meyer and Sullivan, Reference Meyer and Sullivan2012; Reference Meyer and Sullivan2013). To distinguish the poverty alleviation effect of other government transfer programs from the effect attributable to Social Security, we computed the ratio when the government transfers did not include Social Security. The ratio including government transfers but excluding Social Security is shown in formula 2:
 $$\eqalign{{\rm{Ratio}}\;{\bf{with}}\;{\rm{gov}}\;{\rm{transfer}} \left( {{\rm{excluding}}\;{\rm{Social}}\;{\rm{Security}}} \right) \cr\hskip -185pt = {{\left( {all\;gov\;transfer - Social\;Security} \right) + other\;income} \over {{\rm{FPL}}}} \cr\hskip -185pt = {{{{\rm{total}}\;{\rm{household}}\;{\rm{income}} - {\rm{Social}}\;{\rm{Security}}} \over {{\rm{FPL}}}} \cr} $$
To contrast against the ratio calculated with government transfers, we also computed the ratio without considering any government transfers by using total household income, total amount of government transfers, and FPL as indicated in formula 3:
 $$\scale 88%{{\rm{Ratio\;}}{\bf{without}}{\rm{\;gov\;transfer}} = {{{other\;income}}\over{{\rm{FPL}}}} = {{{\rm{total\;household\;income}} - {\rm{all\;gov\;transfer}}}\over{{\rm{FPL}}}}$$
Finally, we recoded the three ratios as new dichotomous variables called ‘poverty status’, separately. There were two levels: ‘0’ indicated the individual was not poor, i.e. his/her household income was above the FPL; ‘1’ indicated the individual was poor.
Analytical strategy
Multilevel modelling was used because of the hierarchical structure of the data, with seven observations nested within every individual. Specifically, a growth curve model was used to examine how individual-level sociodemographic characteristics affected the initial level or growth trajectory of poverty status. We fit models separately using the three poverty status measures as dependent variables. First we created a ‘time’ variable measuring the number of years elapsed since the baseline 2002 study (values = 0, 2, 4, 6, 8, 10, 12) and used it as a predictor in the level 1 model. We further used the individual-level demographic information in the level 2 model to predict the random intercept and slope Footnote 2 . The equations using poverty status when household income did not include any government transfers are as follows:
Level 1 Model
 $${(Poverty\,Status\,Without\,Gov\,Transfer)_{ij}} = {\beta _{\it{0}j}} + {\beta _{\it{1}j}}*(Tim{e_{ij}}) + {e_{ij}}$$
Level 2 Model
 $$\eqalign{{\beta _{\it{0}j}} = {\gamma _{\it{00}}} + {\gamma _{\it{01}}}*(Se{x_j}) + {\gamma _{\it02}}*(Educatio{n_j}) + {\gamma _{\it{03}}}*({\rm{Rac}}{{\rm{e}}_j}) + {\gamma _{\it{04}}}*(Age{\it{2002}_j}) \cr \hskip-323pt+ {\gamma _{\it{05}}}*(Marital\,Statu{s_j}) + {\gamma _{\it{06}}}*(Regio{n_j}) + {\gamma _{\it{07}}}*(Healt{h_j}) \cr \hskip-323pt+ {\gamma _{\it{08}}}*(Household\,Siz{e_j}) + {r_{\it{0}j}}$$
 $$\eqalign{{\beta _{\it{1}j}} = {\gamma _{\it{10}}} + {\gamma _{\it{11}}}*(Se{x_j}) + {\gamma _{\it{12}}}*(Educatio{n_j}) + {\gamma _{\it{13}}}*({\rm{Rac}}{{\rm{e}}_j}) + {\gamma _{\it{14}}}*(Age{\it{2002}_j}) \cr \hskip-323pt+ {\gamma _{\it{15}}}*(Marital\,Statu{s_j}) + {\gamma _{\it{16}}}*(Regio{n_j}) + {\gamma _{\it{17}}}*(Healt{h_j}) \cr \hskip-323pt+ {\gamma _{\it{18}}}*(Household\,Siz{e_j}) + {r_{\it{1}j}}$$
where (Poverty Status Without Gov Transfer) ij is for the ith measurement of poverty status when the household income did not include any government transfers for the jth individual. The parameters β 0j and β 1j in the level 1 model indicate the initial level and growth rate of individual j at time t. The level 2 model examines whether the individual-level characteristics can predict the initial status at wave 1 (formula 2) and growth rate of poverty status (formula 3). The outcome variable is dichotomous; thus we fit a mixed effects logistic regression model.
To distinguish the poverty alleviation effect between groups with various demographic backgrounds, we computed the average marginal predicted probabilities of each level within the group and visualised them in the plot. All analyses were performed in R using the packages ‘lme4,’ ‘car’, ‘psych’, and ‘optimx’.
Results
Descriptive analysis
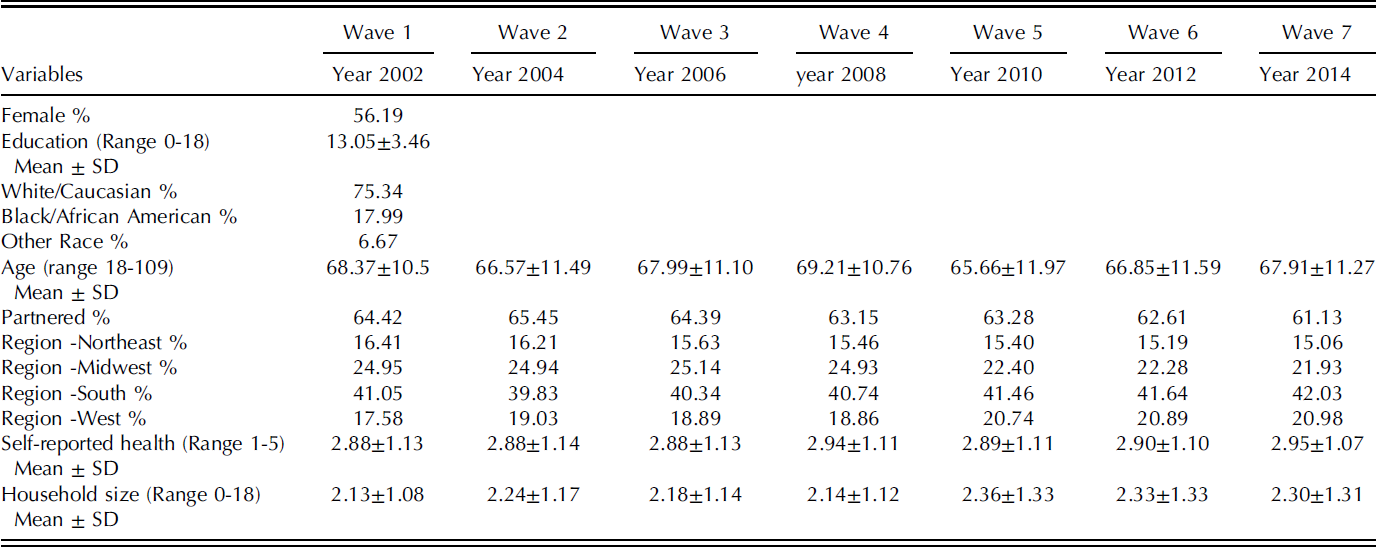
Table 1 shows the descriptive results. There were more females (56.19 per cent) than males. The average years of education were 13.05 with standard deviation of 3.46. Most respondents were Caucasian (75.34 per cent), followed by African American (17.99 per cent). The mean age in the initial survey was 68.37 (SD=10.5). Overall, over sixty per cent of the respondents were partnered, either married or involved in a long-term relationship. Approximately sixteen per cent of the respondents resided in the Northeast, twenty-four per cent in the Midwest, forty per cent in the South, and twenty per cent in the West. The mean of self-reported health was close to three, meaning most respondents rated their general health as fair. Many respondents reported two people living in the household.
Descriptive information of HRS samples

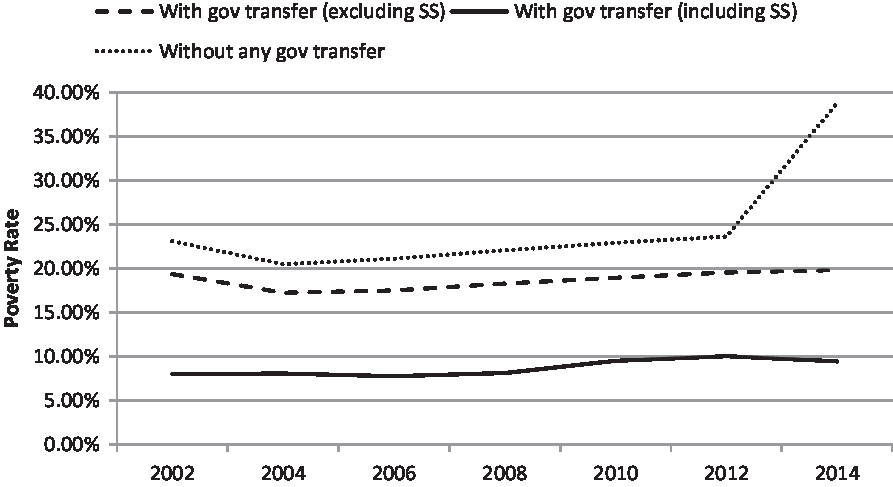
Regarding the outcome variables, we computed the poverty rate under three statuses of government transfers for every wave. Figure 1 visualises the trend of poverty rate over time. When household income accounted for the government transfers (including Social Security), the poverty rate was always the lowest and remained below ten per cent in every wave. In contrast, the poverty rate when household income did not consider any government transfers was the highest. The poverty rate considering other government transfers but excluding Social Security was in the middle. The differences in poverty rate between three statuses of government transfers illustrate the poverty alleviation effect of government transfers, among which Social Security had major contributions.
Comparison of poverty rate in three statuses of government transfer over time.
Note: SS: Social Security.

Growth curve model
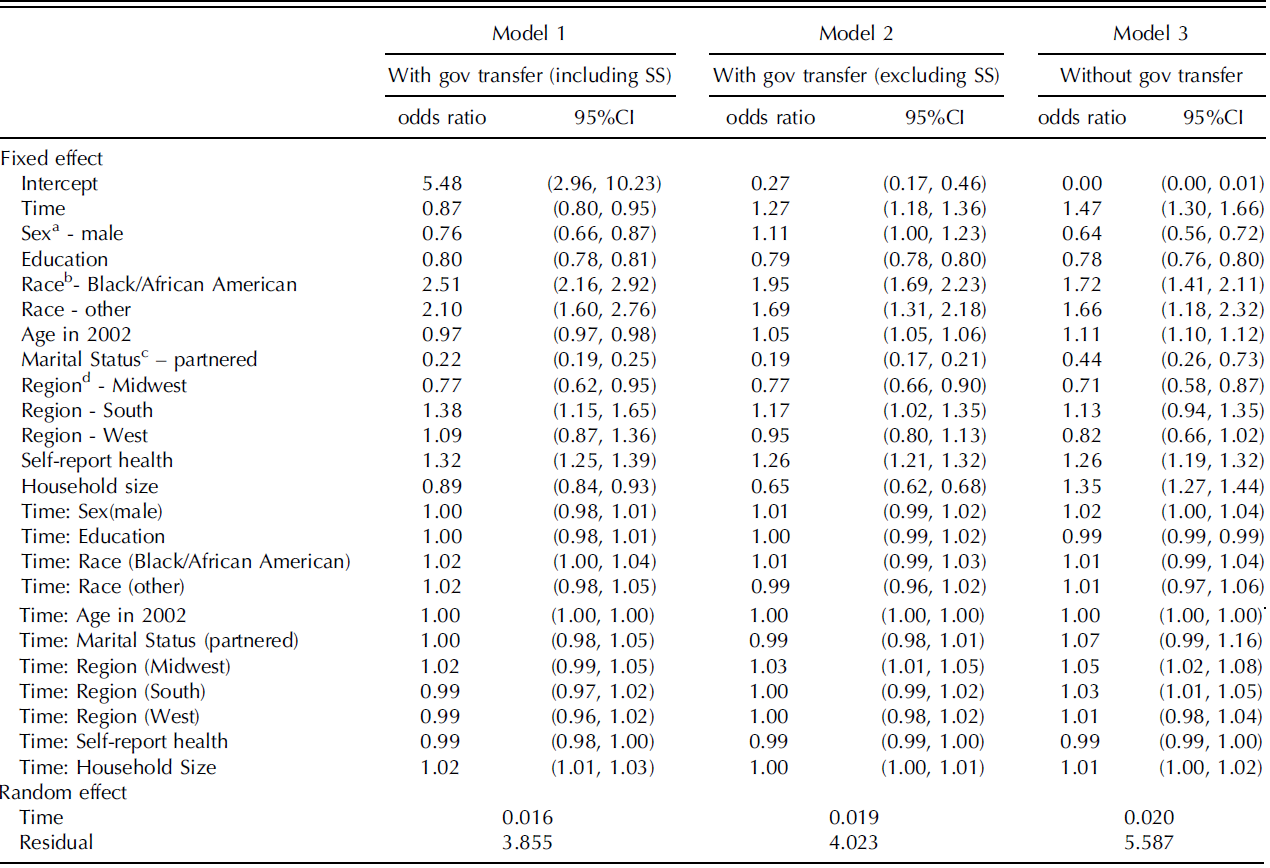
Preliminary tests on the null model indicated the initial level and growth rate of poverty status varied significantly across individuals. Table 2 shows the results of three models using individual-level information predicting the random intercept and random slope of time. Most individual-level measures were significant predictors of the random intercept. Specifically, having fewer years of education, being minority, without a partner, and reporting poorer health were associated with higher probability of falling into poverty consistently in three models. Most of the cross-level interaction effects were statistically insignificant (p > 0.05).
Growth curve model results for three statuses types of government transfer

Notes: a. The reference level of gender was female. b. The reference level of race was White/Caucasian. c. The reference level of marital status was partnerless. d. The reference level of region was Northeast.
Comparison of predicted probability of falling into poverty
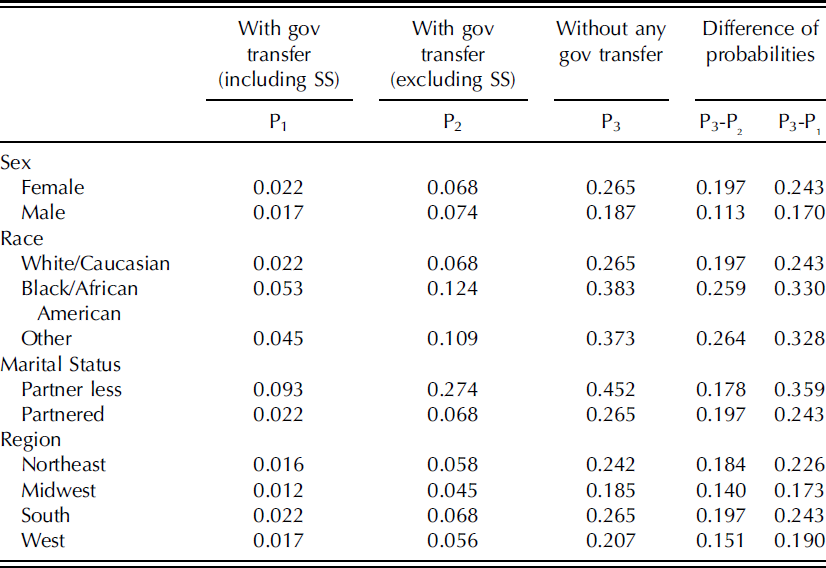
Table 3 shows the predicted probability of being poor between the levels of categorical predictors based on the models in Table 2. The predicted probabilities of falling into poverty when the household did not receive any government transfers were much higher than when the household received government transfers regardless of the inclusion of Social Security. The pattern was the same for all categorical predictors. In addition, the difference in predicted probabilities between models illustrated the varied poverty alleviation effect. Specially, greater drops of predicted probabilities of being poor after receiving government transfers were found among respondents who were females, African American and other races, and living in the South and Northeast regions.
Comparison of predicted probability of falling into poverty between different levels of categorical predictors

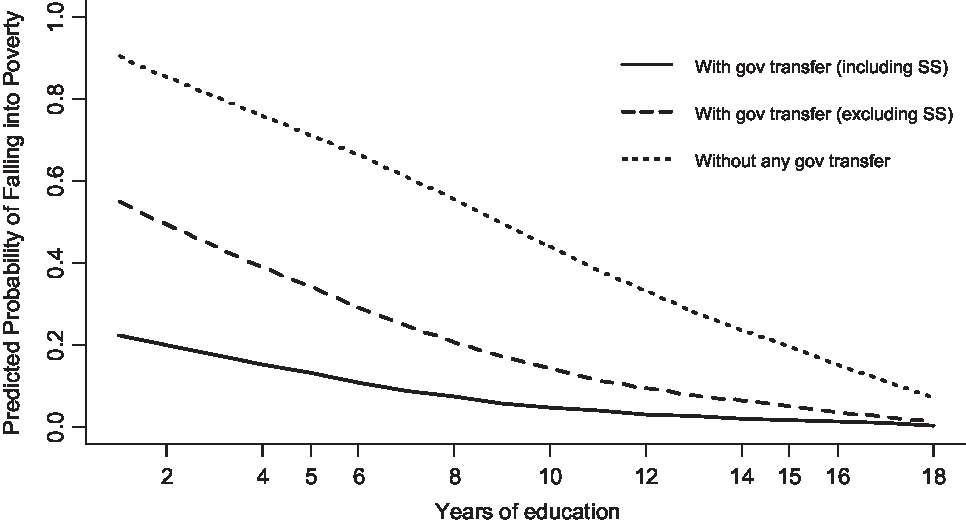
Figures 2–5 illustrate the trend of predicted probability of continuous predictors after controlling for other predictors. As shown in Figure 2, the predicted probability of being poor decreased as years of education increased. The probability of being poor was always highest when household income did not include any government transfers. However, after including government transfers, the probability dropped dramatically. The poverty alleviation effect was particularly greater for those who had fewer years of education.
Predicted probability of falling into poverty in three statuses of government transfer across years of education.
Note: SS: Social Security.

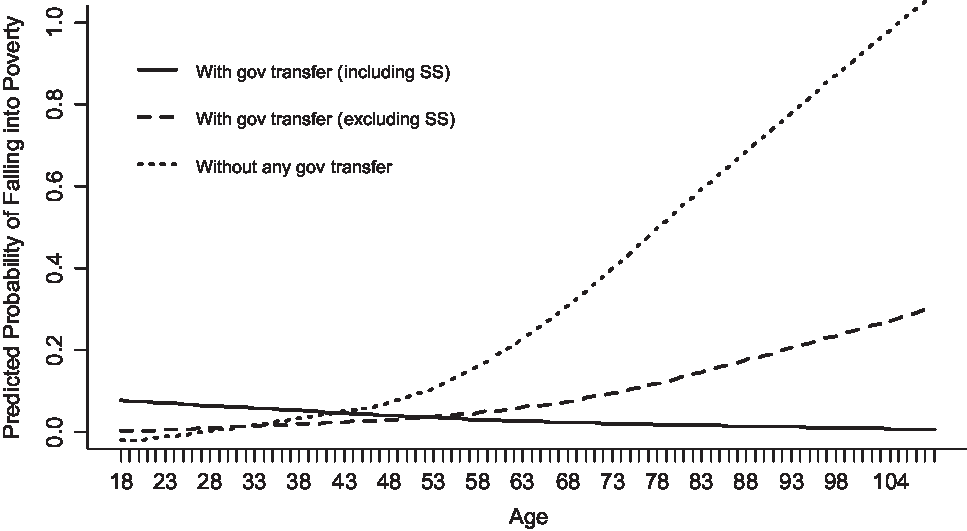
Predicted probability of falling into poverty in three statuses of government transfer across ages.
Note: SS: Social Security.

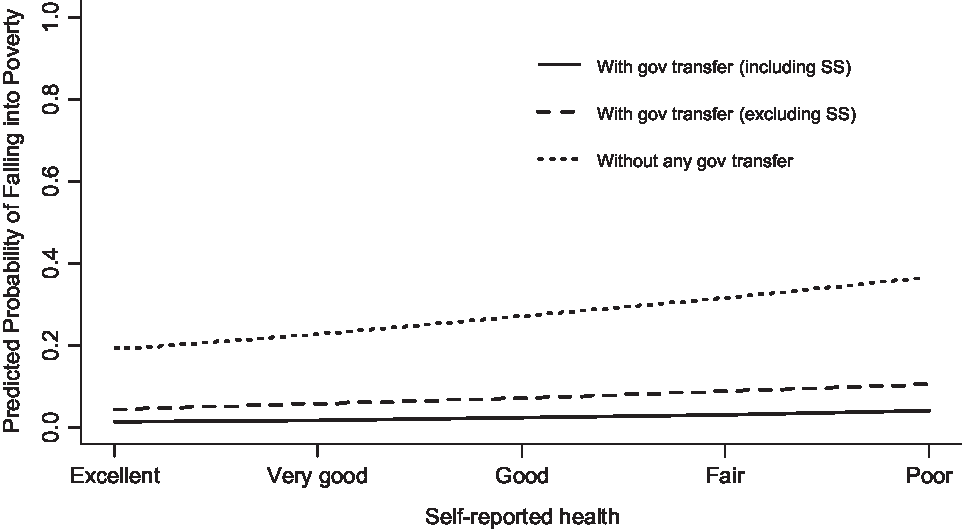
Predicted probability of falling into poverty in three statuses of government transfer across health conditions.
Note: SS: Social Security.

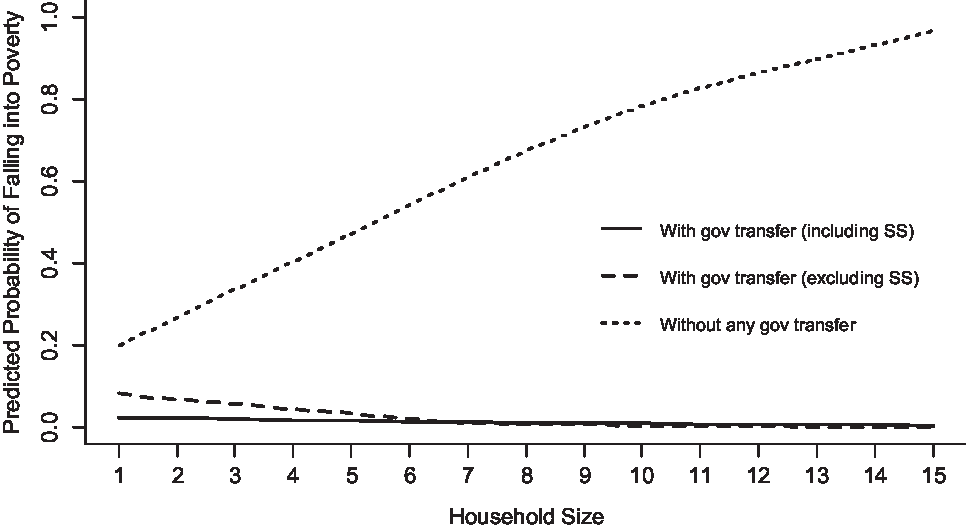
Predicted probability of falling into poverty in three statuses of government transfer across household size.
Note: SS: Social Security.

Regarding the age pattern, the predicted probability of being poor was stable when household income included all types of government transfers (Figure 3). However, if household income did not include any government transfers, the predicted probability increased exponentially from age about fifty-five. When household income received government transfers but did not account for Social Security, the predicted probability also increased but less dramatically. Interestingly, the predicted probability of being poor without any government transfers was lowest before the age of thirty, which may imply a negative influence of government transfers on young adults’ financial status.
Similarly, the poverty alleviation effect was greater among those who had poor self-reported health (Figure 4) and lived in a bigger household (Figure 5) considering their gap of predicated probabilities between household incomes with and without government transfers was greater.
Discussion
To summarise, this study found older adults’ risk of falling into poverty increased dramatically when their incomes excluded government transfers. Therefore, the answer to our first questions is yes; the evidence strongly suggested a beneficial effect of government transfers on American older adults’ economic well-being in the period 2002-2014. The results were consistent with previous findings (e.g. Ben-Shalom et al., Reference Ben-Shalom, Moffitt and Scholz2011; Rushefsky, Reference Rushefsky2017). When we accounted for government transfers into household income, the probability of American older adults falling into poverty dropped significantly. Especially for Social Security retirement, as one of the most universal and major public transfer programs in the U.S., its ability to ease old age poverty was undoubtedly strong (e.g. Moody and Sasser, Reference Moody and Sasser2018b).
To answer the second question, this study distinguished the poverty alleviation effect among different sociodemographic groups of older adults. The poverty alleviation effect was found to be stronger among respondents who were female, African American and other races, with fewer years of education, and with self-reported poorer health. The greater poverty alleviation effect for more vulnerable populations could be attributed to them having more potential for improvement from a lower base. Previous studies consistently have found that risk factors of poverty included being female, minority, having poor health, and lower education (e.g. Cellini et al., Reference Cellini, McKernan and Ratcliffe2008; Rushefsky, Reference Rushefsky2017); this study also found a similar pattern in Table 2. The lower initial level of financial status may further imply more room for improvement when there were government transfers. Helping the more disadvantaged groups via government transfers could be considered as timely and vital assistance to get through difficulties and meet their basic living needs. Thus, allocating resources to these groups could achieve the greatest marginal effect. Meanwhile, this study also indicated significant but smaller poverty alleviation effect for the counterpart groups, implying consistent and strong poverty alleviation effects of government transfers on the aging population generally. The positive policy outcomes highlight the necessity and importance of sustaining government transfers to benefit older adults, especially those who are more financially vulnerable.
In addition, the results highlighted more positive effects on poverty alleviation from government transfer for adults who are older and living in a larger household. That pattern is consistent with the trend indicated by Moffitt (Reference Moffitt2015) that preference of welfare programs shifted from non-elderly non-disabled families to elder, disabled, and married families. Historically welfare resource redistribution has been based on the concept of people’s deservedness for support (Ben-Shalom et al., Reference Ben-Shalom, Moffitt and Scholz2011), which could have originated from the punitive strategic focus of antipoverty programs in the 1980s (Haveman et al., Reference Haveman, Blank, Moffitt, Smeeding and Wallace2015). The norm of American society emphasises the values of family functionality and hard work. Adults are expected to work hard to live independently and support their own family. Vulnerable groups such as older adults and people with disability who could not earn enough to maintain their living needs are viewed as worthy of compassion and deserve public financial support (De Goede, Reference De Goede1996). People who are working hard but still fall into poverty are also seen as deserving support because they have demonstrated their aspiration rather than welfare dependence (Gilens, Reference Gilens2009). However, there were also media depictions stereotyping the welfare dependency of assistance recipients as undeserving poor (Misra et al., Reference Misra, Moller and Karides2003). These beliefs could influence policy preferences and further reshape the effect of welfare programs by bringing a more beneficial effect to the deserving poor. Mackenzie and Louth (Reference Mackenzie and Louth2019) made the criticism that the policy distinguishing deserving and undeserving poor did not help in reducing poverty and inequality. They argued against using market logic to punish or reward people, but favoured the use of a structural and proportionate universal approach to build a non-discriminatory environment (Mackenzie and Louth, Reference Mackenzie and Louth2019).
However, the results also suggested the possible behavioural side effects of government transfers on young adults’ work morale, although further in-depth examination is needed. As illustrated in Figure 3, young adults (aged eighteen to forty-five) who received government transfers had higher predicted probability of falling into poverty than their counterparts who did not receive government transfers. This implies younger adults’ income/employment status may be affected by the presence of government transfers. When some young people receive government transfers, they might have less incentive to work hard as they could depend on government-based assistance (Bitler and Hoynes, Reference Bitler and Hoynes2016). Thus their income would decrease. In extreme cases, some people even choose intentional unemployment to meet the eligibility requirements for accessing means-tested welfare programs (Bitler and Karoly, Reference Bitler and Karoly2015). This unintended side effect on young adults’ economic behaviour is in fact the essential argument from the critics of welfare programs (Rushefsky, Reference Rushefsky2017). However, this study was not able to examine that behavioural effect as we were constrained by the counterfactual assumption. Older adults’ economic behaviour may also change in the presence of government transfers, as noted in the research assumptions. Future research is strongly encouraged to explore this issue using other research methodology such as experimental design.
The poverty alleviation effect of government transfer programs in this study is confounded with social beliefs, demographic shifts, and societal inequity. Nevertheless, this study has contributed the latest evidence to the evaluation of antipoverty programs in the U.S. using a new source of data and further solidifies the positive effect of government transfers among older adults demonstrated in previous studies (Rushefsky, Reference Rushefsky2017; Moody and Sasser, Reference Moody and Sasser2018b). The evidence from these findings strongly suggests the need to sustain the government transfer programs to older adults considering their great poverty alleviation effect. This study further distinguished the effects on various demographic groups and interpreted them in the contemporary context. The greater poverty alleviation effects among the more vulnerable probably were observed because their financial status had more room to improve. Finally, we postulated that the stronger beneficial effect among people who were older and lived in a bigger household was because of the political belief that they were among the deserving poor. The concept of deservedness is rooted in American social values but is also stereotypically depicted and intensified by media images (e.g. Misra et al., Reference Misra, Moller and Karides2003). There is a need to correct misconceptions against people living in poverty and reverse the anti-welfare culture (Rushefsky, Reference Rushefsky2017).
This study comes with several limitations. First, the counterfactual assumption this study made may overestimate the poverty alleviation effect of government transfers. We posited older adults’ economic behaviour and other income sources would not change due to the presence/absence of government transfers, which might exaggerate the degree of redistribution that can be attributed to social transfers. The straightforward approach taken here also prevented this study from examining the effect of government transfers comprehensively or other potential behavioural side effects, as implied from Figure 3. Second, some measures used in this study were broad and could not include many details. For example, the regional comparison could be confounded with state-level variation. Future studies may consider comparing the policy evaluation effect using more detailed subdivisions of groups receiving government transfers. In addition, the evaluation was based on poverty status with and without government transfers, which was a pragmatic decision based on measurable economic information. Future research may consider other non-economic effects when evaluating these programs. Finally, in differentiating intergroup variations in poverty alleviation effect, we focused on comparing across age groups. Further explorations of cohort and/or period effects may be pursued in future research.
Conclusion
This study provided up-to-date evidence about the effect of government transfers on older adults in the U.S. by using longitudinal HRS data and has contributed to the policy debate on the rationality of antipoverty programs. Results found a positive alleviation effect on poverty among older adults, consistent with most previous studies. It is essential to learn that government transfers in the U.S. are still playing an important role in reducing poverty among older adults in changing societal contexts from 2002 to 2014. The U.S. experience offers implications for other countries that government transfers are still essential in fighting against poverty, especially for older adults. Findings from this study also have helped distinguish the effects of welfare programs on various demographic groups and provide advice for improving future policy implementation. The poverty alleviation effect was higher among people who were female, older, member of a minority group, lived in the South, had fewer years of education, reported poorer health, and lived in a bigger household. This finding implies that both developed and developing countries should optimise their antipoverty policy design to redistribute government transfers to the most financially vulnerable subgroups. Targeting those with more disadvantaged status could achieve better policy outcomes and improve overall social wellbeing. Despite our finding of the poverty alleviation effect of government transfer programs on older adults, many unresolved societal problems, such as potential behavioural effects, require continuous attention in ongoing efforts to fight against poverty.