Introduction
The application of any optimization technique strives toward the maximization or the minimization of an objective function called fitness function [Reference Jin, Olhofer and Sendhoff1]. The main objective of using optimization is to achieve the most satisfactory result for many kinds of problems. The major objective may be regarded as the fitness function, while the minor objectives may be considered as constraints while doing optimization. Many of the evolutionary optimization techniques are usually motivated by nature and hence also known as nature-inspired optimization techniques. They are being extensively applied in various electromagnetic applications. Some of the most commonly used nature-inspired techniques are Harmony Search (HS) [Reference Wang, Gao and Zenger2], Firefly Algorithm (FA) [Reference Ram, Mandal, Kar and Ghoshal3], Bat Algorithm (BA) [Reference Pal, Rai and Singh4], Ant Colony Optimization (ACO) [Reference Barbosa5], Particle Swarm Optimization (PSO) [Reference Yang and Yang6], Genetic Algorithm (GA) [Reference Nguyen, Duroc and Vuong7], Bacterial Foraging Optimization (BFO) [Reference Kumar, Ashwath, Kumar and Malmathanraj8], etc.
The interest in the design of fractal antennas [Reference Werner and Ganguly9–Reference Choukiker and Mudiganti14] has been continuously increasing since the past few years as they are a very good substitute for the large-sized antennas [Reference Thakare15, Reference Singhal, Goel and Kumar Singh16]. They have a very good ratio of electrical size to physical size compared to the traditional antennas. Novel kinds of fractal shapes are continuously being developed for the antennas in various bands and hence for numerous applications. These types of shapes are very much useful to design the compact antennas with wideband/multi-band characteristics [Reference Reha, El Amri, Benhmammouch and Said17, Reference Kaur, Rattan and Jain18]. A polygon-type fractal antenna [Reference Azari19, Reference Dhakad, Kumar, Yadav, Verma, Ramakrishnan and Singh20] is the basis of the proposed design in which hexagon is used as a polygon with various slots inside it. The microstrip feedline is used for feeding the proposed antenna.
In recent years, various antennas have been reported to be optimized using one or other techniques. In [Reference Zhu, Bandler, Nikolova and Koziel21], the authors optimized the return loss and impedance of the microstrip antenna using space-mapping optimization. In [Reference Liu, Yang, Li and Xie22], the authors designed an E-shaped microstrip antenna with a bandwidth optimized by the fitness function combined with the mind-evolutionary algorithm. A bow-tie antenna with the shape of a staircase has been optimized in [Reference Dadgarpour, Dadashzadeh, Naser-Moghadasi and Jolani23] by enhancing the bandwidth using finite-difference time-domain (FDTD) and PSO techniques together. In [Reference Islam, Misran, Take and Moniruzzaman24], the authors presented an optimized antenna in which the antenna bandwidth was enhanced by using PSO with a curve-fitting tool. An optimized wide bandwidth microstrip antenna based on the FDTD method and PSO is also reported in [Reference Ya-Min and Jia-Dong25].
In [Reference Ya-li, Guang, Shu-xi, Xi and Dong-chao26], an optimization technique called differential evolution (DE) algorithm along with a numerical electromagnetic code based upon the method of moments (MOM) has been applied to a yagi-uda antenna to optimize the impedance bandwidth. In [Reference Sánchez-Montero, López-Espí, Manjarres, Landa-Torres, Salcedo-Sanz and Del Ser27], the authors obtained outstanding antenna gains at different bandwidths for a particular inverted F-antenna by using an evolutionary programming algorithm. In [Reference Bayraktar, Komurcu, Jiang, Werner and Werner28], an inverted F-antenna loaded with stub has been optimized (in terms of return loss) by a technique called Wind-Driven Optimization (WDO) along with an electromagnetic solver FEKO based on MOM. In [Reference Monavar, Komjani and Mousavi29], another nature-inspired optimization technique Invasive Weed Optimization (IWO) has been employed to optimize the patch antenna. The objective was to achieve the bandwidth optimization along with the symmetrical antenna pattern. The antenna and frequency-selective surface (FSS) ground plane both have been optimized simultaneously. In [Reference Al-Azza, Al-Jodah and Harackiewicz30], a swarm intelligence-based technique called spider monkey optimization, which may be modeled on the foraging behavior, has been employed for the optimal E-shaped patch antenna design.
The authors in [Reference Singh and Singh31] demonstrated an optimized novel wideband fractal antenna by using the curve-fitting method in conjunction with PSO. This method increased the bandwidth of the antenna by an appreciable amount. Further, the design of a fractal monopole antenna and its return loss optimization using a real-coded genetic algorithm is presented in [Reference Bhattacharya, Roy, Vinit, Bhattacharjee, Bhaumik, Chakrabarti, De, Bag and Mukherjee32] that shows the optimization in terms of peak resonance and impedance bandwidth. Another nature-inspired technique bat flower pollination has been proposed by the authors in [Reference Salgotra and Singh33] for the synthesis of an array having a non-uniform spacing between the elements. It has been proved to provide finer results than many other algorithms like GA, PSO, DE, etc. In [Reference Kaur, Rattan and Jain18], the authors proposed two techniques GA and BA for optimizing the return loss characteristics of a specific type of slotted fractal antenna and showed that BA offers more optimized results than GA. A very robust technique known as IWO has been applied on a fractal patch antenna in [Reference Emamghorashi and Mohajeri34] to optimize the return loss and hence the antenna efficiency.
One more soft computational technique called adaptive bacteria foraging optimization (ABFO) has been used to optimize a coplanar waveguide fed patch antenna in [Reference Gupta, Saxena and Bhatia35]. The antenna designed using HFSS has been optimized using the curve-fitting technique and ABFO to convert the dual-band characteristics into wideband characteristics. In [Reference Banerjee and Mandal36], side lobe level (SLL) optimization and steering the major beam have been demonstrated for all the array elements using PSO combined with cat swarm optimization. Further, a combined GA-PSO technique has been demonstrated in [Reference Ponnapalli, Pappu, Srinivasulu, Anguera, Satapathy, Bhateja and Sunitha37] to optimize the rhombic-shaped fractal arrays that may be employed for the various wireless and space applications. In [Reference Das, Mandal, Ghoshal and Kar38], a circular antenna array has been designed and optimized using ant lion optimization (ALO) to reduce the interference. The results obtained show appreciable improvement in SLL. In [Reference Gupta, Saxena and Bhatia39], the authors designed a square fractal antenna that has been optimized using an algorithm combining bacteria foraging optimization and PSO to optimize the bandwidth. Some modifications have been done in the algorithm to upgrade the convergence behavior.
The proposed work shows the designing of a novel fractal slotted microstrip antenna using HFSS software version 17.0 followed by the implementation of one of the most recent nature-inspired meta-heuristic optimization techniques called “Lightning Attachment Procedure Optimization (LAPO)” [Reference Nematollahi, Rahiminejad and Vahidi40] combined with the curve-fitting method to that fractal slotted antenna. Moreover, this optimization technique has not been applied in its usual way but after some modification of its exploitation phase. The result shows that the Modified LAPO (MLAPO) provides slightly better results than the normal LAPO technique due to improved exploration search as well as exploitation search and faster convergence. The dimensions of the optimized antenna after being optimized by the above mentioned algorithm have been presented in this paper. The proposed fabricated antenna works in the frequency range of 5.64–8.63 GHz (except a little notch) with exceptional resonance characteristics at 5.94 GHz and has been proven to be quite optimized in terms of impedance bandwidth. The results obtained have also been validated with the parametric analysis. Further, the optimized dimensions and optimized results obtained for the MLAPO-implemented design have been compared with those obtained for the normal LAPO-implemented design as well as PSO-implemented design. Finally, the comparison of the proposed optimized simulated antenna has been done with the fabricated prototype. The results have been found to be in very close proximity with each other. The proposed antenna has a peak measured gain of 6.92 dB and is quite useful in various C-band and X-band applications.
Further, the proposed work is organized as follows: In section “Antenna design/geometry” (next section), the design and layout of the proposed inscribed hexagonal fractal slotted microstrip antenna (IHFSMA) are presented. Section “Lightning Attachment Procedure Optimization” discusses the LAPO algorithm in detail and section “Modified Lightning Attachment Procedure Optimization” discusses MLAPO algorithm that is used for the optimization of impedance bandwidth of IHFSMA in this paper. Section “Optimization of IHFSMA using MLAPO” explains the steps used for the MLAPO optimization of IHFSMA. The optimized results along with their validation are presented in section “Results and discussion” that also shows the comparison of the optimized results with the results obtained by applying LAPO and PSO techniques on the design. The simulated results are also compared with their measured counterparts. At last, a brief conclusion is drawn.
Antenna design/geometry
The design of the proposed antenna is shown in Fig. 1. The brown portion represents the copper part and the white portion represents the substrate (etched) part.
Geometry of the proposed antenna (with dimensions).

This antenna consists of inscribed hexagonal fractal slotted rectangular patch (with the outer hexagonal geometry used as a basic fractal geometry), FR4 substrate, rectangular ground plane, probe, and SMA connector. The different fractals and slots increase the bandwidth and improve the impedance matching [Reference Ali, Prasad and Biradar41–Reference Pandey, Singhal and Singh43]. This whole patch is designed on a 40 × 40 mm2 FR-4 epoxy dielectric substrate having a depth of 3.2 mm and a dielectric constant of 4.28 with a loss tangent of 0.01 and a port chosen as the lumped port. The ground plane having same length and width as the substrate is used here. The microstrip feedline with 50 Ω characteristic impedance is used for providing the feed and excitation to the antenna. All of these slotted recurrent coils tend to provide the enhancement of radiation pattern, gain as well as impedance bandwidth to this proposed antenna [Reference Mondal, Maity, Ghatak and Chaudhuri44].
The different dimesions of the proposed antenna are shown in Fig. 1 and Table 1.
Dimensions of the proposed antenna

Some geometric parameters that will be considered for the optimization are width of the outermost rectangular patch (W1), length of the outermost rectangular patch (L1), width of feedline (W2), and distance (gap) between two hexagonal parasitic patches or slots (Δ1).
Lightning Attachment Procedure Optimization
LAPO [Reference Nematollahi, Rahiminejad and Vahidi40] is one of the latest meta-heuristic techniques. It is motivated by the process of lightning through the cloud. The lightning procedure includes the air breakdown on the surface of cloud, movement of light downwards, upward inception of the leader, and final jump. The air breakdown on the cloud surface is due to the breakdown between a large negative charge or a small positive charge at the bottom of the cloud and a large positive charge at the top of the cloud. The breakdown of air occurs at the edge of the cloud that is followed by the movement of lightning toward the ground using random direction steps. The next step of lightning toward the ground is decided on the basis of higher electrical field available at that point. If two points have same electrical field, then lightning breaks down into two branches. This process is followed until the lightning reaches the ground or the charge becomes less than a threshold value. At the same time, the upward leader moves from the ground toward the cloud due to a positive charge beneath the ground and a huge negative charge on the cloud. In this way, the upward leader approaches the downward leader and finally both strike at a striking point to neutralize the charge of the cloud [Reference Wang and Jiang45]. The complete process can be easily understood by the LAPO algorithm described below.
LAPO Algorithm (N, B, Miter)
Here, N is the population size and B indicates the bounds (lower as well as upper) for each variable. B(i,0) and B(i,1) give the lower and upper bounds of the i th parameter, respectively. Miter is the maximum number of iterations.

The LAPO procedure initiates with the population generation and computes the fitness value for each point. The process is continued with a search of next jumping point for each point and upward movement of leaders to produce the best points. This procedure can be applied to any particular fitness function to optimize the corresponding process. This process is modified for the improved performance (discussed in the next section).
Modified Lightning Attachment Procedure Optimization
LAPO algorithm as described in the previous section is a metaheuristic technique that balances the exploration and exploitation phase [Reference Nematollahi, Rahiminejad and Vahidi40, Reference Wang and Jiang45]. LAPO algorithm is modified in this section by improving the exploitation phase which indirectly also improves the exploration phase. The modification in the exploration and the exploitation phase to explore the search space improves the capability of algorithm. MLAPO selects a point that moves toward the best point while going away from the worst point. This is done by using equation (1).

where rpbest and rpworst are the best and worst reference points, respectively. This new point is accepted only if it is better than the existing point. The resultant point is used to calculate the average in the next iteration which improves the exploration capability of the algorithm. The complete process of the MLAPO is described in the following algorithm.
MLAPO Algorithm (N, B, Miter)
Here, N is the population size and B indicates the bounds (lower as well as upper) for each variable. B(i,0) and B(i,1) give the lower and upper bounds of th i th parameter, respectively. Miter is the maximum number of iterations.

MLAPO algorithm described above generates a population that moves toward the ground in the next step and upward movement of the leader at the same time. This is followed by the movement of point toward the best point and away from the worst point. The complete process is followed to search the best reference point in the search space. The next section discusses the optimization of the antenna using the MLAPO algorithm.
Optimization of IHFSMA using MLAPO
The performance of any antenna depends upon the geometry of the antenna. This paper discusses an IHFSMA shown in Fig. 1. The dimensions of the antenna shown in Table 1 are selected on the experimental basis with hit-&-trial approach for the efficient performance of the antenna. However, the experimental benchmark does not cover the complete state-space resulting in the availability of better point. Moreover, it requires a lot of time for iterative simulations. The optimization technique discussed above is automatic and hence superior to hit-&-trial approach. The best thing about applying optimization technique is that much better design performance is achieved than the conventional iterative simulations. This paper applies the LAPO and the MLAPO algorithm on IHFSMA to determine the optimized value of L1, W1, W2, and Δ1 to improve the bandwidth. The complete flow of the optimization process is shown in Fig. 2.
Flow of the IHFSMA optimization.

Figure 2 shows the steps to optimize the IHFSMA. The process starts with population generation by the parametric variation. This step includes the generation of reflection coefficient values at different values of L1, W1, W2, and Δ1. For creating a dataset, L1 is varied by 0.5 mm in each step within its bounds, W1 is varied by 1 mm in each step within its bounds, W2 is varied by 0.1 mm in each step within its bounds, and Δ1 is varied by 0.1 mm within its bounds. The lower and upper bound values for L1, W1, W2, and Δ1 are shown in Table 2. Hence, all the variations for each of the four parameters within their bounds at 226 values of frequency (from 5 to 9.5 GHz) resulted in the overall 12 656 points to serve as complete population.
Bounds for each parameter

In the next step, these 12 656 points are preprocessed using equations (2) and (3).


Equation (2) pre-processes the population by replacing the reflection coefficient values lower than −10 dB with −10 as bandwidth may be calculated through the reflection coefficient values falling lower than −10 dB. Then, the average of all the frequencies (denoted as N) is taken to generate one point for each variation by using equation (3). The pre-processing by equation (3) generates 12, 19, 15, and 10 points for parameters L1, W1, W2, and Δ1, respectively. These points are used by the curve-fitting tool in MATLAB to generate the equation for each parameter. Here, the equations of degree 5 are generated for each parameter expressed by equations (4–7).


Equations (4–7) express the relation of impedance bandwidth X with L1, W1, W2, and Δ1 values, respectively. In a similar way (5–7) are generated. Then the optimized value of these parameters is generated by MLAPO with the fitness function given by (8).

The complete process of MLAPO as defined in the previous section is repeated until the stopping criterion is satisfied by parameters (L1, W1, W2, and Δ1) using the fitness function F (given by (8)). The MLAPO gives the optimized values of the parameters L1, W1, W2, and Δ1. The implementation of IHFSMA over the resulting dimensions to analyze the performance of the antenna is discussed in the next section.
Results and discussion
It is seen from the above section that the optimization of impedance bandwidth for IHSFMA is done by optimizing the geometry of antenna using the MLAPO technique with curve fitting. This section discusses the reflection coefficient and the impedance bandwidth results of the design obtained using the MLAPO technique along with those obtained using the actual design. FEM-based HFSS 17.0 is used for designing both the actual as well as the optimized antenna. Also, the MLAPO optimized results are compared with the LAPO optimized results as well as the PSO optimized results to indicate the superiority of the MLAPO technique over the other techniques. Further, the validation of the optimized geometry is done by using a parametric variation. At last, the comparison of the simulated results with the measured results obtained with the prototype is done in the last sub-section.
Analysis of impedance bandwidth optimization
The actual design shown in Fig. 1 marks the dual-band behavior at resonant frequencies 6.06 and 7.97 GHz with the corresponding frequency bands 5.92–6.45 GHz and 7.28–8.35 GHz as shown by a black solid curve in Fig. 3. As discussed earlier, there are four parameters considered for optimization – L1, W1, W2, and Δ1. The optimized geometrical parameters after applying the curve-fitting and MLAPO technique in MATLAB are shown in Table 3. Rest of the geometrical parameters are the same as shown in Table 1.
Reflection coefficient for the actual (unoptimized) antenna and the MLAPO optimized antenna.

Optimized parameters of the proposed design

The optimized antenna bandwidth analysis is focussed on the values of reflection coefficient from 5 to 9.5 GHz. The return loss after the implementation of curve fitting along with the MLAPO is shown by a red solid curve in Fig. 3. It is evident that after applying the optimization technique, the return loss is drastically changed from −29.40 to −44.92 dB and the impedance bandwidth is also increased from the overall 1600 MHz dual band (i.e. 530 MHz for band 1 and 1070 MHz for band 2) to a single band of a much wider bandwidth 2480 MHz.
Comparison of optimization techniques
In Fig. 4, the comparison of return loss characteristics for the actual or unoptimized design (black curve), PSO optimized design (red curve), LAPO optimized design (green curve), and MLAPO optimized design (blue curve) is shown. The improved values of the reflection coefficient and the impedance bandwidth are due to the better exploration search performed in the complete search space to find the better values of designing parameters. The better exploration is due to the movement away from the worst solution. It proves the greatness of the MLAPO technique over the other techniques in terms of return loss and 10 dB impedance bandwidth.
Comparison of the reflection coefficient plot for the actual, PSO, LAPO, and MLAPO optimized designs.

Table 4 illustrates the comparison of actual design with all the three optimized designs. It may be observed that the optimized geometrical parameters come out to be different in each optimized design. Further, the optimized dimensions in case of the MLAPO technique yield the value of return loss as −44.92 dB that is much better than the other three designs. The impedance bandwidth obtained in case of the MLAPO design is 2480 MHz that is higher than its counterparts in case of other designs. It indicates that the impedance bandwidth obtained in the MLAPO design is 55% higher than that in the actual design. This is due to the selection of better parameter values within the given range of the parameters by the MLAPO technique. The better values are selected due to the balanced exploration and exploitation search due to three-time update in one iteration. Also, the peak gain in the MLAPO design is highest among all the designs.
Comparison of the actual, PSO, LAPO, and MLAPO optimized designs

Figure 5 shows the variation of the peak gain with respect to frequency. The peak gain for the MLAPO design is 6.77 dB for the corresponding band of 5.71–8.19 GHz. This peak gain is higher than all the other designs discussed (although the main objective is to optimize the return loss but the peak gain obtained is also appreciable). The increased peak gain is due to the exploitation search performed by the MLAPO to find the optimized parameter values for the antenna. The better exploitation search is due to the movement toward the optimum solution.
Peak gain for the actual design and optimized designs.

Parametric validation
The corroboration of the optimized geometric values may be done with the help of a parametric variation (i.e. one parameter out of the four parameters shown in Table 3 is varied keeping all others constant).
Figure 6 shows the variation of the reflection coefficient for the values of W1. This effect may also be observed from the data values shown in Table 5. By choosing the value of W1 as 25.7 mm, the optimized antenna presents the exceptional value of reflection coefficient (i.e. −44.92 dB) and the highest value of bandwidth (i.e. 2480 MHz), while the other values of W1 (i.e. 24.1 and 27.3 mm) yield much lesser values of impedance bandwidth and reflection coefficient. The variation in the resonant frequencies may also be observed from the graph.
Validation of the optimized “W1” by different values.

Corroboration of the optimized “W1” by parametric variation

Figure 7 shows the plot of the reflection coefficient for the various values of L1. A deep insight has been provided in Table 6. By choosing the value of L1 as 29.4 mm, the optimized design shows the maximum reflection coefficient and the highest value of bandwidth. Taking L1 as 27.5 mm, the maximum reflection coefficient is quite lesser than the optimized one while taking L1 as 31.2 mm, the impedance bandwidth is quite lesser than the optimized one. There is some shift in the resonant frequencies too with the variation in L1.
Validation of the optimized “L1” by its different values.

Corroboration of the optimized “L1” by parametric variation

Figure 8 shows the effect of feedline width W2 on the reflection coefficient of the proposed antenna. Table 7 also indicates the effect of varying W2. The feedline width taken as 3.7 mm refers to the best reflection coefficient variation as well as the impedance bandwidth, while the feedline width taken as 3.4 and 4.0 mm refer to lesser values of the reflection coefficient and the impedance bandwidth. It may be seen that the variation in feeedline width by a small margin does not affect the bandwidth and reflection coefficient by an appreciable amount.
Validation of the optimized “W2” by its different values.

Corroboration of the optimized “W2” by parametric variation

It may be observed from Fig. 9 and Table 8 that choosing the value of Δ1 also affects the reflection coefficient. The blue solid line shows the best impedance bandwidth and the reflection coefficient for Δ1 = 1.3 mm, while the corresponding values for Δ1 equal to 1.1 and 1.5 mm are shown by dotted black and dotted red lines, respectively. The feedline of width 1.1 mm provides the reflection coefficient of −24.70 dB and the impedance bandwidth of 1960 MHz, while the feedline of width 1.5 mm yields the reflection coefficient of −28.32 dB and the impedance bandwidth of 2030 MHz.
Validation of the optimized “Δ1” by its different values.

Corroboration of the optimized “Δ1” by parametric variation

It may be concluded that all the parameters obtained by curve fitting in conjunction with the MLAPO algorithm are the optimized parameters in the true sense.
Experimental results and analysis
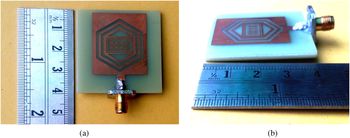
The proposed geometrically optimized antenna is fabricated on the FR4 substrate of a thickness 3.2 mm, a dielectric constant 4.28, and a loss tangent 0.01 (as specified on the specification sheets) with the microstrip feedline. Its top view and side view are shown in Fig. 10. Here, a 50 Ω SMA connector is used for connecting the feedline to the Vector Network Analyzer (VNA).
(a) Top view and (b) side view of the optimized fabricated antenna.

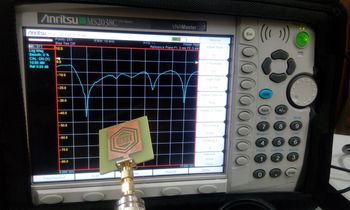
Figure 11 shows the variation of the experimental reflection coefficient (S 11) in dB for the fabricated prototype. The measurement is taken with the ANRITSU VNA model MS 2038C as shown.
Experimental set-up of the fabricated proposed antenna connected with the Vector Network Analyzer.

Figure 12 shows that the measured results (dotted red curve) obtained with VNA are in very much agreement with the simulated results (solid blue curve). A small difference between the practical and simulated values is because of the lossy nature of FR4, soldering temperature, and soldering tolerances. Table 9 also depicts the simulated and measured readings corresponding to resonant frequencies, impedance bandwidth, and S 11. There are four resonant frequencies observed in each of the readings. It may be observed that the measured bandwidth (2760 MHz) is even higher than the simulated bandwidth (2480 MHz). The maximum value of the reflection coefficient (−46.10 dB) for the fabricated optimized design also coincides with the corresponding value (−44.92 dB) for the simulated optimized design, and the peak resonant frequency (i.e. 5.94 GHz) corresponding to the maximum reflection coefficient for the measured results and that (5.92 GHz) for the simulated results are also in very much agreement. The other three resonant frequencies for the measured results and the simulated results have also been shown.
Simulated and measured reflection coefficient for the optimized proposed design.

Comparison of the reflection coefficient between the simulated and measured values

Figure 13 shows the set-up inside the anechoic chamber that is properly calibrated before the measurement of radiation pattern and gain, to make any kind of losses negligible. The broadband antenna named AMITECH DRH-20 Dual Ridge Horn Antenna having high gain 8.5 dBi, very small value of Voltage Standing Wave Ratio (VSWR), and frequency range dc to 18 GHz is used as a transmitting antenna, while the fabricated antenna is used as a receiving antenna at the Fraunhofer region. The power measurement set-up consists of ANRITSU MS 2038C VNA used in the Spectrum Analyzer Mode and Rohde & Schwarz SMF-100A Signal Generator (100 KHz–22 GHz).
Antenna set-up inside the anechoic chamber.

Figure 14 shows the measured radiation pattern (red dotted curve) and the simulated radiation pattern (solid blue curve) for the peak resonant frequency 5.94 GHz for the values of azimuth angle varying from −180° to 180° (with 5° increment) in both XY and XZ plane. The simulated radiation pattern is directly plotted in HFSS 17.0, while the measured radiation pattern is plotted using the received power values obtained in VNA (used in spectrum analyzer mode). The measured radiation patterns are less smooth because of some tolerance of the measuring device. It is evident from the graph that the measured results very closely follow the simulated results.
Radiation pattern at 5.94 GHz for (a) Phi = 0° (XZ plane) (b) Phi = 90° (YZ plane).

Gain is one of the most important parameters to know about the directivity of the antenna. The comparison of the simulated gain and the measured gain in Fig. 15 through the frequency band 5–9.5 GHz shows that they are also in very close agreement with each other. The simulated peak gain is 6.77 dB for the simulated 10 dB frequency band, while the measured value of peak gain is 6.92 dB for the measured 10 dB frequency band. This comparison has been shown in Table 10 that indicates that both measured peak gain and simulated peak gain are corresponding to 7.4 GHz frequency. It may be concluded that the gain of the proposed optimized antenna is also quite appreciable.
Simulated and measured peak gain for the optimized design.

Comparison of peak gain between the simulated and measured values

Conclusion
An IHFSMA with some additional geometry and inside slots has been used for the optimization in this paper. The curve-fitting method with the MLAPO technique has been used for the optimization of impedance bandwidth. The optimized geometrical parameters are validated with the parametric variation method to verify the reliable optimization. The impedance bandwidth obtained by the MLAPO technique has been found to be better than that obtained by the PSO and normal LAPO algorithm. The measured results obtained by the prototype of the optimized antenna have been found to be in very good agreement with the simulated results. The proposed optimized antenna is suitable for the point-to-point high speed wireless applications (6.2 and 7.1 GHz). Besides, it finds the applications in WLAN (5.725–5.825 GHz), ISM (5.725–5.875 GHz), RTTT (5.795–5.815 GHz), Amateur satellite (5.83–5.85 GHz), WAVE (5.85–5.925 GHz), Uplink satellite communication (5.9–6.4 GHz), FSS (6.725–7.025 GHz), MSS feeder links (6.925–7.075 GHz), Mobile satellite applications (7.25–7.375 GHz), ITU assigned X-band (7.25–7.75 GHz and 7.90–8.40 GHz), Mobile applications (8.025–8.20 GHz), Space research (8.4–8.45 GHz), and Level Probing Radar applications (6–8.5 GHz).
Acknowledgements
The research work has been well supported by the RIC Department of IKGPTU, Kapurthala, Punjab, India as well as the Advanced Microwave & Antenna Testing Laboratory of the G.B. Pant Engineering College, New Delhi, India.
 Rohit Anand is currently pursuing his Ph.D. degree from IKG Punjab Technical University, Kapurthala, India. He has done his B.E. (Honors) in Electronics and Communication Engineering from M.D. University, Rohtak, India in 2001 and M. Tech. in Electronics and Communication Engineering from P.T.U. Kapurthala, India in 2008. He has a teaching experience of more than 17 years including UG and PG courses. He is a Life Member of Indian Society for Technical Education (ISTE). He has published five book chapters and more than 30 papers in the national and international conferences and journals. His research areas include electromagnetic field theory, antenna theory, image processing, optical fiber communication, etc.
 Paras Chawla received his Ph.D. degree from Thapar University, Patiala, India. He has done B.Tech. (Honors) and M.Tech. degrees in Electronics and Communication Engineering from Kurukshetra University and NIT, Kurukshetra, respectively. He has more than 14 years of teaching experience and currently working as a Professor and HOD in the ECE Department at Chandigarh University, Mohali (India). A total of 16 M.Tech. dissertations of various fields of ECE have been guided by him successfully. He is also guiding seven Ph.D. students. He received the “Coventor Scholarship award” from MANCEF, New Mexico, USA for his proposal titled “Performance & Analysis of RF Front Section of Mobile Terminal Using RF MEMS DC Contact Switches” in 2010. His team received “Tenderfoot Award” consecutively for 2 years given in collaboration by American Astronautical Society, American Institute of Aeronautics, NASA/Goddard Space Flight Centre, NASA/Jet Propulsion Laboratory & Naval Research Laboratory for “CanSat Competition”, June 2015 and 2016, Burkett, Texas, USA. His main research interests include microstrip antennas, RF MEMS, RF front-end mobile terminal, wireless and mobile communication, optimization algorithm for RF circuits, LTE, and 5G. He has published more than 50 papers in various reputed national and international journals/conferences and 10 patents filled.