Introduction
Integrating cover crops is one approach to sustainably intensifying cropping systems. Cover crops can provide the benefits of adopting cover crops and add production costs to agronomic systems (Snapp et al., Reference Snapp, Swinton, Labarta, Mutch, Black, Leep and Nyiraneza2005). Benefits include ecosystem services such as, promoting cash crop productivity, enhancing overall soil fertility (Blanco-Canqui et al., Reference Blanco-Canqui, Claassen and Presley2012), soil and water conservation, nutrient scavenging, cycling and management, enhancing pest management strategies and providing livestock feed (Delgado et al., Reference Delgado, Dillon, Sparks and Essah2007). Costs can include increased production costs, planting delays (Snapp et al., Reference Snapp, Swinton, Labarta, Mutch, Black, Leep and Nyiraneza2005) and the potential to reduce subsequent cash crop yield due to soil moisture depletion (Nielsen et al., Reference Nielsen, Lyon, Hergert, Higgins, Calderón and Vigil2015). In Illinois, seeding a cereal rye (Secale cereal L.) and daikon radish (Raphanus sativus L.) cover crop mixture at 84 kg ha−1 seeding rate, cost between $116–117 ha−1 to establish (Roth et al., Reference Roth, Ruffatti, O'Rourke and Armstrong2018). If full season cover crops are used, the opportunity cost of lost cash crop income for the year needs to be considered (Snapp et al., Reference Snapp, Swinton, Labarta, Mutch, Black, Leep and Nyiraneza2005) in addition to the production costs of the cover crops.
Seeding cover crops following cash crops in the same growing season may reduce lost opportunity costs associated with cover crop production, especially if there are benefits to the subsequent crop. In the northern Great Plains, a short growing season, limited soil moisture (Farahani et al., Reference Farahani, Peterson, Westfall, Sherrod and Ahuja1998) and variable climate can restrict crop production. Producers in the region have adopted no-till planting (Hansen et al., Reference Hansen, Allen, Baumhardt and Lyon2012), which increases available soil moisture and resulted in producers looking to increase crop diversity (Aguilar et al., Reference Aguilar, Gramig, Hendrickson, Archer, Forcella and Liebig2015). The desire to enhance crop diversity increased interest in using including short season pulse crops such as dry pea (Pisum sativum L.) in the rotation. Because of this interest, dry pea harvested acreage in North Dakota increased from 38,850 hectares in 1998 to 161,874 hectares in 2010 (NASS, 2020). The early harvest of dry pea provides opportunities for seeding a late-season cover crop in the same growing season. Liebig et al. (Reference Liebig, Hendrickson, Archer, Schmer and Nichols2015) reported on an established study in Mandan, North Dakota that evaluated the impact of late-seeded cover crop monocultures and mixtures on nitrogen conservation, soil water and near-surface soil properties.
Improvement in cash crop yields was one of the top three benefits that non-users of cover crops would look for in cover crops (SARE and CTIC, 2015). However, while producers have reported increases in corn, wheat and soybean yields following cover crops (CTIC, 2017), research findings have been much less definitive. An review by Blanco-Canqui et al. (Reference Blanco-Canqui, Shaver, Lindquist, Shapiro, Elmore, Francis and Hergert2015) indicated cover crops can increase, decrease or have no effect on crop yield while a meta-analysis of 65 studies conducted between 1965 and 2015 indicated that winter cover crops had no impact on corn yield (Marcillo and Miguez, Reference Marcillo and Miguez2017). Still, there have been reports of increased corn yield in Michigan when it was grown with a red clover cover crop compared to no cover crops (Mutch and Martin, Reference Mutch and Martin1998) and in California, dryland wheat yields did not differ between fertilized plots that were fallowed and unfertilized plots that were fallowed but had cover crop biomass added (McGuire et al., Reference McGuire, Bryant and Denison1998). The impact of cover crop mixture vs monocultures on crop yield is also unclear. For example, a New Hampshire study demonstrated no differences in oat yields that followed cover crop mixtures or monocultures (Smith et al., Reference Smith, Atwood and Warren2014). Interestingly, in eastern Colorado and western Nebraska water use was the same for cover crop mixtures and cover crop monocultures (Nielsen et al., Reference Nielsen, Lyon, Hergert, Higgins, Calderón and Vigil2015).
The impact of diversity in cover crops has received less emphasis (Wortman et al., Reference Wortman, Francis, Bernards, Drijber and Lindquist2012a) than it has in perennial crops (Tilman et al., Reference Tilman, Reich, Knops, Wedin, Mielke and Lehman2001). Using multi-species cover crop mixtures and diverse crop rotations may allow producers to capture the benefits of cover crops without sacrificing yield (Hunter et al., Reference Hunter, Schipanski, Burgess, LaChance, Bradley, Barbercheck, Kaye and Mortensen2019). An evaluation of mixtures vs monocultures in multiple sites in southeastern Nebraska, found increased productivity with mixtures (Florence et al., Reference Florence, Higley, Drijber, Francis and Lindquist2019). The authors believed the mixtures were more productive because average productivity for the monocultures was decreased by poor performers. Species composition may also impact productivity. Murrell et al. (Reference Murrell, Schipanski, Finney, Hunter, Burgess, Lachance, Baraibar, White, Mortensen and Kaye2017) found that grasses overperformed and brassicas underperformed in mixtures compared to monocultures. Although, mixtures may not be more productive, increasing diversity in row-crop systems can improve ecosystem functioning and enhance corn yield (Smith et al., Reference Smith, Gross and Robertson2008).
The controversy about the positive effect of species diversity on productivity may exist because mechanisms responsible for providing the productivity increase are unidentified (Cardinale et al., Reference Cardinale, Duffy, Gonzalez, Hooper, Perrings, Venail, Narwani, MacE, Tilman, Wardle, Kinzig, Daily, Loreau, Grace, Larigauderie, Srivastava and Naeem2012). One of the common measurements of the positive effect of diversity is overyielding (Bonin and Tracy, Reference Bonin and Tracy2012), the process where a species yields more in a mixture than in a monoculture. This has reported in cover crop mixtures in both Nebraska (Wortman et al., Reference Wortman, Francis and Lindquist2012b) and New Hampshire (Smith et al., Reference Smith, Atwood and Warren2014). Overyielding is generally considered to be either transgressive (the mixture produces more than the most productive monoculture) or non-transgressive (the species in the mixture produce more than expected by the monoculture yields but do not out-yield the most productive species).
Although these two measures can help detect overyielding, they do not provide insights into how overyielding occurs (Hector, Reference Hector2006; Bonin and Tracy, Reference Bonin and Tracy2012). Overyielding can occur because of niche differentiation or facilitation [complementary effects (CEs)], or because of a selection process that favors species with certain traits [selection effects (SEs)] (Loreau and Hector, Reference Loreau and Hector2001). If overyielding occurs in cover crop mixtures, understanding why it occurs can help in developing cover crop mixtures.
This paper reports on two additional hypotheses developed for the same study. We hypothesized that (1) the inclusion of cover crops would positively benefit subsequent crop yields and (2) cover crop mixtures would be more productive and provide greater subsequent cash crop yield benefits than would cover crop monocultures. We also evaluated if overyielding occurred in late-seeded cover crop mixtures and if so, what mechanisms led to this overyielding.
Materials and methods
Site description
Three research sites, located on the Area IV Soil Conservation Districts (SCD) Research Farm ~6 km south of Mandan, ND (46°46′12″N, 100°54′57″W), were used for each study year (2008–2010). The sites were ~2 km apart and had the same management history, topography and soil type. Soils were dominated by a mix of Temvik and Wilton silt loams (USDA: fine-silty superactive, frigid Typic and Pachic Haplustolls; FAO: Calcic Siltic Chernozems). Long-term (98 yr) mean annual precipitation is 412 mm, with 79% of the total received during the growing season (April–September) and long-term mean annual temperature averages 4°C.
Weather data
Weather data were collected from a North Dakota Agricultural Weather Network (NDAWN) station located within 3 km of the research sites (NDAW-North Dakota Agricultural Weather Network, 2016). Weather data collection was initiated with cover crop planting. Cool-season growing degree days (GDD) were based on the canola GDD, which was calculated without a maximum temperature and with a 5°C base temperature. The warm-season GDD were based on the corn GDD, which was calculated using a maximum of 30°C and a minimum of 10°C. The formulas for both GDD calculations can be found at the NDAWN web site (NDAWN, 2016). Precipitation was recorded for the study period at the same location, again initiating at the same time as cover crops were seeded. Precipitation for the cash crops was recorded from April through October at the same location.
Precipitation during the cover crop growing season was 50 and 75% greater in 2009 and 2010 than in 2008 (Fig. 1). The longest lapse between cover crop seeding and the initial precipitation event >1 mm was 16 days in 2009. 2010 had the longest growing season for cover crops (Fig. 1). Both warm- and cool-season GDD were consistent between years. Warm-season GDD only varied by 5 GDD between years while cool-season GDD varied by 17 GDD. April through October precipitation for the cash crops was 484, 481 and 508 mm for 2009, 2010 and 2011, respectively.
Warm-season and cool-season growing degree day (GDD) accumulation and precipitation events recorded after the seeding of the cover crops for 2008, 2009 and 2010. The numbers in parentheses below the year indicate the amount of precipitation between cover crop seeding and harvest.

Field activities
In April 2008, an 8 ha field was seeded to dry pea (Pisum sativum L.) at a seeding rate of 141,700 viable seeds ha−1 using a John Deere 750 (Deere & Company, Moline, IL) no-till drill with a 19 cm row spacing. The dry peas were inoculated prior to seeding with Rhizobium leguminosarium. Dry pea was harvested in early August using a John Deere 4420 combine and the residue evenly spread over the soil surface. In 2009 and 2010, nearby sites (~2 km apart) with the same management history, topography and soil type were seeded to dry pea prior to the initiation of cover crop treatments.
Cover crops were seeded into the dry pea stubble in each year. Individual cover crop plots were 9.1 × 36.6 m. Planting dates for the cover crops were August 21–22 in 2008 and August 25–26 in 2009 and 2010. None of the cover crop treatments were fertilized or inoculated. Treatments consisted of seven different cover crop monocultures; each in a different functional group and a series of cover crop mixtures, which included the same seven cover crops but had selected functional groups removed from the mixture. Cover crops used in the study included (1) winter canola (WC) (Brassica napus L.); (2) vine pea (VP) (Pisum sativum L.); (3) spring triticale (ST) (Triticosecale Wittmarck); (4) sunflower (SF) (Helianthus annuus L.); (5) soybean (S) (Glycine max L); (6) purple top turnip (PTT) (Brassica rapa var rapa); and (7) proso millet (PM) (Panicum miliaceum L). Functional groups in this study included warm-season crops (SF, S, PM); cool-season crops (WC, VP, ST); grasses (ST, PM); legumes (S, VP); forbs (WC, SF) and a root crop (PTT). On certain treatments, an entire functional group was removed. For example, in the DPMST treatment, grasses were removed (Table 1). Other functional groups that were excluded include legumes (DSVP), forbs (DWCSF) and root crops (DPTT). All treatments, the acronyms and functional groups or cover crop mixture composition are listed in Table 1.
Listing of the cover crop treatments, the acronyms used and the functional group of the monoculture or the composition of species mixtures

Only the cover crops removed from the mixture are listed. All other cover crops remained in the mixture.
Besides the cover crop treatments, a non-seeded control (CON) was included in all years (2008, 2009 and 2010). In 2009 and 2010, an additional non-seeded plot was mechanically disturbed using the no-till drill (COND) (Table 1). This plot was included to isolate the impact of cover crops from any planting operation effect.
Seeding rates for the cover crops are included in the Supplementary material. Cover crops were seeded with a John Deere® 750 No-Till drill on 19 cm row spacing. Selection of the cover crop treatments and the seeding rates were determined in consultation with area farmers and SCD personnel (Liebig et al., Reference Liebig, Hendrickson, Archer, Schmer and Nichols2015). In seeding, rates were substitutive rather than additive and the seeding rate of an individual species decreased as the number of species in the mixture increased. In the case of the mixture of all the cover crops (ALL), the seeding rate was 1,124,446 viable seeds ha−1. While a different site was used for the cover crop seeding each year, the soil and initial field preparation were similar between years.
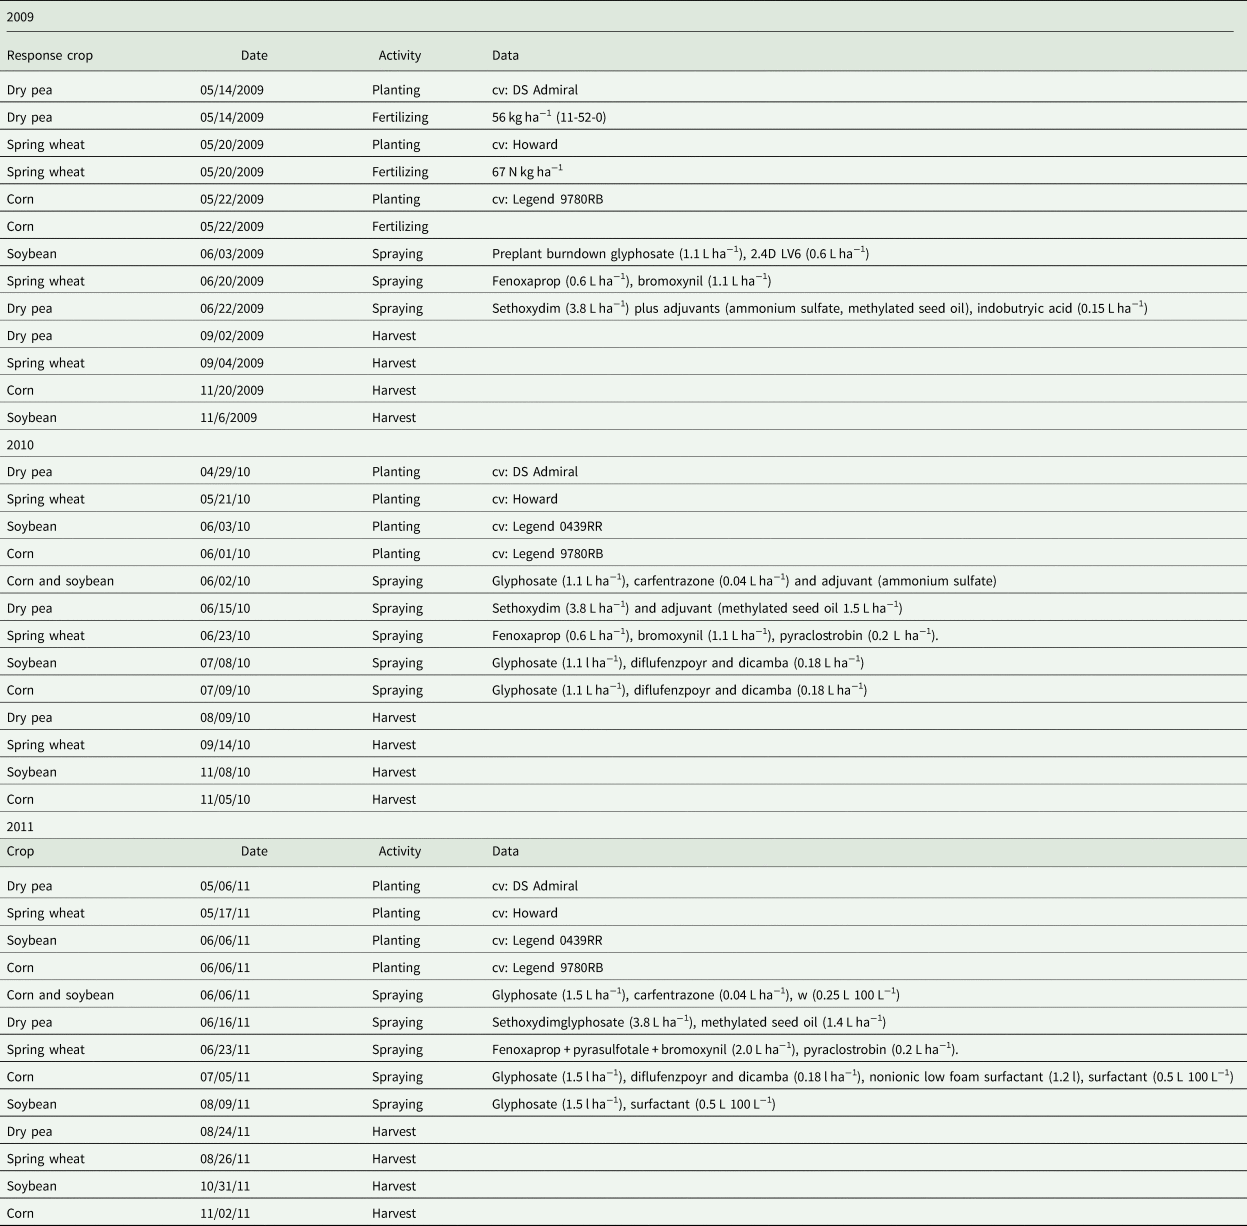
Beginning in 2009 and continuing in 2010 and 2011, four cash crops, spring wheat (Triticum aestivum L.), corn (Zea mays L.), soybean (Glycine max L.) and dry pea were seeded in strips (9.1 × 180 m) perpendicular to the cover crop treatments each year. Therefore, plot size for determining impact of a cover crop treatment on response crop yield was 9.1 × 9.1 m. Timing of field operations and the amounts of inputs for the cash crops are listed in Table 2. Yield data from the four cash crops were collected using a Hege 140 (Hege Equipment; Colwich, KS) small plot combine that harvested a 1.5 m central strip from each plot. More details on field experiments and soil properties are reported in Liebig et al. (Reference Liebig, Hendrickson, Archer, Schmer and Nichols2015).
Management practices for response crops following cover crop treatments near Mandan, ND

04/17/10 Field sprayed with glyphosate (2.3 L ha−1) + saflufenacil (0.07 L ha−1) + herbicide activators (aminated phosphoric and carboxylic acids 1 L 100 L−1) + methylated seed oil (1 L 100 L−1).
05/02/11 Field perimeter sprayed with glyphosate (2.3 L ha−1) + carfentrazone (0.04 L ha−1) + surfactant (0.5 L 100 L−1).
09/15/11 Field borders sprayed with glyphosate (1.9 L ha−1) + fluroxpyr (0.5 L ha−1) + saflufenacil (0.05 L ha−1) + surfactant (0.75 L 100 L−1).
Response crops were dry pea, spring wheat, corn and soybean.
Cover crop biomass estimations
Cover crop yield was estimated by clipping two ¼ m2 quadrats per plot in the wheat response strip (see below) following one or more killing frosts in the fall. Because some species in the cover crop mixtures continued to grow after light frosts, delaying clipping was necessary to reach maximum yield. Harvest dates were October 15, 2008; October 26, 2009 and November 2, 2010. All cover crops and any weeds and/or non-target plant species were clipped to ground level and separated by species within each quadrat. One quadrat was placed toward the outside of each plot while the other was placed near the center of the plot. Following collection, yield samples were dried for 2 days at 60°C. Yield from both quadrats was composited in the field for ½ m2 quadrats for yield estimation. Weed yield was different between years (P = 0.0063) but not treatments (P = 0.5164) so weeds were not included in the total yield estimations.
Overyielding calculations
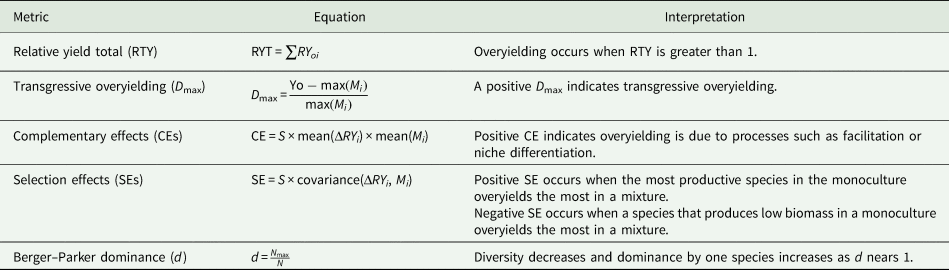
The cover crop mixtures were evaluated for overyielding using relative yield total (RYT). RYT evaluates whether the expected yield of species in a mixture is greater than the expected yield of the same species in a series of monocultures (Hector, Reference Hector2006). The formula and interpretation for RYT is given in Table 3. Transgressive overyielding which indicates whether mixtures produce more than the best-performing monocultures was measured using D max (Bonin and Tracy, Reference Bonin and Tracy2012). The formula and interpretation for D max is given in Table 3.
Metrics for determining overyielding in the cover crop mixtures with the equations and interpretations

Variables: Yo = observed total yield of a cover crop mixture; S = number of species in the mixture; Mi = average yield of species i in monoculture; max(Mi) = average monoculture yield of the best-performing species found in mixture; Oi = observed yield of species i in mixture; Ei = Mi/S = expected yield of a species i in mixture; RYoi = Oi/Mi = observed relative yield of species i in mixture; RYei = 1/S = expected relative yield of species i in mixture; ΔRYi = RYoi−RYei; N max = biomass of the most productive cover crop; N = total cover crop biomass for the plot.
Equations and variables are adapted from Bonin and Tracy (Reference Bonin and Tracy2012).
CEs indicate if overyielding is due to ecological effects such as facilitation or niche partitioning (Bonin and Tracy, Reference Bonin and Tracy2012). Measuring CE is determined by multiplying the number of species in the mixture by average deviation in relative yield (ΔRY) and by the average monoculture yield (mean M) (Loreau and Hector, Reference Loreau and Hector2001). The formula and interpretation for CE, ΔRY and mean M are given in Table 3. SE which measures if overyielding is due to the presence of a specific species in the mixture (Bonin and Tracy, Reference Bonin and Tracy2012) and is the species number multiplied by the covariance of deviation in relative yield and yield (Loreau and Hector, Reference Loreau and Hector2001). SE is positive and higher when the mixtures are dominated by the most productive monocultures. The formula for SE is in Table 3. Species dominance within a cover crop mixture was measured using the Berger–Parker dominance index (d) (Berger and Parker, Reference Berger and Parker1970). The proportion of the yield dominated by one species is determined by d. The formulas for the metrics and additional interpretation are in Table 3.
Experimental design
The experiment was set up as a randomized complete block with all treatments within each of the four blocks. Treatments were replicated four times within each year and the experiment was analyzed as a randomized complete block using PROC GLIMMIX (SAS 2012) with year and cover crop treatment as fixed effects and replicate nested within year as a random effect. Differences between treatment means were considered significant at P ≤ 0.10 unless noted otherwise.
Overyielding indices were analyzed using PROC Univariate (SAS 2012) to determine if indices were significantly different from 1, for RYT, or 0 for D max, CE and SE for each year and cover crop mixture. Since not all indices were normally distributed, normality was checked using the Anderson–Darling test (Anderson and Darling, Reference Anderson and Darling1952). If the index was normally distributed, Student's t-test was used to test for significance. The signed rank test was used for non-normally distributed indices.
Results
Cover crop yields
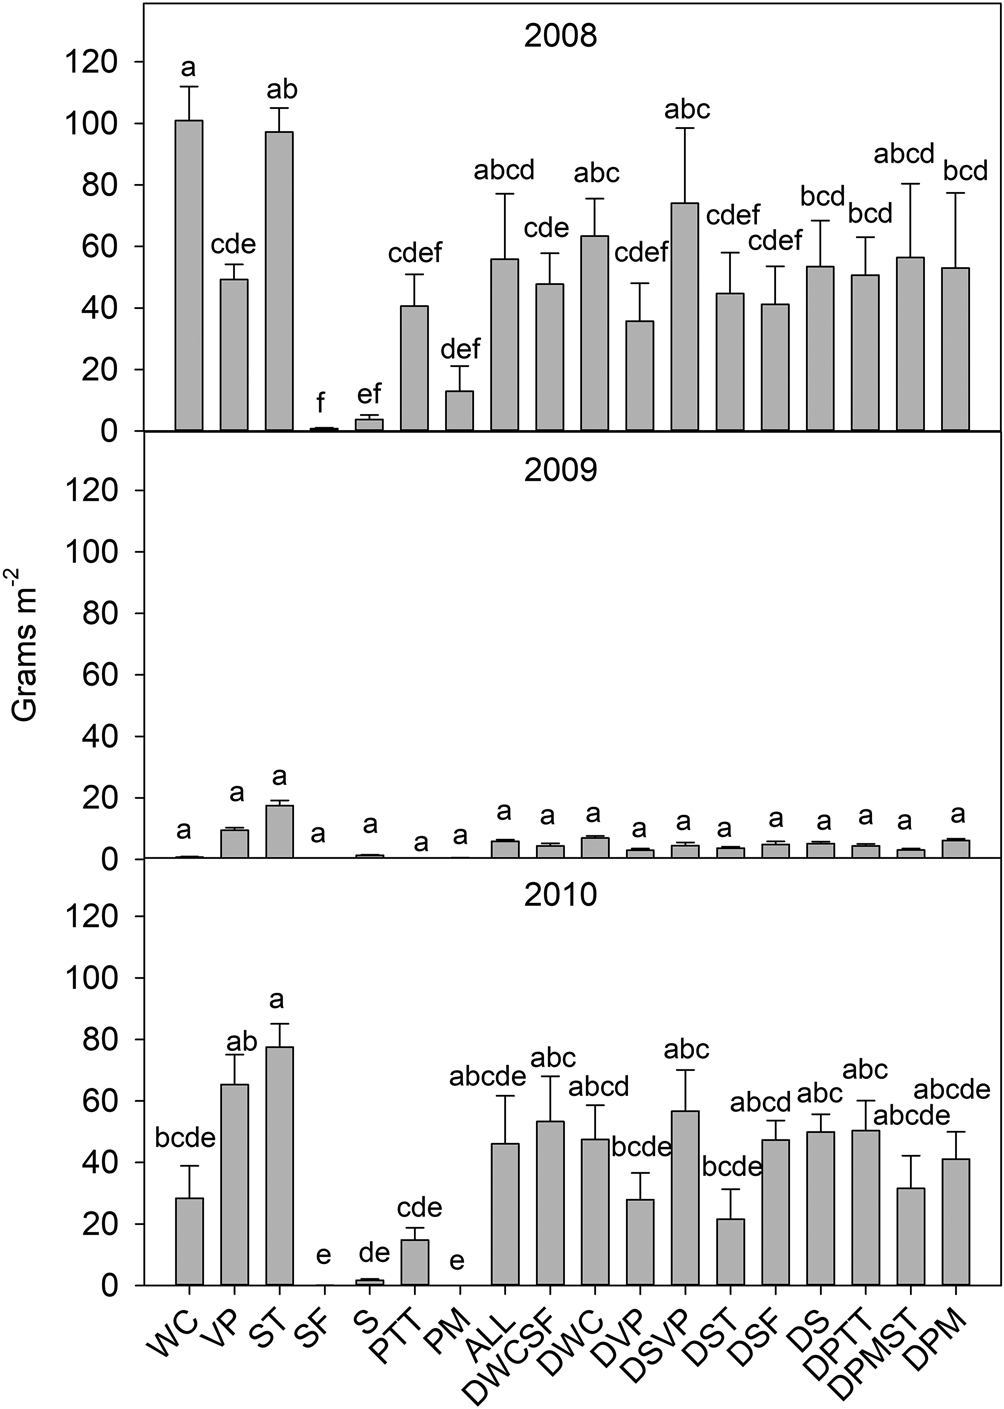
There were differences in cover crop yield between treatments and years. The maximum yield of the cover crops was only 17 g m2 in 2009 compared to 100 and 77 g m2 in 2008 and 2010, respectively. Cover crop yield was lower for all treatments in 2009 than in 2008 or 2010 (Fig. 2). Warm-season cover crops, such as SF, soybean and proso millet, did not produce large yields in any year (0.07–12.9 g m2). ST produced the greatest yield in 2009 and 2010 and the second greatest in 2008. There were no significant differences between the maximum monoculture yields and that of the high diversity mixture (ALL); the mixtures that dropped legumes (DSVP) and grasses (DPMST) or the mixture that dropped winter canola (DWC) in any year (Fig. 2). In general, yields of the cover crop mixtures were intermediate between spring triticale and the low producing warm-season cover crops.
Production for cover crop monocultures and mixtures recorded in 2008, 2009 and 2010. Treatments are (1) winter canola (WC); (2) vine peas (VP); (3) spring triticale (ST); (4) sunflowers (SF); (5) soybean (S); (6) purple top turnip (PTT); (7) all species (ALL); (8) ALL minus WC and SF(DWCSF); (9) ALL minus WC (DWC); (10) ALL minus VP (DVP); (11) ALL minus S and VP (DSVP); (12) ALL minus ST (DST); (13) ALL minus SF (DSF); (14) All minus S (DS); (15) ALL minus PTT (DPTT); (16) ALL minus PM and ST (DPMST); and (17) ALL minus PM (DPM).

Response crop yields
Year rather than cover crop treatment made the most impact on spring wheat, corn, soybean and dry pea grain yield. There were no differences in yields between any of the cover crop treatments for any of the cash crops within year (data not shown). However, there were differences in grain yields between years for all cash crops (Table 4).
Yields of four response crops in each year following late-seeded cover crops at research site near Mandan, ND

1 Yields with different lower-case letter signify differences between years within response crop. Number in parenthesis indicates standard error of the yield.
Overyielding effects
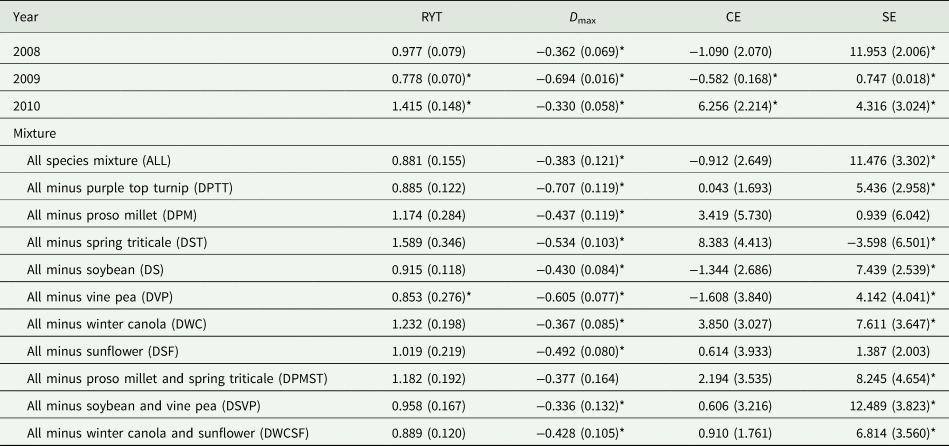
Four different metrics were used to evaluate overyielding and its components (Table 3). Overyielding as measured by RYT was greater than 1 in 2010 and less than 1 in 2009 (Table 5). Of the 11 different cover crop mixtures DVP was less than 1 but all other mixtures were not different from 1. Overyielding as measured by D max was significantly negative (<0) for all years and cover crop mixtures except for DPMST (Table 5). The CE was negative in 2009 and positive in 2010 but did not differ from 0 for any of the cover crop mixtures (Table 5). The SE was positive for all three years and also for 9 of the 11 mixtures. The DSF did not differ from 0 while DST was negative (SE < 0) (Table 5).
Measurements of overyielding in the cover crop mixtures

Overyielding measurements are relative yield total (RYT), transgressive overyielding (D max), complementary effects (CEs) and selection effects (SEs). Values in parenthesis indicate standard error of the mean for each value. An * following the number indicates the value is significantly different from 1 for RYT and 0 for D max, CE and SE.
Dominance measures
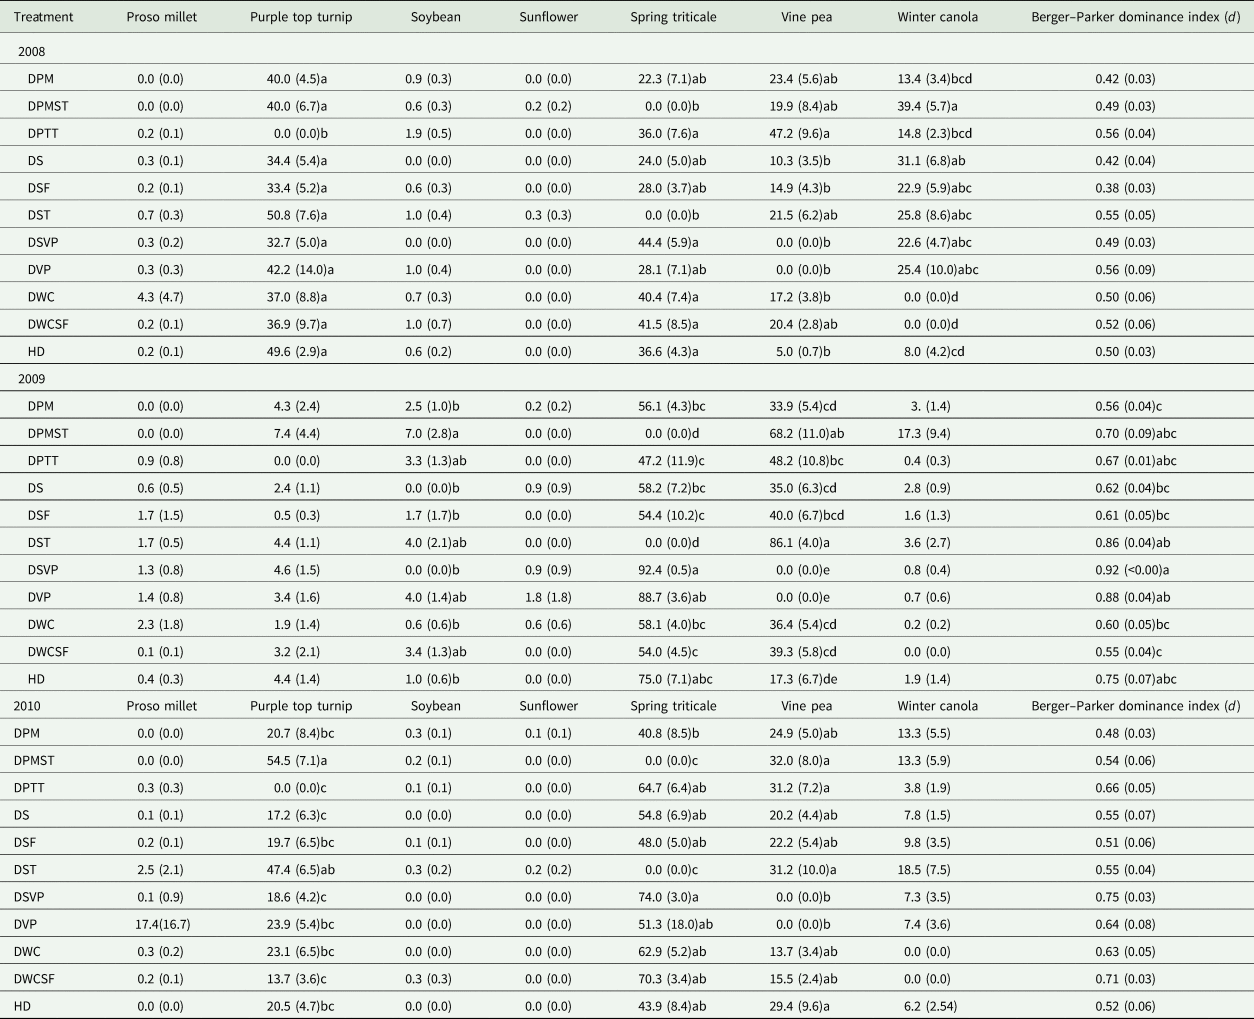
The Berger–Parker dominance index (d) had a year by treatment interaction. The d index had significant differences in 2009 but not in 2008 or 2010 (Table 6). In 2009, d was greater for the DSVP than for DSF, DS, DWC, DPM or DWCSF. The d value was also greater for DVP than for DWCSF or DPM (Table 6).
Percent of each cover crop species in the species mixtures and the Berger–Parker dominance index (d)

The numbers below each treatment are the average percent each cover crop species contributed to overall biomass. The numbers in parenthesis are standard errors. The mixture treatments are (1) all species (ALL); (2) ALL minus proso millet (DPM); (3) ALL minus proso millet and spring triticale (DPMST; (4) ALL minus purple top turnip (DPTT); (5) ALL minus soybean (DS); (6) ALL minus sunflower (DSF); (7) ALL minus spring triticale (DST); (8) ALL minus soybean and vine pea (DSVP); (9) ALL minus vine pea (DVP); (10) ALL minus winter canola (DWC); (11) ALL minus winter canola and sunflower (DWCSF). Cover crop percent with different lower case letters signify differences between years within cover crops.
There were year by treatment interactions for the proportion of PTT, S, ST, VP and WC in the mixtures. The proportion of PTT differed in 2008 and 2010. In 2008, there were no differences between treatments in the proportion of PTT in any treatment except for the DPTT in which PTT was not seeded. In 2010, the proportion of PTT was greater in the DPMST than in any other mixture except for DST. The DST mixture also had a greater proportion of PTT than did DWCSF, DS or DPTT (Table 6). In 2009, the proportion of S in the DPMST mixture was greater than in the DPM, DS, DSF, DSVP, DWC and ALL mixtures (Table 6).
The proportion of ST in mixtures was different in every year. The proportion of ST was greater in the DPTT, DSVP, DWC, DWCSF and ALL than in the DST or DPMST mixtures in 2008. In 2009, the proportion of ST was greater in the DSVP mixture than in any other mixture except for DVP. The DVP mixture had a greater amount of ST than did DWCSF, DSF, DPTT, DPMST or DST mixtures. ST was greater in the DWC, DS and DPM mixtures than in the DPMST or DST mixtures. In 2010, the proportion of ST in the DSVP mixture was greater than in the DST or DPMST mixtures (Table 6).
There were differences in VP between mixtures in every year, also. In 2008, VP was greater in the DPTT mixture than in the DS, DSF, DSVP, DVP or ALL mixtures. In 2009, VP made up a greater proportion of the DST mixture than any other mixture except for DPMST. The VP was also greater in the DPMST than in the DPM, DS, DSVP, DVP, DWCSF, DWC and ALL mixtures. The DPM, DWC, DSF and DWCSF treatments had a greater proportion VP than did DVP or DSVP. In 2010, VP made up less of the DVP and DSVP mixtures than the DPMST, DPTT, DST and ALL mixtures (Table 6).
The proportion of WC was different between mixtures in 2008 but not 2009 or 2010. In 2008, the proportion of WC was greater in DPMST than in DPM, DWC, DWCSF or ALL mixtures. The proportion of WC was also greater in the DS, DSF DST, DSVP and DVP than in the DWC or DWCSF mixtures (Table 6).
Discussion
Our research study evaluated the potential to seed late-season cover crops following dry peas in a northern, semi-arid climate. We hypothesized that (1) adding late-season cover crops would enhance subsequent cash crop yield and (2) cover crop mixtures would be more productive and provide greater subsequent crop yield benefits than would cover crop monocultures. Our findings did not support either hypothesis. Year, rather than cover crops, was the main driver of subsequent crop yield, and cover crop mixtures were not any more productive than monocultures and neither benefited subsequent yield. However, inclusion of late-season cover crops did not subtract from subsequent crop yield and, depending on environmental conditions, may be a useful inclusion into crop rotations.
Surveys have suggested more producers would use cover crops if they improved crop yields (SARE and CTIC, 2015). However, the reported impact of cover crops on subsequent crop yields has been mixed with reports of cover crops either increasing, decreasing or not affecting subsequent crop yields (Blanco-Canqui et al., Reference Blanco-Canqui, Shaver, Lindquist, Shapiro, Elmore, Francis and Hergert2015). In our study, year, rather than cover crops, drove crop yield response (Table 4). Cover crops can be problematic, in semi-arid systems, since they potentially limit soil water for the next crop (Unger and Vigil, Reference Unger and Vigil1998). We did not see a decrease in subsequent crop yield even though we seeded both dry pea and a cover crop in the same cropping season. Liebig et al. (Reference Liebig, Hendrickson, Archer, Schmer and Nichols2015) reported no differences in soil water content after cover crop seeding or before planting the cash crops. The cover crops were harvested in the fall and the cash crops were planted the following spring which may have allowed sufficient time for soil water recharge (Lyon et al., Reference Lyon, Nielsen, Felter and Burgener2007).
The experiment was designed to evaluate the impacts of different cover crop functional groups. Understanding the impacts of different functional groups is important since functional diversity can predict multifunctionality (Blesh, Reference Blesh2018). Some functional groups, such as legumes can benefit subsequent crops through providing N (Sainju and Singh, Reference Sainju and Singh1997), although the same functional group (legumes) has been reported to reduce subsequent wheat yield when used as cover crop in place of fallow in a winter wheat–fallow system (Nielsen and Vigil, Reference Nielsen and Vigil2005). The impact of winter cover crops on subsequent corn yields depended on functional group and region (Miguez and Bollero, Reference Miguez and Bollero2005). They found that legume cover crops had a positive impact, while grasses had a neutral and bicultures had a mixed effect on subsequent corn yields. There have also been reports that the cover crop mixture's carbon:nitrogen ratio can impact subsequent crop yields (Hunter et al., Reference Hunter, Schipanski, Burgess, LaChance, Bradley, Barbercheck, Kaye and Mortensen2019). However, despite having multiple functional groups, both present and absent in different treatments, we did not see any impact on crop yield response. The impact of year indicates that environmental factors, rather than presence or absence of cover crops or cover crop functional groups, was the major driver of response crop yield.
Bi-cultures have shown increased productivity compared to monocultures (Sainju et al., Reference Sainju, Whitehead and Singh2005) at least in some years (Teasdale and Abdul-Baki, Reference Teasdale and Abdul-Baki1998), while, in Nebraska, cover crop yield tended to increase with cover crop diversity (Wortman et al., Reference Wortman, Francis, Bernards, Drijber and Lindquist2012a). However, in our study, at least one of the cover crop monocultures yielded more than the mixtures every year. Florence et al. (Reference Florence, Higley, Drijber, Francis and Lindquist2019) suggested that mixtures did better than monocultures mainly because monoculture productivity was depressed by poorly performing species. However, predicting which monoculture would produce the most yield from year to year was challenging. For example, WC went from the highest yielding cool-season monoculture in 2008 to the lowest in 2010 (Fig. 2). Total WC production declined from 101 g m−2 in 2008 to 28 g m−2 in 2010. However, even relatively low cover crop productivity can provide valuable forage in forage limited situations (Franzluebbers and Stuedemann, Reference Franzluebbers and Stuedemann2015). As a group, the warm-season species were particularly unproductive as late-season cover crops because of the late-seeding and slow GDD accumulation (Fig. 2). Integrating a purely cool-season cover crop mixture may increase productivity and yield stability but that combination was not included in this study.
Although cover crop mixtures were not more productive than monocultures, it is useful to get information about how individual species performed within a mixture (Creamer et al., Reference Creamer, Bennett and Stinner1997). We utilized overyielding as a method to biological benefits to diversity. Overyielding basically measures whether individual species do better in a mixture than would be predicted by their performance in monocultures (Bonin and Tracy, Reference Bonin and Tracy2012) and can occur in cover crop mixtures (Wortman et al., Reference Wortman, Francis and Lindquist2012b). We measured overyielding through RYT (Table 3) which is a sum of the individual relative yields of different species in a mixture (Hector, Reference Hector2006). Year rather than mixture impacted overyielding as measured by RYT suggesting that environmental factors contributed more to overyielding than did species diversity. The strongest evidence of overyielding for all mixtures occurred in 2010 when RYT was significantly greater than 1. RYT was less than 1 in 2009, which was also the year with the least cover crop yield. Transgressive overyielding, which is measured by D max, and indicates if mixtures yield more than the most productive monocultures (Hooper and Dukes, Reference Hooper and Dukes2004), did not occur in our study. Overyielding in perennial species mixtures increases with time (Frankow-Lindberg et al., Reference Frankow-Lindberg, Brophy, Collins and Connolly2009; Bonin and Tracy, Reference Bonin and Tracy2012) and this includes transgressive overyielding (Bonin and Tracy, Reference Bonin and Tracy2012). The short-term nature of the annual cover crops in our study may have limited the ability of species mixtures to exhibit transgressive overyielding.
While measuring overyielding helps to compare productivity of mixtures and monocultures, it does not provide insights into mechanisms that may explain differences in productivity. The use of additional portioning equations can help to evaluate some of these differences. CEs measure ecological effects such as facilitation, complementation, niche portioning and suppression while SEs measure the impact of an individual high performing species (Bonin and Tracy, Reference Bonin and Tracy2012). While CE and SE can be interrelated (Hooper and Dukes, Reference Hooper and Dukes2004), the dominance of positive SE does suggest that dominant species had greater impacts on yield than did ecological effects. The SE was significantly greater than 0 in all 3 yr and 9 of the 11 mixtures compared to only 1 yr (2010) and none of the 11 mixtures for CE. This suggests that (1) as noted with cover crop yield, mixtures did not provide a productivity advantage over monocultures and (2) if mixtures are used, species selection is a critical component driving yield.
The CE was greatest in 2010, the wettest year of the study, while SE was greatest in 2008, the year with the greatest monoculture and mixture productivity (Fig. 2). A higher CE in wetter conditions has been reported for grasslands (Hooper and Dukes, Reference Hooper and Dukes2004) and this study suggests that annual cover crop mixtures may follow this trend. Each year of our study was unique from a precipitation and heat accumulation perspective and our data supports Hooper and Dukes (Reference Hooper and Dukes2004) suggestion that biotic and abiotic environment, such as water availability, can impact overyielding.
Because most mixtures had a positive SE, the dominance of individual species within each mixture was assessed. Treatment differences in the Berger–Parker dominance index were only evident in 2009, which was also the year with the lowest overall productivity. This indicates greater dominance by a single species in years with low resource availability. Overall, the cool-season cover crops, regardless of functional group, made up a majority of the mixtures (Table 6).
We included warm-season cover crops as an important functional group but they did not perform well in this late-seeded study. Warm-season cover crops did not produce significant aboveground yield (Fig. 2) and with one exception made up <5% of the species composition of the mixtures (Table 6). Warm-season cover crops received ~330 GDD in this study. More than 330 GDD were needed to either produce more than 10% of the total yield for proso millet (Maman et al., Reference Maman, Mason, Galusha and Clegg1999) or to develop past the vegetative stage for soybean (Kandel and Akyuz, Reference Kandel and Akyuz2012) and sunflower (Sheoran et al., Reference Sheoran, Yadava, Niwas, Chandra and Kumar1999). In contrast, cool-season GDD averaged 543 GDD, which was 65% more than the warm-season GDD. Cool-season grasses such as wheat (Triticum aestivum L.) or barley (Hordeum vulgare L.) are tillering or entering stem elongation at 540 GDD while canola and vine pea are in the late vegetative stages (Miller et al., Reference Miller, Lanier and Brandt2018).
Late-season cover crops also need timely precipitation for establishment. The importance of timely precipitation for cover crop establishment can be seen by comparing 2008 and 2009. Precipitation during the cover crop growing season was lowest in 2008 but cover crop production was lowest in 2009 (Fig. 2). In 2009, the first late-season precipitation event >1 mm did not occur until 17 days after seeding compared to 11 and 5 days for 2008 and 2010, respectively (Fig. 1). A lack of early precipitation in 2009 delayed emergence thereby reducing the capacity to utilize increasingly scarce GDD.
Conclusions
The use of cover crops has been increasing in dryland cropping systems. We evaluated the ability of cover crops to enhance subsequent crop yields and to evaluate the contributions of cover crop mixtures vs monocultures in a semi-arid environment in the northern Great Plains. Our data did not provide evidence of cover crops enhancing subsequent crop yield or evidence that cover crop mixtures were more productive than cover crop monocultures. We did find that late-season cover crops could be produced in a semi-arid region in the northern Great Plains provided cool-season species are used and timely precipitation is received. However, yield production was generally low and erratic and costs of establishing cover crops may be high, depending on species and mixtures used.
It is important to realize that cover crops can provide benefits not directly related to yield. A previous report on the same study (Liebig et al., Reference Liebig, Hendrickson, Archer, Schmer and Nichols2015) indicated these cover crops could help in N conservation. Because late-seeded cover crops have demonstrated potential for N conservation and limited forage production (Franzluebbers and Stuedemann, Reference Franzluebbers and Stuedemann2015), more research is needed into making them an acceptable tool for producers. Year had the greatest impact on cover crop yield in our study primarily because of the importance of timely prescription for establishment. Further research into planting times and soil moisture conditions would be valuable to producers to determine the potential for cover crop yield. Also, since cover crop benefits may accrue over years, evaluating the impact of late-seeded cover crops in a single location for multiple years may provide more insight into their potential effectiveness.
Supplementary material
The supplementary material for this article can be found at https://doi.org/10.1017/S174217052100020X.
Acknowledgements
We acknowledge the contribution of the Area IV SCDs in North Dakota for providing land to conduct research reported in this manuscript. Robert Kolberg, Delmer Schlenker, Marvin Hatzenbuhler, Nicanor Saliendra, Mary Kay Tokach, Jason Gross, Holly Johnson, Heather Matthees, Dawn Wetch, Becky Wald, Gary Brucker and numerous student biological technicians provided excellent technical support during plot establishment and maintenance, sample collection, sample processing and analyses and data summarization. The U.S. Department of Agriculture (USDA) prohibits discrimination in all its programs and activities on the basis of race, color, national origin, age, disability, and where applicable, sex, marital status, family status, parental status, religion, sexual orientation, genetic information, political beliefs, reprisal, or because all or part of an individual's income is derived from any public assistance program (Not all prohibited bases apply to all programs.). USDA is an equal opportunity provider and employer. Mention of commercial products and organizations in this manuscript is solely to provide specific information. It does not constitute endorsement by USDA-ARS over other products and organizations not mentioned. This research was a contribution from the Long-Term Agroecosystem Research (LTAR) network. LTAR is supported by the United States Department of Agriculture. No external funding was used in this study.