I. INTRODUCTION
In recent years, there has been a shift of focus toward utilizing renewable sources of energy. Rising energy costs and increasing environmental concerns associated with fossil fuels are the major contributing factors. Photovoltaics have emerged as a major renewable energy source with Si, GaAs, CdTe, and Cu(In1−x Ga x )Se2 as the major competing technologies. Recently, CdTe-based solar cells have demonstrated a record efficiency of 21.5%, 1 making this technology a very promising candidate in photovoltaics. The performances of CdS/CdTe heterojunction devices are primarily governed by various defect-mediated recombinations that are responsible for reducing the effective charge separation. These defect states have been attributed to Cd vacancies (VCd), Reference Okamoto, Yamada and Konagai2 complexes consisting of VCd and donor impurities such as Cl (VCd–ClTe), Reference Halliday, Eggleston and Durose3 Cu on Cd sites (CuCd) Reference Vatavu, Zhao, Caraman, Gaşin and Ferekides4 and donor–acceptor (DA) complexes. Reference Taguchi, Shirafuji and Inuishi5 Cl is incorporated in the CdTe layer post deposition, presumably in the form of chlorine on tellurium sites (ClTe), during annealing with CdCl2 vapor. Reference Li, Wu, Poplawsky, Pennycook, Paudel, Yin, Haigh, Oxley, Lupini, Al-Jassim, Pennycook and Yan6 This annealing is found to increase CdTe grain size. Reference Moutinho, Al-Jassim, Levi, Dippo and Kazmerski7 Cu is introduced, usually as a component of the back contact, and acts to enhance p-type doping of the CdTe and improve the ohmic behavior of back contacts. Reference Chou, Rohatgi, Thomas, Kamra and Bhat8
Photoluminescence (PL) is an important technique to probe states in the energy gap of semiconductors and hence to study the possible carrier trapping and recombination routes. By analysis of the dependence of the samples' luminescence intensity and spectral position on the incident laser intensity, wavelength, and sample temperature, we can determine the origins of emission lines from the material. Reference Giles-Taylor, Bicknell, Blanks, Myers and Schetzina9 Some PL-based investigations have been performed on CdTe films and CdS/CdTe based devices. Reference Halliday, Eggleston and Durose3,Reference Aguilar-Hernández, Contreras-Puente, Figueroa-Estrada and Zelaya-Angel10–Reference Grecu and Compaan12 Still, unambiguous assignment of various peaks observed in the PL spectra of these films and devices remains challenging. This is partly due to the fact that the most efficient solar cells have relatively complex polycrystalline CdTe as their absorber layer. It has been noted that the polycrystalline CdTe yields higher efficiency solar cells than its single crystal counterpart, Reference Visoly-Fisher, Cohen, Ruzin and Cahen13,Reference Tuteja, Koirala, MacLaren, Collins and Rockett14 likely due to the carrier depletion caused due to accumulation of Cl along the grain boundaries. Due to the presence of various recombination centers in the polycrystalline material, the emission lines are broadened and coalesced, which makes their accurate identification difficult. The PL spectrum of a semiconductor depends both on the sample temperature and on the excitation power of the laser as the band edge and sub-band gap states have a finite capture cross-section, which changes with both of these quantities. To understand the various recombination processes occurring in CdTe and at the CdS/CdTe interface is important because it directly influences charge separation and hence open circuit voltage (V OC) of the solar cell.
Sputter deposition of these devices has advantages compared to deposition techniques based on thermal evaporation. First, sputtering is generally performed at lower substrate temperatures (∼250 °C) than, for instance, close-spaced sublimation (CSS), which requires a temperature of ∼600 °C for CdTe growth. Second, sputter deposition yields compact, uniform films even in very thin layers, and as a result can be used for the fabrication of high performance semi-transparent solar cells with thin absorber layers. Reference Plotnikov, Vasko, Compaan, Liu, Wieland, Zeller, Li and Collins15 Third, sputtering technology is easily scalable to coat large areas of glass homogenously. However, CSS-deposited CdTe solar cells often have higher efficiencies as compared to sputtered devices. Thus, it is important that efficiency-limiting defects in all-sputtered CdTe solar cells are investigated. Alleviating these recombination pathways will enable the fabrication of even higher efficiency PV devices via sputtering. This will enable us to avoid high temperature CSS growth of CdTe, which is undesirable for the substrates used in flexible solar modules. In the present study, low temperature PL has been used to study the electronic energy levels of the defect states and their corresponding luminescence emissions for sputter deposited CdTe solar cells and junctions.
The current study extends the previous works Reference Halliday, Eggleston and Durose3,Reference Vatavu, Zhao, Caraman, Gaşin and Ferekides4,Reference Grecu and Compaan12,Reference Vatavu, Zhao, Padma, Rudaraju, Morel, Gaşin, Caraman and Ferekides16 with a more detailed characterization of the temperature and power dependence of luminescence peaks. Overall the PL spectra obtained here agree with the reported spectra obtained from devices fabricated using thermal evaporation-based techniques, Reference Okamoto, Yamada and Konagai2,Reference Vatavu, Zhao, Caraman, Gaşin and Ferekides4,Reference Vatavu, Zhao, Padma, Rudaraju, Morel, Gaşin, Caraman and Ferekides16,Reference Okamoto, Matsuzaki, Amin, Yamada and Konagai17 an observation which enables the extension of ideas developed in this study to all CdTe devices. A shift was observed in the PL emission from being dominated by sub-band gap defect-mediated emission at lower excitation powers to near band edge emission at higher excitation powers. As seen from the PL spectra, the presence of Cu as a dopant was found to suppress the sub-gap luminescence and may actually promote band-to-band recombination. This provides insight into the effect of Cu diffusion on the carrier recombination, considering that such diffusion occurs from the CdTe surface to the CdS/CdTe junction.
II. EXPERIMENT
The samples studied here were grown at the University of Toledo on NSG-Pilkington TEC-15 glass substrates (Tokyo, Japan), which are soda lime glass coated with a tri-layer of SnO2/SiO2/SnO2:F. The CdS and CdTe were sequentially deposited on these substrates by magnetron sputtering at a substrate temperature of 250 °C, a radio frequency (rf) power of 200 W, and an Ar pressure of 15/10 mTorr for CdS/CdTe depositions. The CdS and CdTe thicknesses are 120 and 2200 nm, respectively, as monitored in situ using real time spectroscopic ellipsometry. Following this deposition the samples were CdCl2 heat treated by applying a saturated aqueous solution to the CdTe film surface and annealing in dry air for 30 min at 387 °C. One sample (sample A) was removed from the process at this stage and the other sample (sample B) was further over-deposited by Cu/Au bilayer contacts of 3/30 nm thicknesses. Sample B was subsequently annealed at 150 °C in air for 45 min. Additional details of the deposition process may be found in Refs. Reference Shao, Fischer, Grecu, Jayamaha, Bykov, Contreras-Puente, Bohn and Compaan18 and Reference Koirala, Tan, Li, Podraza, Marsillac, Rockett and Collins19; however, some growth and device processing parameters have been adjusted as described here. Both samples (A and B) have an area of 1 cm × 1 cm. The completed device (sample B) used for this study has an open circuit voltage (V OC) of ∼0.8 V, a short circuit current (J SC) of ∼22 mA/cm2, and an efficiency of ∼12%.
The PL studies were carried out at the University of Illinois. The samples were mounted on a temperature-controlled vacuum cryostage and illuminated using a 532 nm Nd:YAG laser with a peak power of less than 50 mW. The maximum average power delivered to the sample was ∼11 mW. The laser spot size was 0.2 mm2 in area, corresponding to a power density of 5.5 W/cm2. For this wave length we estimate that ∼6% of the intensity was absorbed in the CdS for measurements through the glass side of the sample and 50% of the intensity was absorbed in the CdTe in the first 100 nm of the material based on absorption coefficients published in Ref. Reference Green, Ho-Baillie and Snaith20, ignoring the grading of the heterojunction. The excitation power was varied using an adjustable neutral density filter. A Princeton Instruments (Trenton, New Jersey) grating-based monochromator (Spectra-Pro 300i) coupled with a Si CCD detector (PIXIS 100) was used for signal detection. The luminescence spectra were corrected to account for any spectral dependence of the collection setup in the range of the measurement wavelengths. The instrumental response curve used for this correction was determined using a calibrated light source from Labsphere, Inc. (North Sutton, New Hampshire). The sample was cooled to 82 K in a Kadel Engineering Corp. dewar (Danville, Indiana) and reheated using a resistive heater. The typical range of measurement temperatures was 82–295 K, regulated using a LakeShore cryotronics 330 autotune temperature controller (Westerville, Ohio). PL spectra were obtained by exciting the sample from the glass side to probe the CdS/CdTe junction for both samples and from the CdTe surface side to probe the CdTe bulk characteristics for sample A.
III. RESULTS
A. Excitation from the CdTe surface (sample A)
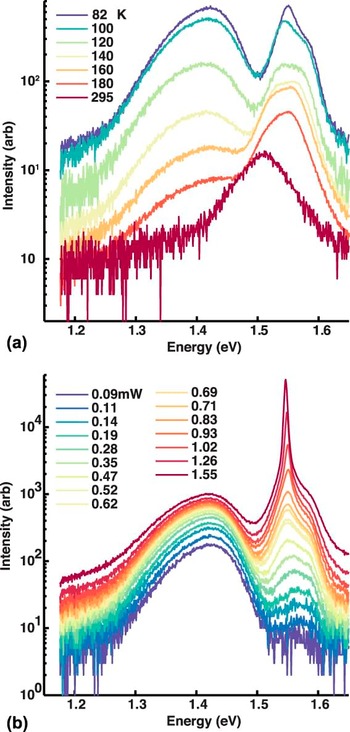
The PL spectra obtained at various temperatures by exciting the CdTe side of the CdCl2-treated, uncontacted CdS/CdTe junction sample are shown in Fig. 1(a). These data represent the back ∼100 nm of the CdTe which is easily within a minority carrier diffusion length of the back surface. The excitation power used was ∼0.7 mW. Figure 1(b) shows the PL spectra obtained at 82 K at excitation powers from 0.02 to 1.55 mW. Taken together, the data in Fig. 1 show that sample A PL spectrum consists of two prominent bands centered at ∼1.42 and ∼1.55 eV for temperatures up to 120 K. The 1.42 eV sub-bandgap transition is dominant at low excitation powers up to ∼0.7 mW [as seen from Fig. 1(b)] and the near band gap 1.55 eV transition band becomes dominant at higher excitation powers and higher temperatures. The 1.55 eV band has a distinct shoulder near 1.58 eV in 82 K spectrum, which dominates the PL spectra for temperatures greater than 160 K and less than some temperature between 180 and 295 K.
PL spectra obtained by exciting CdTe surface (sample A) at (a) ∼0.7 mW laser excitation power as a function of measurement temperature and (b) 82 K as a function of laser excitation power.

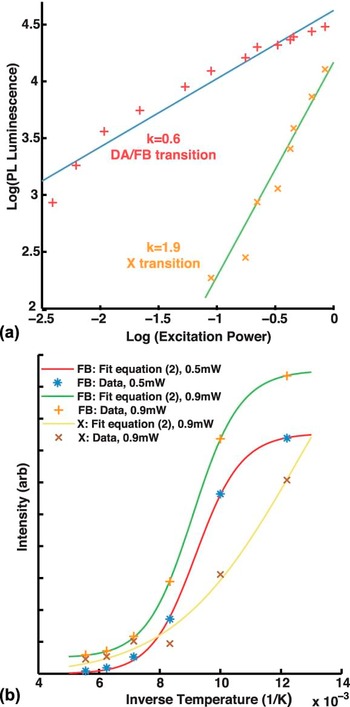
To calculate the relative intensities of various emission processes to identify their origins, the spectra were peak fit as follows. The 1.42 eV transition in 82 K spectra, as shown in Fig. 1(a), was fit with an exponentially modified Gaussian function Reference Pauls and Rogers21,Reference Yau22 to accommodate the asymmetric peak shape; the peak at 1.55 eV was fit with a Lorentzian function; and the shoulder at 1.58 eV was fit with a Gaussian function. Figure 2(a) shows the variations of the 1.42 and 1.55 eV band integrated luminescence as a function of excitation power at 82 K. The intensity data for both are well described by
 $${I_{{\rm{PL}}}} = C\mathop {{I_{\rm{L}}}}\nolimits^k \quad ,$$
where I PL is the measured luminescence, I L is the incident laser power and C is a constant. For the 82 K spectra, the values of k obtained from the curve fit are 0.6 ± 0.1 and 1.9 ± 0.3 for the 1.42 and 1.55 eV transitions, respectively. The errors in k values are determined per a 95% confidence interval. According to Schmidt et al., Reference Schmidt, Lischka and Zulehner23 DA and free-to-bound (FB) transitions have k < 1 and excitonic (X) transitions have 1 < k < 2. This suggests the 1.42 and 1.55 eV emissions are DA/FB and X transitions, respectively. Similar k values were obtained upon analysis of the luminescence at other temperatures in the range of 82–140 K.
Plot of (a) DA/FB and X emission luminescence versus excitation power and (b) FB and X luminescence versus inverse temperature from the CdTe PL spectra (sample A). The excitation power levels are as indicated. Solid lines represent least squares fit to data as per Eqs. (1) and (2) in (a) and (b), respectively. Data points are experimentally observed.

It can be observed from Fig. 1(a) that the 1.42 eV transition luminescence is quenched as the measurement temperature is increased from 82 to 295 K. The thermal quenching of this luminescence [shown in Fig. 2(b)] was used to calculate the activation energy for this process. The functional relationship between the integrated luminescence, I(T), and temperature (T) for the FB transition was modeled by:
 $$I\left( T \right) = {A \over {1 + B{T^{{3 \mathord{\left/ {\vphantom {3 2}} \right. \kern-\nulldelimiterspace} 2}}}{{\rm{e}}^{{{\Delta E} \mathord{\left/ {\vphantom {{\Delta E} {{k_B}T}}} \right. \kern-\nulldelimiterspace} {{k_B}T}}}}}}\quad ,$$
where ΔE represents the ionization energy of the bound state to the valence/conduction band contributing to the FB transitions. Similarly, temperature dependence of DA transition was modeled by:
 $$I\left( T \right) = {A \over {1 + B{T^{{3 \mathord{\left/ {\vphantom {3 2}} \right. \kern-\nulldelimiterspace} 2}}}{{\rm{e}}^{{{\Delta {E_1}} \mathord{\left/ {\vphantom {{\Delta {E_1}} {{k_{\rm{B}}}T}}} \right. \kern-\nulldelimiterspace} {{k_{\rm{B}}}T}}}} + C{T^{{3 \mathord{\left/ {\vphantom {3 2}} \right. \kern-\nulldelimiterspace} 2}}}{{\rm{e}}^{{{\Delta {E_2}} \mathord{\left/ {\vphantom {{\Delta {E_2}} {{k_{\rm{B}}}T}}} \right. \kern-\nulldelimiterspace} {{k_{\rm{B}}}T}}}}}}\quad ,$$
where ΔE 1 and ΔE 2 represent the ionization energies of the donor and acceptor states respectively. It is worth noting that a multiplication prefactor of T 3/2 is used before the exponential terms in Eqs. (2) and (3), to indicate thermal depopulation of the bound states into the conduction/valence band edges. Reference Krustok, Collan and Hjelt24 The T 3/2 prefactor denotes the temperature dependence of effective density of states at the band edges and is absent in case of depopulation into another defect level. A suitable temperature fit for the 1.42 eV peak luminescence obtained by using Eq. (2), as shown in Fig. 2(b) gives ΔE = 100 ± 14 and 97 ± 4 meV at excitation powers of ∼0.5 and ∼0.9 mW, respectively. These data when fit with Eq. (3) yield an error scale of over 100 meV. Thus, it is likely that the sub-gap peak observed is a FB transition involving a bound state with ionization energy of ∼100 meV.
The sharp peak at 1.55 meV is likely an X transition based on the arguments per Eq. (1), presented above. The fact that the peak position for this transition remains nearly fixed at 1.55 eV (at 82 K) as the excitation power is increased, as shown in Fig. 1(b), confirms the assignment to an excitonic transition. The slight red shift observed for this peak with higher excitation powers is likely due to local sample heating by the laser beam. A temperature dependent quenching behavior for the X transition was observed and was modeled using Eq. (2). In this case, ΔE corresponds to the exciton binding energy. This fit, as shown in Fig. 2(b) at ∼0.9 mW yields an exciton binding energy of 25 ± 8 meV, which is similar to thermal energy of ∼26 meV at 295 K. This supports our observation of the excitonic peaks in 295 K spectra obtained using higher excitation powers (>1.5 mW at 295 K). A very simple calculation of free exciton binding energy (E x) using hydrogenic model for Coulomb attraction between electron and holes gives:
 $${E_{\rm{x}}} = {{{m_{\rm{r}}}{{\rm{e}}^4}} \mathord{\left/ {\vphantom {{{m_{\rm{r}}}{{\rm{e}}^4}} {2{{\left( {4\pi {\varepsilon _{\rm{r}}}{\varepsilon _{\rm{o}}}\hbar } \right)}^2}}}} \right. \kern-\nulldelimiterspace} {2{{\left( {4\pi {\varepsilon _{\rm{r}}}{\varepsilon _{\rm{o}}}\hbar } \right)}^2}}}\quad ,$$
where m r −1 = m e −1 + m h −1, m e/h is the electron/hole effective mass, εrεo is the product of the dielectric constant of CdTe and the vacuum permittivity. Plugging m e = 0.11, Reference Marple25 m h = 0.8, Reference Berding26 and εr = 10.31, Reference Strzalkowski, Joshi and Crowell27 we get E x = 12.3 meV for CdTe. We see that this value of E x differs by more than a factor of two from the experimentally obtained exciton binding energy of 25 ± 8 meV. This is a strong indication that the exciton is bound to an impurity and thus its binding energy increases due to the contribution from the impurity state.
Upon analyzing the variation of the peak position of the 1.58 eV transition, seen in Fig. 1(a), as a function of temperature at ∼0.7 mW excitation power, we obtain a temperature coefficient of −(3.5 ± 0.5) × 10−4 eV/K. This value is close to the value of −3.0 × 10⁻⁴ eV/K, as found by Camassel et al., Reference Camassel, Auvergne, Mathieu, Triboulet and Marfaing28 for the temperature coefficient describing the band gap variation in CdTe. Thus, the change in position of the 1.58 eV transition corresponds well with the expected band edge variation with temperature. Also, the energy difference between the X emission and the band edge peak remains constant at ∼30 meV as the excitation power or temperature are varied, as seen from Fig. 1. This also confirms the assignment of this transition pair to X and a band edge transition as the X emission follows the band edge transition as the temperature is varied, until the X emission is no longer observed.
B. Excitation from CdS/CdTe junction (sample A)
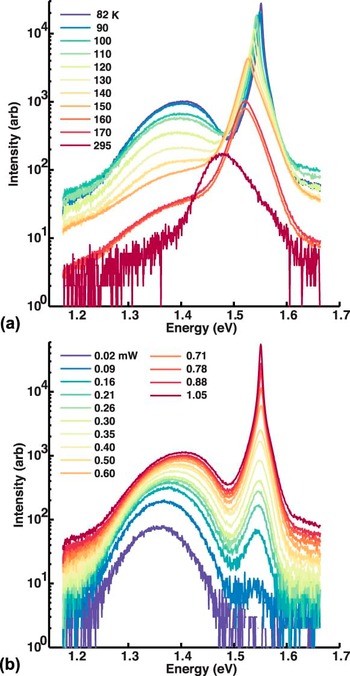
The PL spectra obtained by 0.9 mW laser excitation from the glass side to probe CdS/CdTe junction (sample A) at various temperatures are shown in Fig. 3(a). A plot of spectra obtained at 82 K for various excitation powers on the same sample is shown in Fig. 3(b). These spectra show a broad emission band between 1.3 and 1.4 eV region and a peak at 1.55 eV, similar to the case of CdTe PL [Fig. 1(b)] as measured from the CdTe film side. The spectra are dominated by the broad emission in the 1.3–1.4 eV region at lower excitation powers up to ∼0.3 mW and the sharp 1.55 eV peak at higher excitation powers at 82 K, as can be seen from Fig. 3(b).
PL spectra obtained by exciting the CdS/CdTe junction (sample A) from the glass side at (a) ∼0.9 mW laser excitation power as a function of measurement temperature and (b) 82 K as a function of laser excitation power.

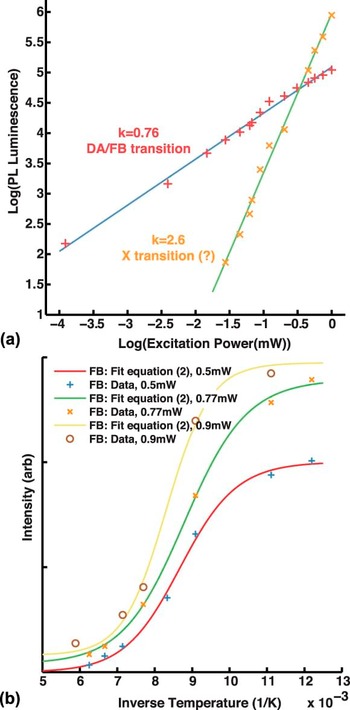
Figure 4(a) shows the integrated luminescence of the two transitions in the 1.3–1.4 eV region and at 1.55 eV as a function of excitation power at 82 K. These are calculated by fitting the 1.3–1.4 eV transition and 1.55 eV transition with an exponentially modified Gaussian and a Voigt curve, respectively. The straight lines are fits to the data as per Eq. (1). From this, we obtained k = 0.76 ± 0.04 and 2.6 ± 0.2 for these two transitions at 82 K, respectively. The error estimates are based on 95% confidence intervals. As in the case of Fig. 1(a), the k value indicates that the broad peak in the 1.3–1.4 eV region in Fig. 3(a) is a result of DA/FB recombination. However, k = 2.6 is greater than the limit for excitonic recombination. Reference Schmidt, Lischka and Zulehner23 Presumably, multiple power-dependent processes are influencing this behavior resulting in the stronger dependence on np product (light intensity) than expected. However, the position of the 1.55 eV peak in the 82 K spectra remains fixed as the excitation power is varied, as seen from Fig. 3(b). This is a clear signature that at least one of the involved processes is an excitonic emission.
Plot of (a) DA/FB and X emission luminescence versus excitation power and (b) FB luminescence versus inverse temperature from the CdS/CdTe junction PL spectra (sample A). The excitation powers used are indicated. Solid lines represent least squares fit to data as per Eqs. (1) and (2) in (a) and (b), respectively. Symbols represent experimental data.

An analysis similar to Sec. III. A shows that the broad 1.3–1.4 eV peak in 82 K spectra is a FB transition rather than a DA recombination. Using Eq. (3) to fit this peak at 0.5 mW excitation power delivered two activation energies of nearly the same value as when fit with Eq. (2), and the confidence intervals for the same were very large. Using Eq. (2) and following the same process as in Fig. 2(b), the activation energy for the quenching of this transition is found to be 100 ± 25 meV at ∼0.5 mW excitation power. Activation energies of 130 ± 45 and 90 ± 20 meV were obtained upon fitting the luminescence of the sub-bandgap peak at 0.9 and 0.77 mW respectively. These data and the corresponding fits are shown in Fig. 4(b). Activation energies for the near band-edge peak at 1.55 eV in the 82 K spectra could not be determined using Eqs. (2) or (3).
C. Excitation from CdS/CdTe junction (sample B)
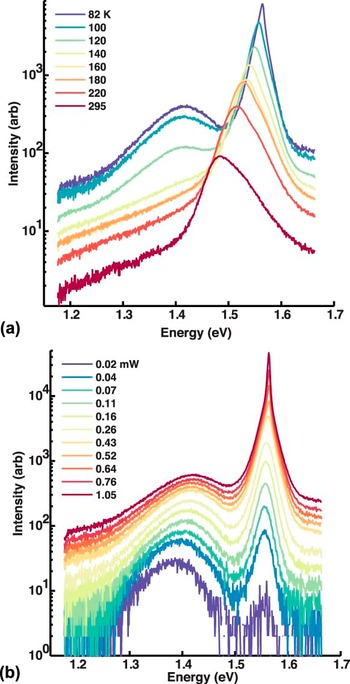
Figure 5(a) shows the CdS/CdTe heterojunction PL spectra as obtained by exciting the sample with Cu-containing back contacts (sample B) from the glass side for ∼0.5 mW excitation at various temperatures, as listed in the figure. This is different from the study in Figs. 1 and 3 in that Cu has been introduced from the back contact. The 82 K spectra consist of a broad sub-bandgap emission with a peak at 1.41 eV and a sharper peak centered around 1.56 eV. Figure 5(b) is a plot of PL spectra, similar to those of Figs. 1(b) and 3(b), for various excitation powers as obtained from the CdS/CdTe heterojunction at 82 K. It is clear that for nearly all temperatures and excitation powers the near band gap peak at ∼1.56 eV in 82 K spectra is the dominant transition. Thus, due to Cu incorporation, the sub-bandgap emission is suppressed and can be observed only up to 120 K, as seen in Fig. 5(a). The 1.58 eV shoulder at 82 K is less evident than in the case of sample A. Only at temperatures above 180 K when the emission is broad, there is a possible contribution from the 1.58 eV emission peak.
PL spectra obtained by exciting the CdS/CdTe junction from the glass side for sample B (with Cu) at (a) 0.5 mW laser excitation power as a function of measurement temperature and (b) 82 K as a function of laser excitation power.

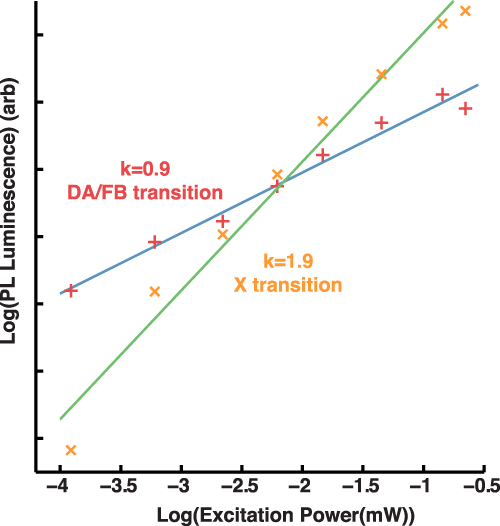
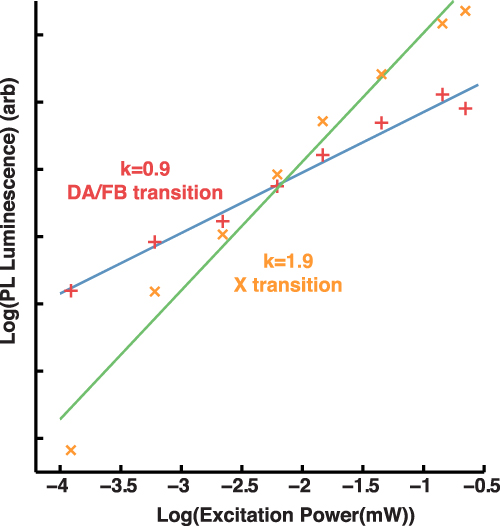
Figure 6 shows the variation of the 1.41 eV sub-gap and ∼1.56 eV integrated peak luminescence (in 82 K spectra) with respect to excitation power. As per Eq. (1) the values of k are found to be 0.90 ± 0.12 and 1.9 ± 0.3 for the two transitions, respectively. The error estimates are based on 95% confidence intervals. Thus, it can be concluded, as in other measurements, that the sub-gap transition is likely a DA/FB transition and the ∼1.56 eV transition is an X transition. Reference Schmidt, Lischka and Zulehner23 The claim that 1.56 eV transition is X is also supported by the fixed energy position of this peak as the excitation power is increased as in Fig. 5(b). The activation energy value for DA/FB transition could not be determined due to the weaker luminescence of this transition and the associated rapid temperature decay.
Plot of DA/FB and X emission luminescence versus excitation power for the CdS/CdTe junction PL from sample B (with Cu). Straight lines are least squares fit to data as per Eq. (1).
IV. DISCUSSION
The temperature dependent PL spectra obtained at a fixed excitation power from the back ∼100 nm of the CdTe, and the first ∼100 nm of the CdTe near the CdS/CdTe interface, including the graded region of the junction, (with and without back contacts) are shown in Figs. 1(a), 3(a), and 5(a), respectively. The absence of a significant shift in the near band edge emission in Figs. 3 and 5 relative to Fig. 1 suggests that the emission near the junction is not representative of the graded material. The low temperature sputtering growth (as compared to CSS) is likely to result in less intermixing and inter-diffusion of CdS and CdTe, resulting in reduced formation of a lower band gap alloy CdS x Te1−x along the junction. Some amount of band gap grading along the junction is possible, however, the existence of a built-in electric field in the depletion region near the junction would separate the photo-generated carriers out and hence reduce the avenues available for recombination representing the graded band gap along the junction. This effect also leads to enhanced non-radiative recombination of the carriers outside the depletion region as the radiative recombination rate depends on the np-product, which is reduced due to carrier separation. Hence, the band-edge luminescence (1.58 eV peak in the 82 K spectra from CdTe film) is suppressed in the CdS/CdTe junction spectra. All of the observed spectra share a similar overall shape. The two characteristic emissions in all PL spectra are the sub-band gap DA/FB emissions and the near band edge excitonic emissions. These are observed in the 1.3–1.4 eV region and near 1.55 eV, respectively. Previous studies on the luminescence properties of CdTe (Refs. Reference Halliday, Eggleston and Durose3, Reference Taguchi, Shirafuji and Inuishi5, and Reference Vatavu, Zhao, Padma, Rudaraju, Morel, Gaşin, Caraman and Ferekides16) and device quality CdS/CdTe heterojunctions Reference Vatavu, Zhao, Caraman, Gaşin and Ferekides4,Reference Grecu and Compaan12,Reference Romero, Albin, Al-Jassim, Wu, Moutinho and Dhere29 have reported similar peaks. For instance, a 1.42 eV peak in the CdTe PL spectrum has been associated with a transition involving ClTe–VCd defect complex. Reference Okamoto, Matsuzaki, Amin, Yamada and Konagai17 An acceptor binding energy of 120 meV has been calculated for the ClTe–VCd defect complex. Reference Hofmann, Omling, Grimmeiss, Meyer, Benz and Sinerius30 In Secs. III. A and III. B, we were able to show that these transitions correspond to a FB transition, whose temperature dependent quenching behavior was modeled closely by using Eq. (2). Thus, the low energy transitions observed in Figs. 1(a) and 3(a) are FB transition with a bound state with activation energy of ∼100 meV as obtained from the fits. However, a determination of activation energy for the low energy sub-band gap peak was not possible for sample B [Fig. 5(b)], due to the rapid thermal decay of this peak. In addition, near band edge excitonic emissions have also been observed and associated with acceptor bound excitons. Reference Aguilar-Hernández, Contreras-Puente, Figueroa-Estrada and Zelaya-Angel10,Reference Aguilar-Hernandez, Contreras-Puente, Flores-Llamas, Yee-Madeira and Zelaya-Angel31,Reference James, Merz and Jones32 These similarities between the PL spectra obtained and those observed by others serve to show that the sputtered CdTe based devices have comparable electronic structure to those deposited using other methods. Hence, we can generalize the results obtained from this study to apply to devices incorporating either sputtered or evaporated CdTe.
The near band edge emissions from the bare CdS/CdTe junction excited from both, the film and the substrate sides [Figs. 1(b) and 3(b)] have a peak centered at 1.55 eV. This peak corresponds to a bound excitonic emission as shown in Sec. III. A, which indicates that both of these peaks are due to excitons bound to the same impurity/defect. Near band edge acceptor bound excitons have been observed in PL spectra of CdTe (Ref. Reference Chou, Rohatgi, Thomas, Kamra and Bhat8, Reference Krustok, Collan and Hjelt24, and Reference Marple25) and the dominant acceptor in CdTe is thought to be the VCd–ClTe defect complex. When Cu is introduced via the back contact, the luminescence properties of the CdS/CdTe junction are affected. The X peak now moves to 1.56 eV from 1.55 eV as expected if this peak is an acceptor bound excitonic emission, since after the introduction of Cu, CuCd is the primary acceptor Reference Laurenti, Bastide, Rouzeyre and Triboulet33 and the corresponding emission has a higher energy than exciton bound to ClTe–VCd defect complex. Reference Okamoto, Yamada and Konagai2,Reference James, Merz and Jones32
On comparing the PL from CdS/CdTe junctions before and after the introduction of Cu as a function of excitation power [Figs. 3(b) and 5(b)], it is seen that the sub-bandgap transitions are suppressed near the heterojunction upon addition of Cu even though the Cu is added at the back surface of the device. Upon annealing, Cu deposited on the surface of the CdTe is incorporated as Cu interstitials (Cui), Reference Chin, Gessert and Wei34 a fast diffusing donor species that interacts with VCd to form a Cui–VCd acceptor complex, Cu on VCd (CuCd) acceptors and CuCd–Cui neutral complexes. Reference Zoth, Ridel and Schröter35 It is likely that the interaction of Cui with VCd to form CuCd or Cui–VCd disrupts the ClTe–VCd acceptor complex and hence strongly attenuates the sub-band gap transition that is observed in PL from samples without Cu incorporation [Figs. 1(a) and 3(a)], which is a result of transitions involving the VCd–ClTe complex. According to Romero et al., Reference Romero, Albin, Al-Jassim, Wu, Moutinho and Dhere29 CuCd acceptors are recombination centers of much higher efficiency than any other defect complex involving Cu. It is likely that the remaining sub-bandgap transition, as seen in Fig. 5(a) at low temperatures (<120 K), is due to a transition involving CuCd.
On comparison of Figs. 1(b), 3(b), and 5(b), we noticed that there is a transition excitation power where the PL emission changes from being dominated by the sub-band gap transitions to near band edge X transitions. This is observed at ∼0.7, ∼0.3 mW in the case of Figs. 1(b) and 3(b), respectively. However, in Fig. 5(b) the X peak is dominant at nearly all excitation powers due to the quenching of sub-gap recombination. One possible reason for this change in the dominant luminescence with excitation power could be larger carrier lifetimes for the FB than the X transitions. As we increase the carrier generation rate by increasing the excitation power, the rate of recombination via the sub-bandgap transitions is not sufficient to recombine all of the generated carriers and the near band edge emissions result. However, further work in this direction is needed before any conclusive statement can be made.
V. CONCLUSIONS
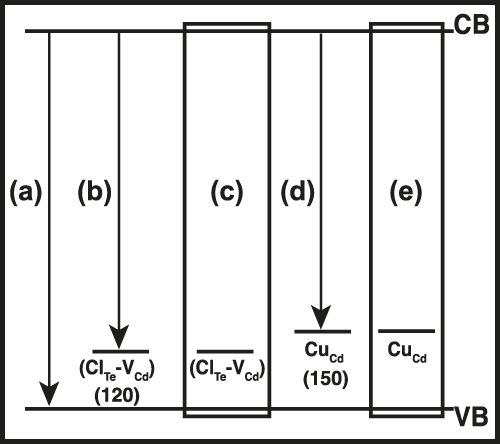
Low temperature PL spectra from sputter-deposited CdTe surfaces and CdS/CdTe junctions, and their line shape and temperature quenching behavior reveal that the dominant emission peaks primarily arise from FB/DA and bound exciton recombinations. A detailed analysis of temperature and excitation power dependence of the PL spectra revealed the most prominent efficiency limiting defects in these films. In the case of PL from CdCl2 treated CdTe film (without the inclusion of Cu), it was possible to associate the sub-gap luminescence peak to a FB transition involving a bound state with ionization energy of ∼100 meV. The acceptor level for the FB emission in this case was concluded to be ClTe–VCd complex. Upon Cu incorporation, the DA transition is suppressed, probably due to Cu occupying VCd sites. The residual sub-bandgap transition is possibly due to CuCd acceptors. The observed transitions are summarized in Fig. 7 in the form of an energy diagram depicting various defect levels and their corresponding emissions. A shift in the dominant luminescence from sub-bandgap to near band edge transitions as a function of increasing laser excitation power was observed. In addition, the near band gap emission in the CdS/CdTe spectra (sample A) was concluded to be a convolution of multiple radiative recombination transitions. Further work is required to ascertain the reason for the above-mentioned peak shift and to analyze the constituent radiative transitions responsible for the anomalous k-value for the near band gap peak in the CdS/CdTe junction spectra (sample A).
A suggested energy band diagram showing various defect levels and possible transitions that lead to the observed PL spectra. (a) Band to band recombination; (b) FB transition involving (ClTe–VCd) acceptor; (c) (ClTe–VCd) acceptor bound exciton; (d) DA/FB transition involving CuCd acceptor; and (e) CuCd acceptor bound exciton. The binding energy values (indicated in parenthesis) are taken from Refs. Reference Hofmann, Omling, Grimmeiss, Meyer, Benz and Sinerius30 and Reference Laurenti, Bastide, Rouzeyre and Triboulet33.

ACKNOWLEDGMENTS
The authors acknowledge Allen Hall for useful discussions and help in experimentation. The financial support from the U.S. Department of Energy, Office of Energy Efficiency and Renewable Energy (Contract DE-EE0005405) is greatly appreciated. This work was carried out in part in the Frederick Seitz Materials Research Laboratory Central Research Facilities, University of Illinois.