
1 Introduction
The laminar state of channel flow becomes linearly unstable above  $Re=5772$; however, given sufficiently strong perturbations, the flow can undergo subcritical transition to turbulence and become sustained at much lower Reynolds number at
 $Re\simeq 660$ (Xiong et al. Reference Xiong, Tao, Chen and Brandt2015; Tao, Eckhardt & Xiong Reference Tao, Eckhardt and Xiong2018). Here, the Reynolds number is defined as
 $Re=U_{c}h/\unicode[STIX]{x1D708}$, where
 $U_{c}$ is the centreline velocity of the unperturbed parabolic flow,
 $h$ the half gap width and
 $\unicode[STIX]{x1D708}$ the kinematic viscosity of the fluid. At low Reynolds numbers, Tsukahara et al. (Reference Tsukahara, Seki, Kawamura and Tochio2005) first found that channel flow turbulence appears as localised bands tilted with respect to the streamwise direction, and many studies have investigated band structures in channel flow since then (Tsukahara, Kawaguchi & Kawamura Reference Tsukahara, Kawaguchi and Kawamura2014; Tsukahara & Kawamura Reference Tsukahara and Kawamura2014; Tuckerman et al. Reference Tuckerman, Kreilos, Shrobsdorff, Schneider and Gibson2014; Xiong et al. Reference Xiong, Tao, Chen and Brandt2015; Kanazawa Reference Kanazawa2018; Tao et al. Reference Tao, Eckhardt and Xiong2018). Similar band patterns also appear in the transitional regime in other plane shear flows (Coles Reference Coles1965; Prigent et al. Reference Prigent, Gregoire, Chate, Dauchot and van Saarloos2002; Barkley & Tuckerman Reference Barkley and Tuckerman2005; Duguet, Schlatter & Henningson Reference Duguet, Schlatter and Henningson2010; Duguet & Schlatter Reference Duguet and Schlatter2013; Chantry, Tuckerman & Barkley Reference Chantry, Tuckerman and Barkley2017).
The transition scenario through localised turbulence in channel flow has attracted much attention in recent studies. Sano & Tamai (Reference Sano and Tamai2016) proposed a directed percolation (DP) transition, above  $Re_{cr,DP}\simeq 830$, to featureless turbulence at much larger Reynolds numbers. Together with Lemoult et al. (Reference Lemoult, Shi, Avila, Jalikop, Avila and Hof2016), Chantry et al. (Reference Chantry, Tuckerman and Barkley2017) and Mukund & Hof (Reference Mukund and Hof2018), recent studies categorised the transition to sustained turbulence in shear flows into the DP universality class. DP theory predicts no sustained turbulence below the DP critical point. However, using large computational domains, Xiong et al. (Reference Xiong, Tao, Chen and Brandt2015) and Tao et al. (Reference Tao, Eckhardt and Xiong2018) recently reported that, even below
 $Re_{cr,DP}$, a single turbulent band can persistently grow transversely in the absence of interactions with other bands and channel sidewalls. Therefore, the turbulence fraction stays finite whereas DP theory predicts zero below
 $Re_{cr,DP}$. This sparse-turbulence state was argued to be responsible for the deviation of the transition scenario in channel flow from the DP theory of Sano & Tamai (Reference Sano and Tamai2016). Shimizu & Manneville (Reference Shimizu and Manneville2018) studied interactions between multiple bands in a very large domain (
 $500h\times 2h\times 250h$) and also reported sustained banded turbulence structures below the DP critical point of Sano & Tamai (Reference Sano and Tamai2016). Further, through observing and modelling of the complex interactions between bands, they proposed a bifurcation process that leads from the one-sided banded turbulence state at lowest
 $Re$ to two-sided banded turbulence as
 $Re$ increases, and eventually to the onset of DP at
 $Re=976$, a bit higher than the DP critical point of Sano & Tamai (Reference Sano and Tamai2016).
However, there have so far been rather limited studies of the detailed flow structures and the dynamics of individual turbulent bands in channel flow, especially in large flow domains. The mean flow of the repeated turbulent band–laminar gap pattern has been studied and modelled by Tuckerman et al. (Reference Tuckerman, Kreilos, Shrobsdorff, Schneider and Gibson2014). Regarding the structure and dynamics of a fully localised band in a large domain, Shimizu & Manneville (Reference Shimizu and Manneville2018) and Kanazawa (Reference Kanazawa2018) noticed that a turbulent band at low Reynolds numbers is characterised by an active head at the downstream end and a rather diffusive tail at the upstream end. The numerical simulation of Shimizu & Manneville (Reference Shimizu and Manneville2018) in a  $500h\times 2h\times 250h$ domain up to
 $O(10^{5})$ time units seems to suggest that a single band does not grow infinitely long, but instead can undergo longitudinal splitting, which seems to disagree with the conclusion of Tao et al. (Reference Tao, Eckhardt and Xiong2018). Nevertheless, both of their results indicated that a single band can be sustained at low Reynolds numbers. To the best of our knowledge, there have been no studies regarding the growth mechanism and the self-sustaining mechanism of an individual turbulent band in channel flow. In this contribution, we aim to fill this gap and investigate the kinematics, and particularly the growth mechanism, of fully localised bands in more detail at
 $Re=750$.
2 Methods
We solve the non-dimensional incompressible Navier–Stokes equations
 $$\begin{eqnarray}\frac{\unicode[STIX]{x2202}\boldsymbol{u}}{\unicode[STIX]{x2202}t}+\boldsymbol{u}\boldsymbol{\cdot }\unicode[STIX]{x1D735}\boldsymbol{u}=-\unicode[STIX]{x1D735}p+\frac{1}{Re}\unicode[STIX]{x1D6FB}^{2}\boldsymbol{u},\quad \unicode[STIX]{x1D735}\boldsymbol{\cdot }\boldsymbol{u}=0\end{eqnarray}$$
for a volume flux-driven channel flow in Cartesian coordinates  $(x,y,z)$, where
 $\boldsymbol{u}$ denotes velocity,
 $p$ denotes pressure and
 $x$,
 $y$ and
 $z$ represent the streamwise, wall-normal and spanwise coordinates, respectively. The flux in the streamwise direction is fixed to be that of the unperturbed parabolic laminar flow and the flux in the spanwise direction is zero. Velocities are normalised by
 $U_{c}$, length is normalised by
 $h$ and time by
 $h/U_{c}$. The origin of the
 $y$-axis is placed at the channel centre. No-slip boundary conditions,
 $\boldsymbol{u}=0$, for velocities are imposed at channel walls (i.e. at
 $y=\pm 1$). Periodic boundary conditions are imposed in streamwise and spanwise directions. A hybrid Fourier spectral–finite difference method is used to solve (2.1). In the wall-normal direction, a finite-difference method with a 9-point stencil is employed for the discretisation. Therefore, the velocity and pressure fields can be expressed as
 $$\begin{eqnarray}A(x,y,z,t)=\mathop{\sum }_{k=-K}^{K}\mathop{\sum }_{m=-M}^{M}\hat{A}_{k,m}(y,t)\text{e}^{\text{i}(\unicode[STIX]{x1D6FC}kx+\unicode[STIX]{x1D6FD}mz)},\end{eqnarray}$$
where  $k$ and
 $m$ are the indices of the streamwise and spanwise Fourier modes, respectively,
 $\hat{A}_{k,m}$ is the Fourier coefficient of the mode
 $(k,m)$, and
 $\unicode[STIX]{x1D6FC}$ and
 $\unicode[STIX]{x1D6FD}$ are the fundamental wavenumbers in the streamwise and spanwise directions, respectively. The size of the computational domain is set to be
 $L_{x}=2\unicode[STIX]{x03C0}/\unicode[STIX]{x1D6FC}$ and
 $L_{z}=2\unicode[STIX]{x03C0}/\unicode[STIX]{x1D6FD}$. We use the finite-difference scheme and the parallelisation strategy of Openpipeflow (Willis Reference Willis2017) and adopt the time-stepping and projection scheme of Hugues & Randriamampianina (Reference Hugues and Randriamampianina1998) for integrating the incompressible system.
3 Results
We first performed direct numerical simulations (DNS) at  $Re=750$ in a computational box with
 $L_{x}=120$ and
 $L_{z}=120$. We used 768 Fourier modes (
 $K=M=384$) in both streamwise and spanwise directions. This resolution gives six grid points in the horizontal directions per unit length of
 $h$ and is comparable with Tao et al. (Reference Tao, Eckhardt and Xiong2018), which results in a decrease by more than four orders of magnitude in the amplitude of the Fourier coefficient from the lowest to the highest Fourier mode for a turbulent field. Tuckerman et al. (Reference Tuckerman, Kreilos, Shrobsdorff, Schneider and Gibson2014) used 12 grid points over
 $h$ for
 $Re$ up to 2300, which also implies that our resolution is sufficient for
 $Re=750$ assuming
 $N\sim Re^{3/4}$, where
 $N$ is the number of grid points in one spatial dimension. We used 72 Chebyshev grid points for the finite-difference discretisation in the wall-normal direction (we also tested 96 points and found 72 sufficient). A time-step size of
 $\unicode[STIX]{x0394}t=0.01$ is used for the time integration, which is sufficiently small for this low Reynolds number.
We first perturbed the flow at  $Re=950$ using a localised vortical perturbation proposed by Henningson & Kim (Reference Henningson and Kim1991). After a band was formed, we reduced the Reynolds number to
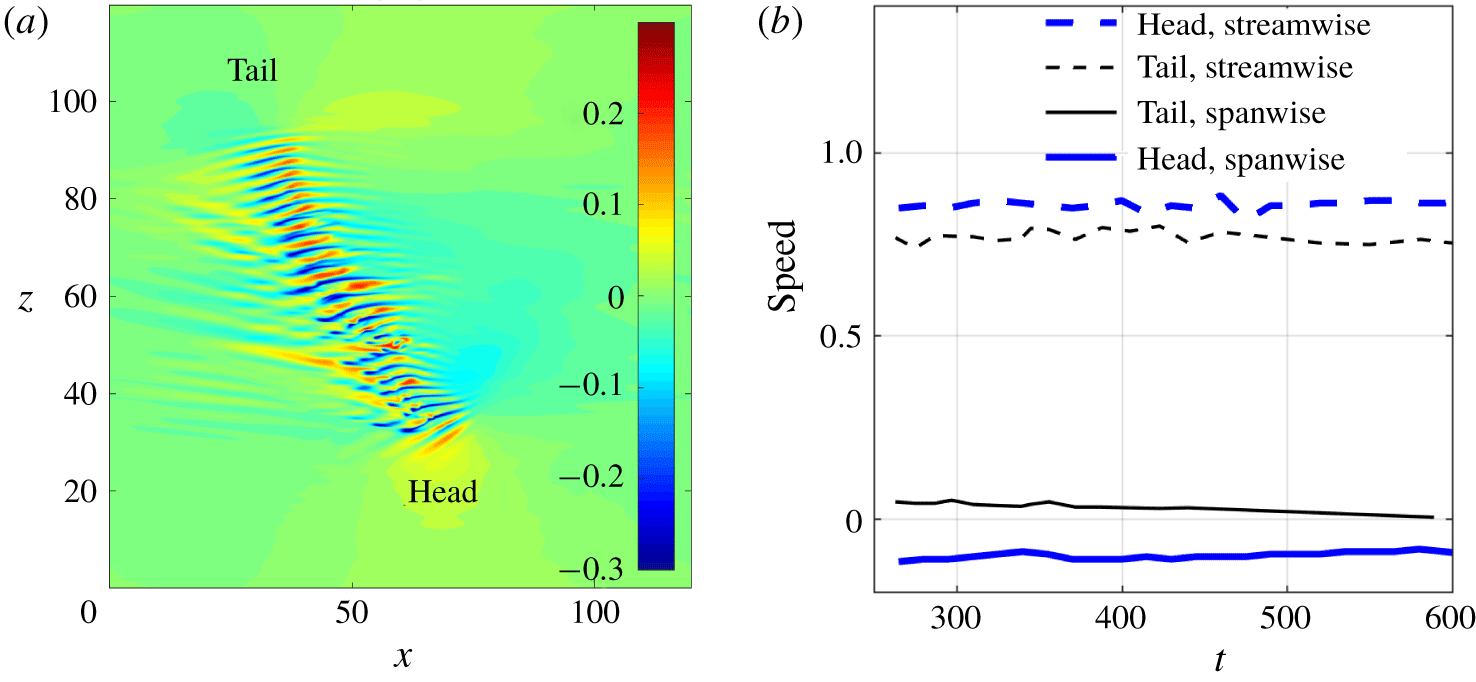
 $Re=750$ and, after some initial adjustment, obtained a single band (see figure 1a). As mentioned by Shimizu & Manneville (Reference Shimizu and Manneville2018), the turbulent band in this Reynolds number regime is characterised by an active downstream end (referred to as head hereafter) and a rather diffusive upstream end (referred to as tail hereafter), which are labelled in the figure. In addition, we observed a wave-like pattern (i.e. a pattern of alternating high- and low-speed streaks), localised in the streamwise direction, along the turbulent band in the
 $x$–
 $z$ cut plane at
 $y=-0.5$ (see figure 1a). A similar wave pattern was also observed at the downstream end of turbulent bands in the numerical simulations of Kanazawa (Reference Kanazawa2018), at the wing tip of turbulent spots at higher Reynolds numbers in channel flow (Carlson, Widnall & Peeters Reference Carlson, Widnall and Peeters1982; Alavyoon, Henningson & Alfredsson Reference Alavyoon, Henningson and Alfredsson1986; Henningson & Alfredsson Reference Henningson and Alfredsson1987; Henningson Reference Henningson1989; Henningson & Kim Reference Henningson and Kim1991) and in plane Couette flow (Dauchaot & Daviaud Reference Dauchaot and Daviaud1995) as well.
(a) Turbulent band formed at  $Re=750$ starting from an initial condition simulated at
 $Re=950$. The streamwise velocity
 $u_{x}$ in the
 $x$–
 $z$ cut plane at
 $y=-0.5$ is plotted as the colourmap. The flow is from left to right in the figure and the band is tilted about the streamwise direction at an angle of
 $57^{\circ }$ at this time instant, which is calculated using the method given in Tao et al. (Reference Tao, Eckhardt and Xiong2018). (b) The streamwise and spanwise speeds of the tail and head of the band shown in (a).

3.1 Kinematics of the head and tail
To understand the growth mechanism of the band, we first investigated the kinematics of the head and tail. We tracked the head and tail and measured their mean speeds, which are shown in figure 1(b). Streamwise and spanwise positions of the head and tail are determined by setting an appropriate threshold in the fluctuation intensity above which the region is considered turbulent and otherwise laminar. Speed is subsequently calculated based on the time series of the position. Both streamwise and spanwise speeds of the head are quite stable over the time window we investigated, with the former being 0.85 and the latter being  $-0.10$ on average (see the bold lines). Clearly the head is invading the adjacent laminar flow. The streamwise speed of the tail is also quite stable, with an average of 0.76 (see the dashed thin line), whereas the spanwise speed of the tail is approximately 0.035 at
 $t=250$, and slowly decreases to nearly zero at approximately
 $t=600$ (see the solid thin line). Clearly, the spanwise speed of the tail has not stabilised within the time window of approximately 300 time units, and shows a decreasing trend as time goes on. The domain size chosen is not large enough for a longer measurement time because at later times the head and tail get too close to each other and start to interact due to the periodic boundary condition.
To study the kinematics of the tail with a less restrictive domain size, we considered a larger computation domain with  $L_{x}=L_{z}=320$. For this domain size, we used a resolution of 2048 Fourier modes (
 $K=M=1024$) in both spanwise and streamwise directions (
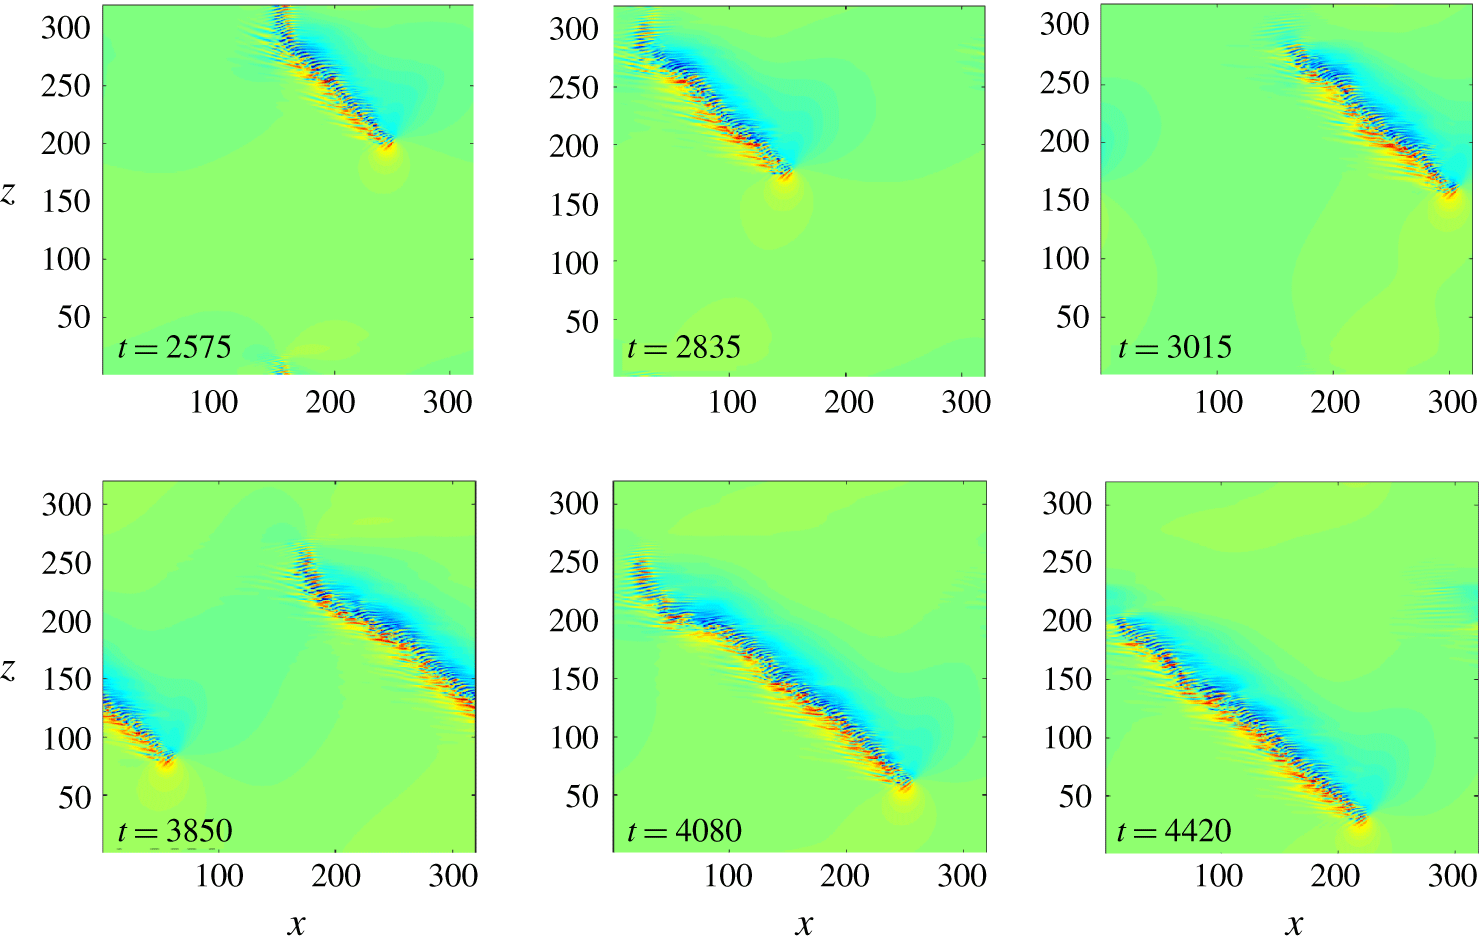
 $h/\unicode[STIX]{x0394}x=h/\unicode[STIX]{x0394}z\simeq 6.4$). Figure 2 shows the development of a turbulent band in the domain. This large domain allows a much longer observation time of the band without significant head–tail interaction due to the periodic boundary condition.
Turbulent band in the large domain with  $L_{x}=L_{z}=320$. The contours of streamwise velocity are visualised in the
 $x$–
 $z$ cut plane at
 $y=-0.5$. Flow is from left to right.

Overall, the tail is moving downwards in the spanwise direction (i.e. the spanwise speed is negative), which cannot be observed in the small domain shown before. Nevertheless, this negative speed is consistent with the trend of the spanwise speed shown in figure 1(b). However, because the tail decays continually as a bulk (multiple streaky structures decay as a whole; see the tail shown in the snapshots from  $t=2575$ to 3015 and from
 $t=3850$ to 4420 in figure 2), it is difficult to define a characteristic advection speed. Nevertheless, based on the spanwise position of the tail over very a large time interval (
 $O(10^{3})$), we can estimate an average spanwise speed of the tail, which is approximately
 $-0.06$.
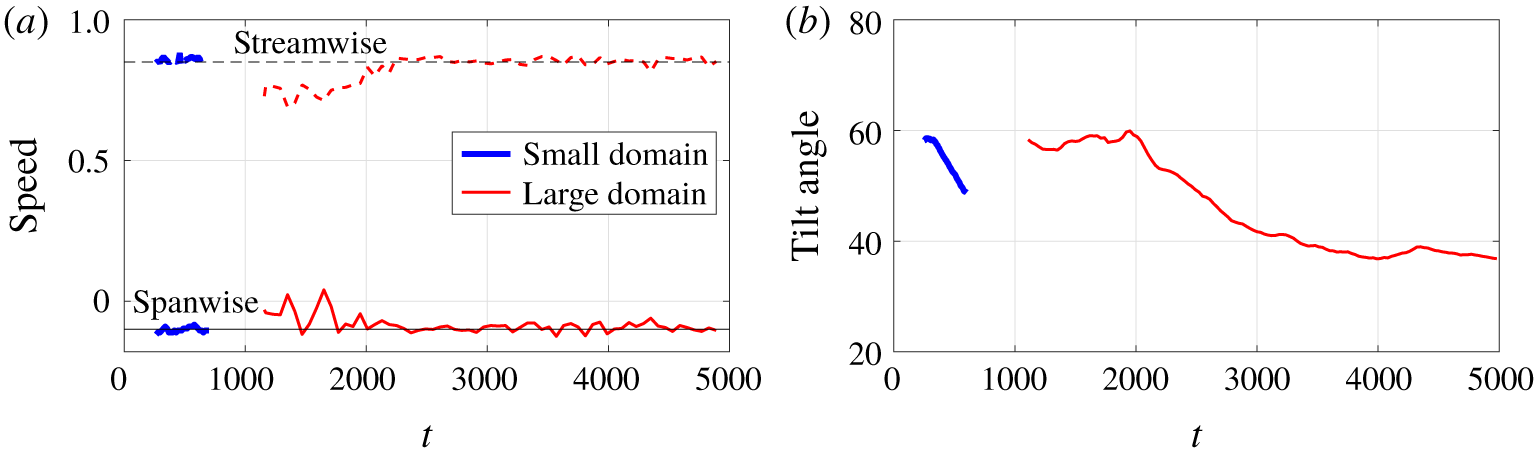
Speeds of the head (a) and tilt angle of the turbulent band (b) for the small domain ( $120\times 2\times 120$) and large domain (
 $320\times 2\times 320$). The reference speeds of 0.85 and
 $-0.1$ are plotted as thin dashed and solid lines. The tilt angle shown in panel (b) is calculated using the method used by Tao et al. (Reference Tao, Eckhardt and Xiong2018).

It is noted that the kinematics of the head is not affected by the domain size, as both the streamwise and spanwise speed of the head are still 0.85 and  $-0.1$ on average, respectively; see the
 $t>2000$ part of the large domain case in figure 3(a). This implies that the head has rather robust structure and dynamics. The tilt angle of the band is also calculated for the two domain sizes using the method proposed by Tao et al. (Reference Tao, Eckhardt and Xiong2018) and compared in figure 3(b). It can be seen that the tilt angle keeps decreasing and has not stabilised in the entire observation time in the small domain. In the large domain, we can see that the tilt angle seems to have stabilised and fluctuates between
 $37^{\circ }$ and
 $39^{\circ }$ after a very long transient of approximately 2000 time units (the length of the transient is probably dependent on the initial conditions, as Tao et al. (Reference Tao, Eckhardt and Xiong2018) showed a shorter transient of approximately 1000 time units).
3.2 Streak generation at the head of the band
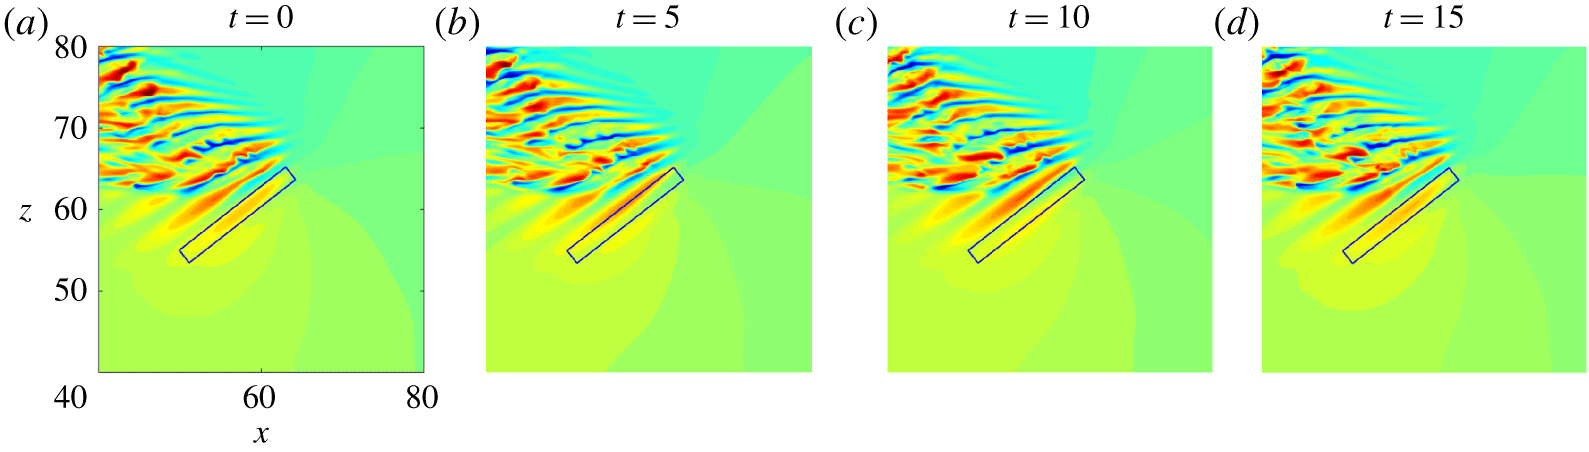
Illustration of the generation of streaks at the band head. A black rectangle is used to mark the first observable streak generated at the head. Streamwise velocity fluctuations are plotted as the colourmap. Panels (a–d) show four time instants separated by 5 time units.

To investigate the dynamics of the head, we went into the frame of reference co-moving with the head at a spanwise speed of  $-0.1$ and visualised the flow in the
 $x$–
 $z$ cut plane at
 $y=-0.5$ (see figure 4). We observed that wave-like structures (i.e. alternating low- and high-speed streaks) are continually generated at the head. The high-speed streak in the black rectangle (panel (a)) moves towards the band body and leaves the rectangle (panels (b,c)), and subsequently a new high-speed streak forms at the head and appears in the rectangle after approximately 15 time units (panel (d)). Noting that the enclosed streak in panel (d) is nearly the same as the one in panel (a), we estimated that the period of the streak generation is approximately 15 time units. See supplementary movie 1, available at https://doi.org/10.1017/jfm.2019.899, for a better visualisation of this dynamical process. Kanazawa (Reference Kanazawa2018) also observed this process in channel flow and attributed the growth of a turbulent band to the periodic wave generation at the head.
3.2.1 Mean flow around the head
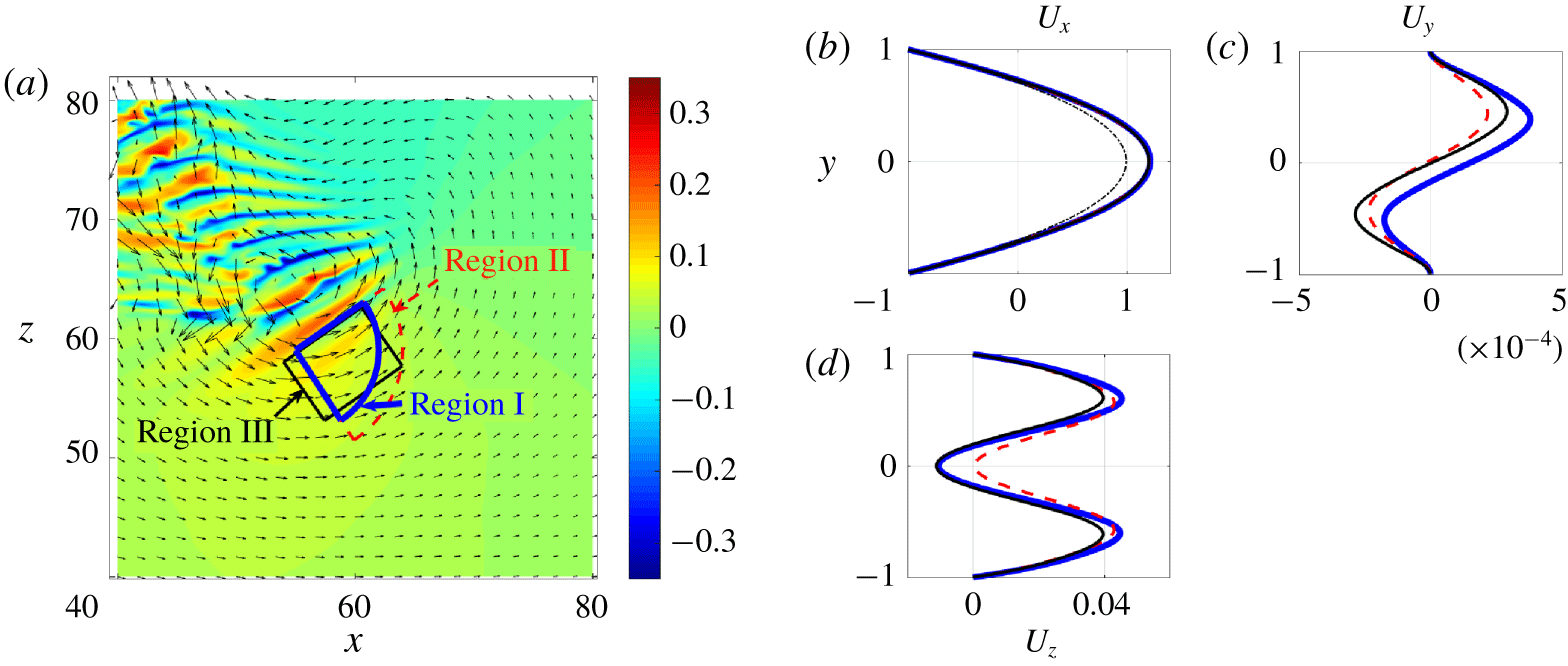
For turbulent spots at higher Reynolds numbers, Li & Widnall (Reference Li and Widnall1989), Henningson & Alfredsson (Reference Henningson and Alfredsson1987) and Henningson (Reference Henningson1989) proposed that the generation of wave-like structures at the wing tip of the spot is due to the destabilisation of the flow by the spot in the wing-tip region. Following their studies, we investigated the temporally and spatially averaged mean flow at the head (referred to as ‘mean flow’ hereafter), particularly in the region where the first visible streak is periodically generated. We selected three regions enclosing the first visible high-speed streak, and named them as region I (bold blue), region II (dashed red) and region III (thin black) (see figure 5a). We considered different shapes (quarter circle and rectangle) and different positions and sizes of the region, in order to check the sensitivity of the mean flow to the selected region. We averaged the flow both spatially and temporally in the three regions in the co-moving frame of reference using approximately 150 snapshots separated by  $\unicode[STIX]{x0394}t=1$, and obtained the one-dimensional mean flow. The duration of the averaging is one order of magnitude larger than the estimated streak generation period. We plotted the streamwise, wall-normal and spanwise velocity profiles of the mean flow in the three regions in figure 5(b–d). In fact, the instantaneous spatially averaged velocity profile fluctuates slightly due to weak nonlinearity and fluctuations in the position of the head. The two maxima of the spatially averaged spanwise velocity have different heights which alternate in time, as can be seen in supplementary movie 2.
(a) Three regions near the head in which the spatially and temporally averaged velocity profiles are calculated: regions I (bold blue), II (dashed red) and III (thin black). (b–d) Averaged velocity profiles of  $U_{x}$,
 $U_{y}$ and
 $U_{z}$ in the three regions as defined in panel (a). The colour and line style correspond to those in (a). In panel (b), the parabola is shown as a black thin dash-dotted line.

The mean streamwise velocity profile is considerably higher than the basic parabolic profile, indicating a higher local Reynolds number. The mean spanwise velocity profiles, in all three regions, exhibit strong inflection, similar to the observation of Henningson & Alfredsson (Reference Henningson and Alfredsson1987) and Henningson (Reference Henningson1989) in the wing-tip region of turbulent spots. The  $y$-component of the mean flow velocity is orders of magnitude smaller than the other two. We speculate that the streaky structures at the head and within the band body originate from a local inflectional instability at the head, as proposed by Henningson & Alfredsson (Reference Henningson and Alfredsson1987) and Henningson (Reference Henningson1989) for spots. To check this possibility, we carried out a linear stability analysis based on the measured mean flow.
3.2.2 Linear stability analysis
Considering that the  $y$-component of the averaged mean flow is orders of magnitude smaller than the other two (see figure 5b–d), we zeroed the
 $y$-component and considered a two-component mean flow
 $\boldsymbol{U}_{b}(y)=(U_{x}(y),0,U_{z}(y))$, which is a solenoidal field and depends only on
 $y$. We adopted the velocity–vorticity formulation of the Navier–Stokes equations, and derived the governing equations of small perturbations with respect to
 $\boldsymbol{U}_{b}$ as the following:
 $$\begin{eqnarray}\displaystyle & \displaystyle \left(\frac{\unicode[STIX]{x2202}}{\unicode[STIX]{x2202}t}+U_{x}\frac{\unicode[STIX]{x2202}}{\unicode[STIX]{x2202}x}+U_{z}\frac{\unicode[STIX]{x2202}}{\unicode[STIX]{x2202}z}\right)\unicode[STIX]{x1D6FB}^{2}u_{y}-\frac{\text{d}^{2}U_{x}}{\text{d}y^{2}}\frac{\unicode[STIX]{x2202}u_{y}}{\unicode[STIX]{x2202}x}-\frac{\text{d}^{2}U_{z}}{\text{d}y^{2}}\frac{\unicode[STIX]{x2202}u_{y}}{\unicode[STIX]{x2202}z}=\frac{1}{Re}\unicode[STIX]{x1D6FB}^{4}u_{y}, & \displaystyle\end{eqnarray}$$
 $$\begin{eqnarray}\displaystyle & \displaystyle \left(\frac{\unicode[STIX]{x2202}}{\unicode[STIX]{x2202}t}+U_{x}\frac{\unicode[STIX]{x2202}}{\unicode[STIX]{x2202}x}+U_{z}\frac{\unicode[STIX]{x2202}}{\unicode[STIX]{x2202}z}\right)\unicode[STIX]{x1D702}+\frac{\text{d}U_{x}}{\text{d}y}\frac{\unicode[STIX]{x2202}u_{y}}{\unicode[STIX]{x2202}z}-\frac{\text{d}U_{z}}{\text{d}y}\frac{\unicode[STIX]{x2202}u_{y}}{\unicode[STIX]{x2202}x}=\frac{1}{Re}\unicode[STIX]{x1D6FB}^{2}\unicode[STIX]{x1D702}, & \displaystyle\end{eqnarray}$$
where  $u_{y}$ denotes the wall-normal velocity and
 $\unicode[STIX]{x1D702}=\unicode[STIX]{x2202}u_{x}/\unicode[STIX]{x2202}z-\unicode[STIX]{x2202}u_{z}/\unicode[STIX]{x2202}x$ is the
 $y$-component of the fluctuating vorticity (for an alternative formulation, see Henningson & Alfredsson (Reference Henningson and Alfredsson1987)). The boundary condition is
 $u_{y}=\unicode[STIX]{x2202}u_{y}/\unicode[STIX]{x2202}y=0$ and
 $\unicode[STIX]{x1D702}=0$ at
 $y=\pm 1$. A Chebyshev–Fourier spectral method is used to discretise this system (for details see Trefethen (Reference Trefethen2000)).
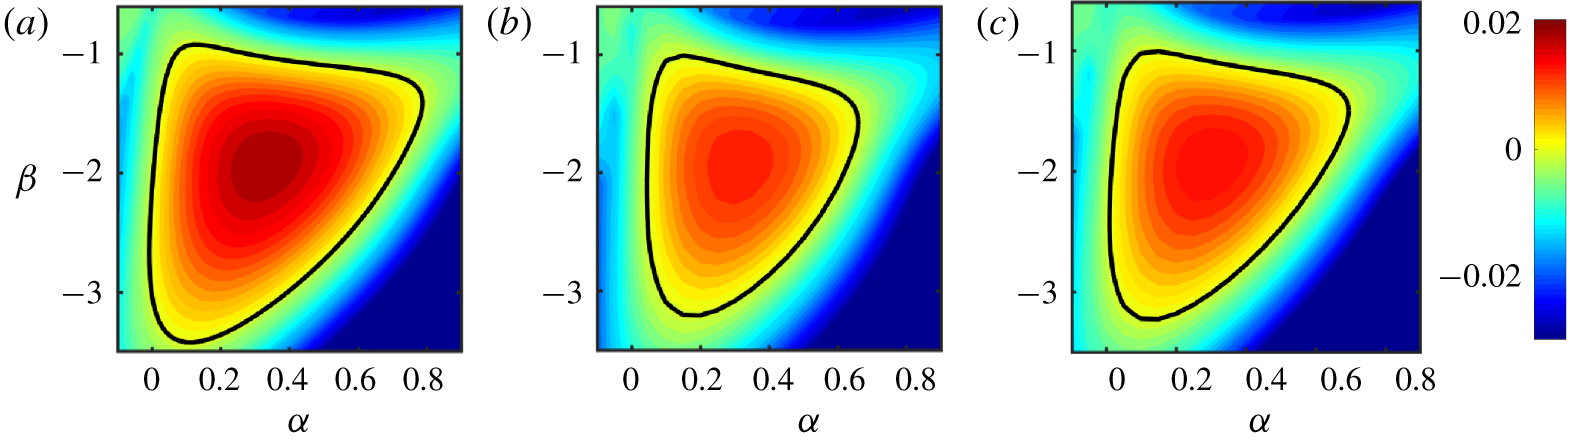
The linear stability is analysed mode by mode and contours of the most unstable/least stable eigenvalue are plotted in the  $\unicode[STIX]{x1D6FC}$–
 $\unicode[STIX]{x1D6FD}$ wavenumber plane (see figure 6). It is clear that a large region in the wavenumber plane is unstable, with positive imaginary part of the most unstable eigenvalue, for all three averaged mean flows (see the region enclosed by the bold black line). The most unstable modes are
 $(\unicode[STIX]{x1D6FC},\unicode[STIX]{x1D6FD})=(0.34,-1.92)$,
 $(0.30,-1.94)$ and (
 $0.30,-1.93$) for regions I, II and III, respectively. The most unstable eigenvalues of these three modes are
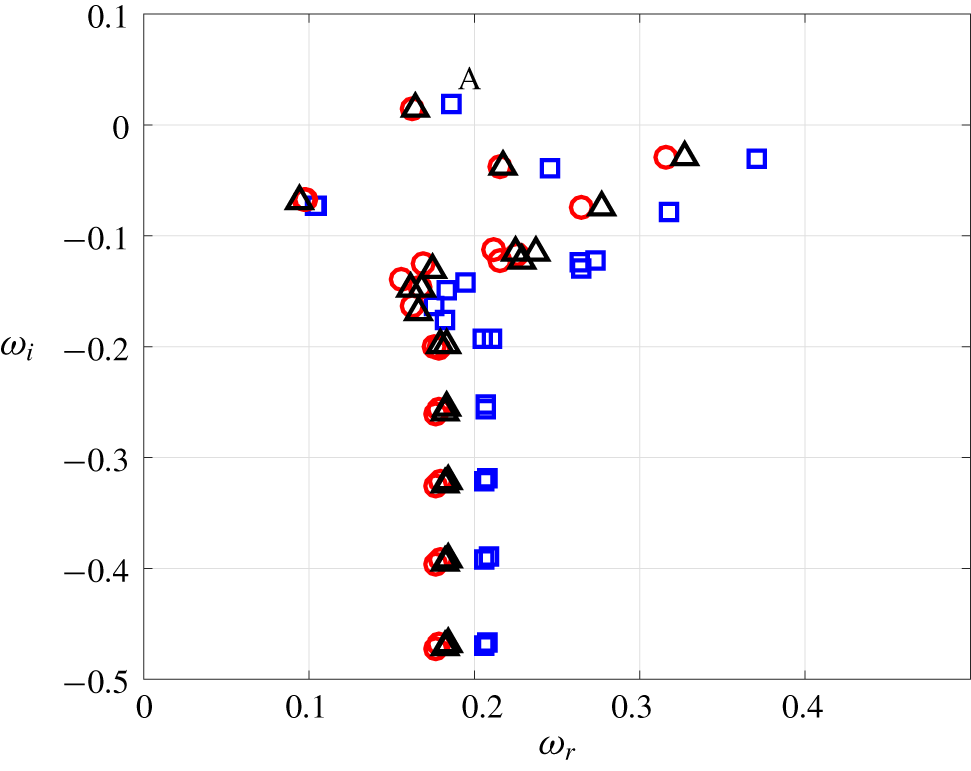
 $\unicode[STIX]{x1D714}=0.1861+0.0192\text{i}$,
 $0.1628+0.0140\text{i}$ and
 $0.1643+0.0148\text{i}$ (see figure 7), respectively, where the real parts give the frequencies and the imaginary parts give the temporal growth rates of the corresponding eigenvectors. From the most unstable eigenvalue and the corresponding wavenumber, we can calculate the spanwise wave speed of the flow structures given by the associated eigenvector as
 $\unicode[STIX]{x1D714}_{r}/\unicode[STIX]{x1D6FD}$ – which are
 $-0.097$,
 $-0.084$ and
 $-0.085$ for regions I, II and III, respectively. These speeds are very close to the measured spanwise speed of the head.
The distribution of the imaginary part of the most unstable eigenvalue in the  $\unicode[STIX]{x1D6FC}$–
 $\unicode[STIX]{x1D6FD}$ wavenumber plane. (a), (b) and (c) correspond to the regions I, II and III shown in figure 5(a), respectively. The black line marks the stability boundary.

Spectrum of the most unstable modes correspondng to regions I (blue squares), II (red circles) and III (black triangles). The  $x$-axis shows the real part
 $\unicode[STIX]{x1D714}_{r}$ and the
 $y$-axis shows the imaginary part
 $\unicode[STIX]{x1D714}_{i}$ of the eigenvalues
 $\unicode[STIX]{x1D714}$. The flow is linearly unstable if the imaginary part is located in the region
 $\unicode[STIX]{x1D714}_{i}>0$. The most unstable eigenvalue for region I is labelled by a letter A (the blue square).

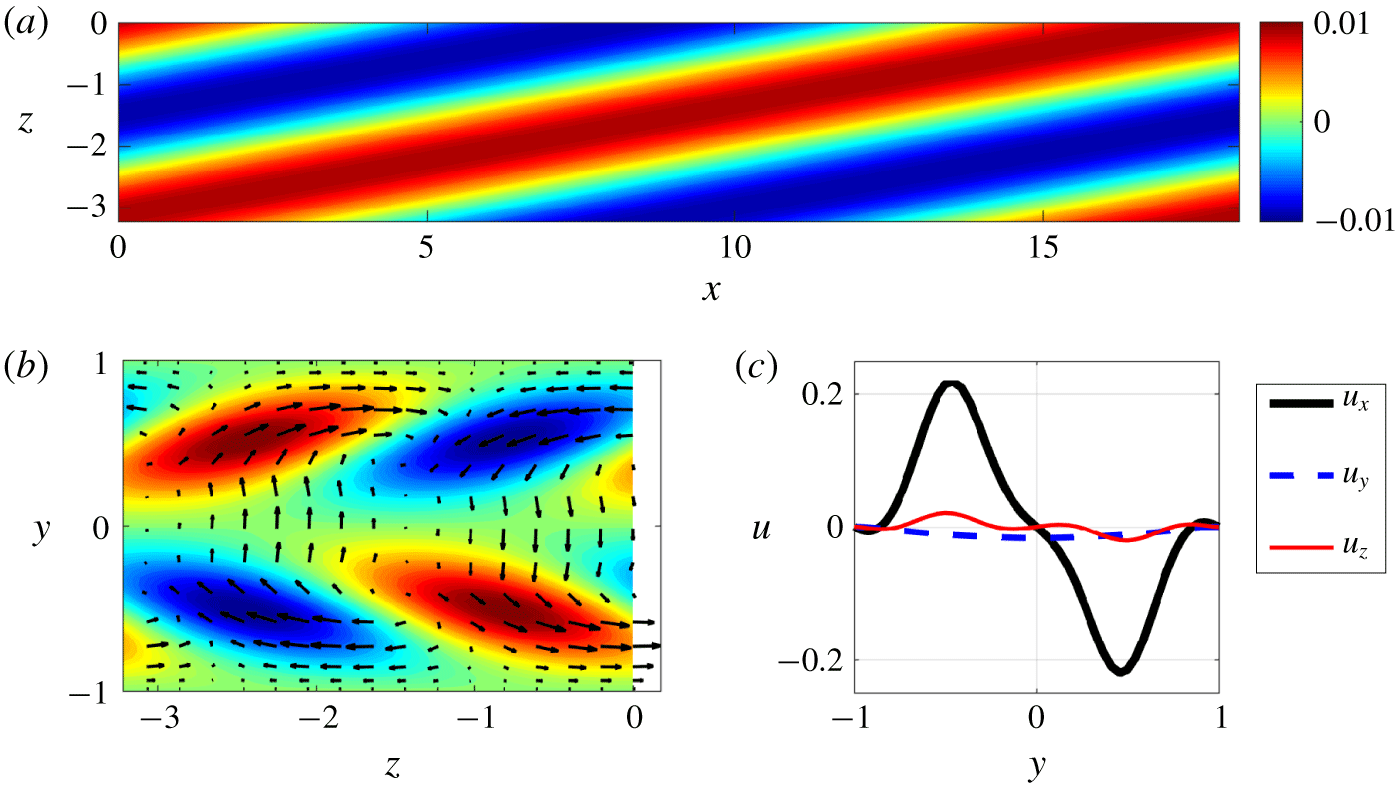
As shown, the instability properties of the three regions are very close. In the following, we show analysis only of region I. Figure 8 visualises the eigenvector associated with the most unstable eigenvalue of the most unstable mode for region I (labelled by a letter A in figure 7). Panel (a) shows the streamwise velocity fluctuation with respect to  $\boldsymbol{U}_{b}$ in the
 $x$–
 $z$ cut plane at
 $y=0.5$, while panel (b) shows the same quantity in the
 $z$–
 $y$ cross-section at
 $x=0$. We can observe a high- and low-velocity streak pattern tilted with respect to the streamwise direction. Panel (c) shows the velocity profiles at position
 $(x,z)=(0,-1)$, which indicates a streak-dominant flow with
 $u_{x}$ being larger by more than an order of magnitude than the other two velocity components.
Visualisation of the most unstable perturbation corresponding to region I, which is at  $(\unicode[STIX]{x1D6FC},\unicode[STIX]{x1D6FD})=(0.34,-1.92)$. (a) Contours of streamwise velocity component (with respect to
 $\boldsymbol{U}_{b}$) in the
 $x$–
 $z$ cut plane at
 $y=-0.5$. (b) Contours of streamwise velocity and in-plane velocity vectors shown in the
 $z$–
 $y$ cross-section at
 $x=0$. (c) Velocity profiles of
 $u_{x}$ (bold black),
 $u_{y}$ (dashed blue) and
 $u_{z}$ (thin red) are plotted at
 $(x,z)=(0,-1)$.

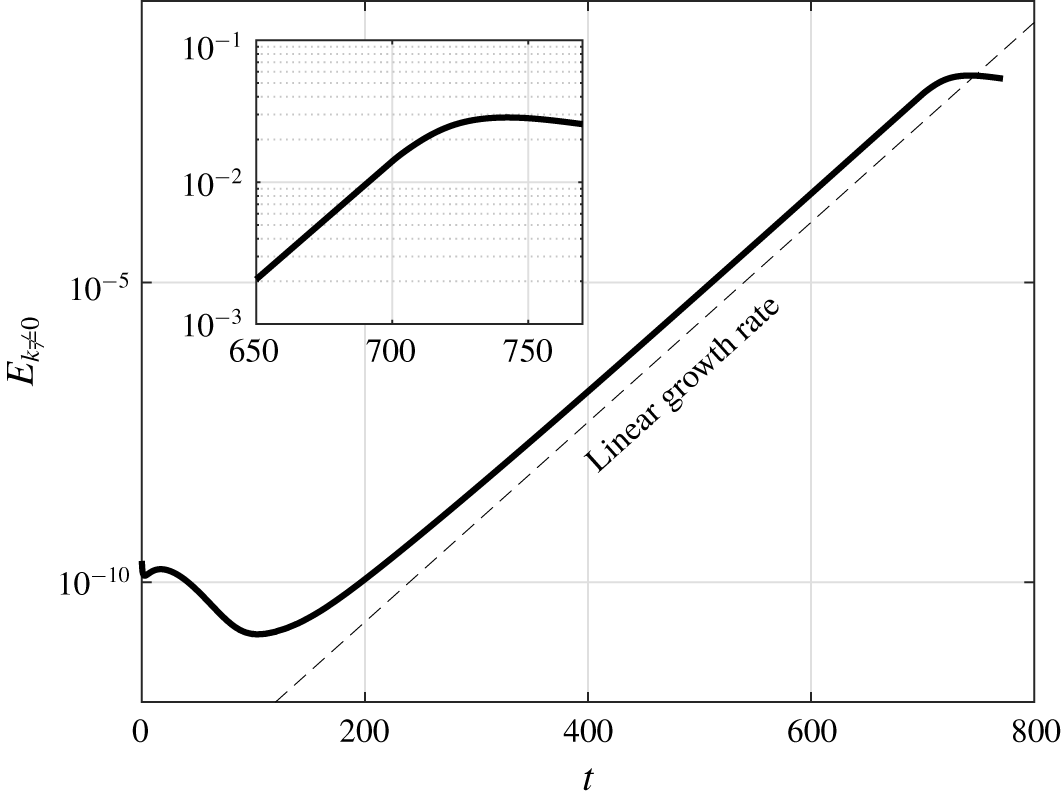
Kinetic energy of the streamwise-dependent part of the perturbation velocity field,  $E_{k\neq 0}$, starting from a base flow averaged in region I (see figure 5a). The initial condition is a noisy field of small amplitude (
 $O(10^{-5})$). The inset shows a close-up of the transition from the linear to the nonlinear regime.

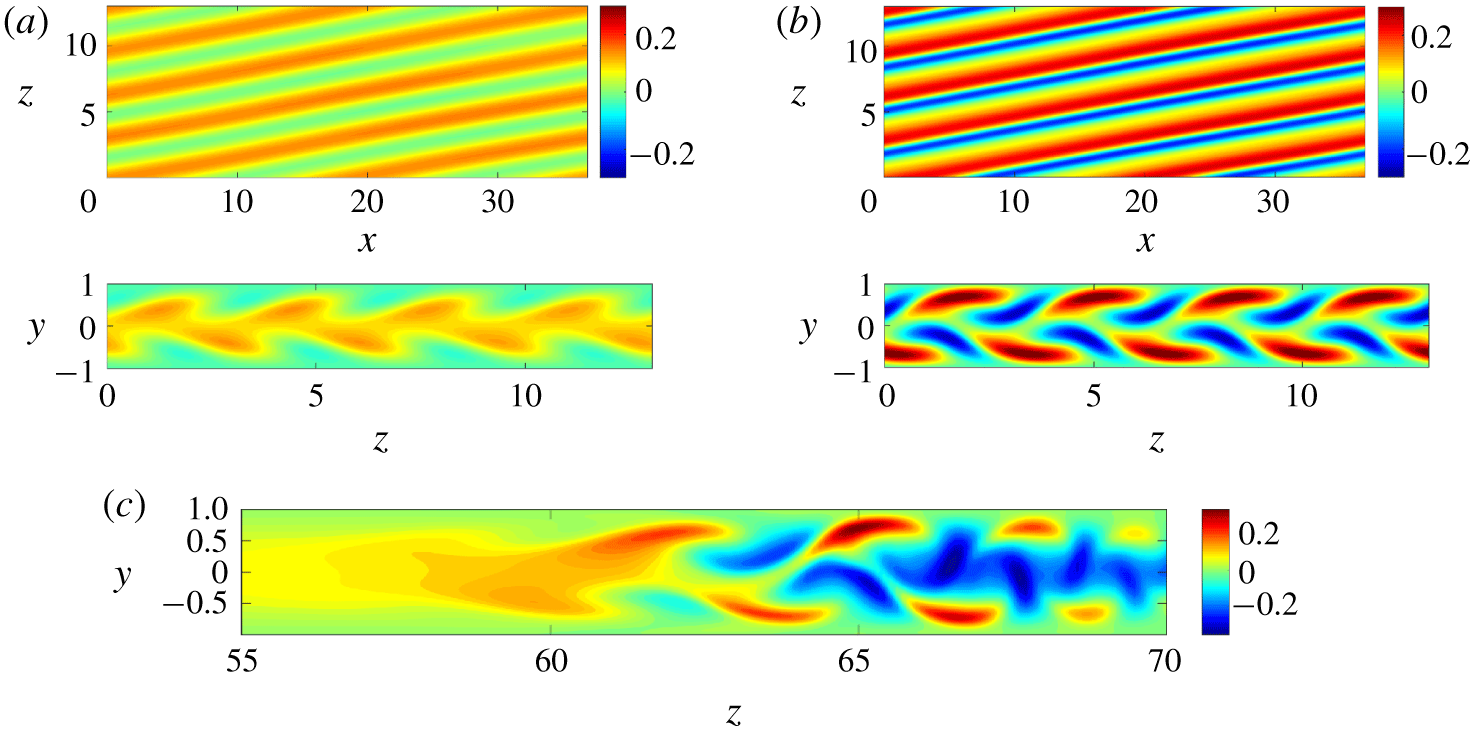
Visualisation of the flow field of the simulation shown in figure 9. (a,b) Flow fields at time instants  $t=650$ and 750 are plotted. The streamwise velocity with respect to the parabola
 $1-y^{2}$ in the
 $x$–
 $z$ cut plane at
 $y=-0.5$ is plotted above and in the
 $z$–
 $y$ cut plane at
 $x=0$ below. (c) Streamwise velocity perturbation with respect to the parabola of the band shown in figure 5(a) in the
 $z$–
 $y$ cut plane at
 $x=57$, which cuts through the head of the band.

The most unstable perturbation, as shown in figure 8, bears some close similarities with the streaky structures in the real turbulent band.
(a) The instability indeed generates a tilted streaky flow pattern. The tilt direction is similar to that of the streaks in the band (see figures 1a and 4), although the tilt angle, which is approximately
 $10^{\circ }$, is smaller than that of the first two streaks at the head, which is approximately $38^{\circ }$.
(b) The spanwise wavenumber of the streaky pattern (1.92; absolute value) is very close to that of the streaks at the head of the band, which is approximately 2.1 and can be estimated later in figure 10(c).
(c) The wave speed in the spanwise direction (
$-0.097$) is very close to the spanwise speed of the head ($-0.1$).


These results suggest that this spanwise instability is responsible for the generation of streaky structures at the head.
3.2.3 Nonlinear development
To further evidence that the streaky structures are generated by this spanwise inflectional instability, we performed DNS of the development of small perturbations given the base flow  $\boldsymbol{U}_{b}$. Here we investigated only region I for the nonlinear analysis. We took the averaged mean velocity profiles in region I as the base flow
 $\boldsymbol{U}_{b}$ (i.e. we imposed forcing in the
 $x$- and
 $z$-directions to produce this base flow), added very small perturbations (
 $O(10^{-5})$) on top, and integrated the Navier–Stokes equations.
The base flow will be nearly unchanged during the linear development of the perturbations. The initial perturbation was obtained by taking a fully turbulent flow field simulated at a higher Reynolds number,  $Re=1500$, and scaling down the velocity fluctuations about the basic parabolic flow by a small factor of
 $10^{-4}$. In this way, we not only perturbed the most unstable mode but also perturbed other modes.
Figure 9 shows the kinetic energy of the streamwise-dependent part of the velocity field,  $E_{k\neq 0}$. After some initial transients, the most unstable perturbation becomes dominant after
 $t=200$, with a growth rate exactly given by our linear stability analysis (marked by the dashed line). The kinetic energy reaches an amplification of nearly
 $10^{8}$ from
 $t=200$ to 700. Later, nonlinearity kicks in and the kinetic energy starts to saturate after
 $t=700$. Figure 10 visualises the flow field near the end of the linear regime at
 $t=650$ (panel a) and at early nonlinear stage at
 $t=750$ (panel b). In comparison, the streamwise velocity of the real turbulent band in the
 $z$–
 $y$ cross-section at
 $x=57$ (see figure 5a), which cuts through the head of the band, is visualised in panel (c). From the comparison, we can see close resemblances between the flow structure in panels (a,b) and between
 $z=60$ and 67 in panel (c): both the pattern of the streaks in the
 $z$–
 $y$ plane and the spanwise wavelength (or wavenumber) are very close.
The linear analysis in § 3.2.2 and the nonlinear simulations indeed evidence the important role that the spanwise inflectional mean flow and the associated instability play in the streak generation at the band head.
4 Discussion and conclusion
Our simulations in large computational domains show that the head of a turbulent band travels into the adjacent laminar flow at a speed of 0.1 and the tail travels in the same direction as the head, and therefore into the band body, at a speed relatively smaller than the head, which is approximately 0.06 in our simulation. Therefore, the band, as a whole, exhibits a slow drift in the spanwise direction at a speed of approximately  $(0.1+0.06)/2=0.08$, which is close to the measurement of Tao et al. (Reference Tao, Eckhardt and Xiong2018) and Shimizu & Manneville (Reference Shimizu and Manneville2018). Visualisation in figure 2 shows that, at the tail, a substantially long patch containing multiple streaky structures decays as a whole continually. Our study also shows that, for DNS, a sufficiently large computational domain and long observation time are necessary to obtain reliable characteristics of a band, such as the speed of the tail and the tilt angle of the band.
A close observation of the head indicates that wave-like streaky structures are continually generated at the head, see figure 4. We can conclude that the head is responsible, at least partially, for the growth and self-sustaining of the turbulent band. This is consistent with Shimizu & Manneville (Reference Shimizu and Manneville2018) and Kanazawa (Reference Kanazawa2018) in that a turbulent band is driven by an active head in this Reynolds number range. Considering the importance of the head, we particularly studied the streak generation mechanism at the head. Our results show that the (temporally and spatially averaged) mean flow at the head is strongly inflectional in the spanwise velocity component. We took the mean velocity profile at the head and carried out linear stability analysis, and indeed found an inflectional instability. The most unstable eigenvector gives a flow field that exhibits remarkable similarities with the streaky flow structure at the head, in terms of wave-like streaky flow pattern, spanwise wavelength (or wavenumber), wave speed and the tilt direction with respect to the streamwise direction. A further DNS study of the linear and nonlinear development of small perturbations also shows close resemblances with the flow pattern at the head of a real turbulent band (see figure 10). Both the linear stability analysis and nonlinear simulation strongly suggest that the mechanism of the streak generation at the head is the spanwise inflectional instability associated with the local mean flow.
Henningson & Alfredsson (Reference Henningson and Alfredsson1987) and Henningson (Reference Henningson1989) proposed a very similar ‘growth by destabilisation’ mechanism for the growth of turbulent spots at higher Reynolds numbers. Dauchaot & Daviaud (Reference Dauchaot and Daviaud1995) also proposed a similar mechanism for the growth of turbulent spots in plane Couette flow. In addition, Hof et al. (Reference Hof, De Lozar, Avila, Tu and Schneider2010) proposed that an inflectional instability at the upstream edge of turbulent puffs is responsible for the turbulence production and therefore the self-sustainment of puffs in pipe flow, although Shimizu & Kida (Reference Shimizu and Kida2009) proposed a different mechanism via Kelvin–Helmholtz instability. Our study here provides more quantitative evidence for the inflectional instability being the underlying mechanism in the case of turbulent bands at low Reynolds numbers. All these studies suggest that this inflectional instability associated with the local mean flow is a rather general mechanism for the growth of localised turbulence in wall-bounded shear flows.
It should be noted that, although our linear analysis captures some key characteristics of the head, it does not quantitatively capture some other characteristics of the waves at the head. For example, the tilt angle of the waves is approximately  $38^{\circ }$, whereas the most unstable mode of our linear instability analysis only shows a tilt angle of approximately
 $10^{\circ }$. Besides, we see a relatively fast growth of streaks (see supplementary movie 1), while the modal growth obtained in our analysis seems to be slow. These deficiencies can probably be attributed to the oversimplification of the linearisation about a temporally and spatially averaged mean flow, during which many aspects of the real flow have been neglected. For example, the counter-clockwise large-scale flow around the head (see the vectors in figure 5a) could potentially contribute to the large tilt angle of the streaks at the head. Clearly this effect cannot be accounted for in our simplified analysis. A more rigorous stability analysis taking into account the temporal and spatial dependence of the mean flow is needed to more quantitatively capture all these characteristics.
Based on our analysis, we propose a self-sustaining mechanism of fully localised turbulent bands at low Reynolds numbers, which is similar to the self-sustaining mechanism of the wing tips of turbulent spots proposed by Henningson (Reference Henningson1989): spanwise inflectional instability generates streaks, which are quickly amplified and become turbulent and move away from the head (towards the tail; see supplementary movie 1). The streak generation rate is higher than the decay rate of streaks at the tail; therefore, the band can achieve transverse growth. In turn, the band maintains a large-scale flow around the band (via a similar mechanism to that described by Duguet & Schlatter (Reference Duguet and Schlatter2013)), which bears a spanwise inflectional instability at the head of the band. A noticeable difference with respect to the spot case is that streaks generated at the head largely maintain a travelling wave form with relatively weak turbulent fluctuations while travelling within the bulk of the band (see the flow pattern in figures 1(a), 2 and supplementary movie 1).
However, it has been shown that turbulent bands can be sustained either in a small tilted domain (Tuckerman et al. Reference Tuckerman, Kreilos, Shrobsdorff, Schneider and Gibson2014) or even in large domains (Tao et al. Reference Tao, Eckhardt and Xiong2018) if the band is periodic and no head and tail exist. Further study is needed to elucidate how streaks in the bulk of the band sustain themselves and maintain a travelling wave-like form with turbulent fluctuations on top. For plane Couette flow, Rolland (Reference Rolland2015) and Rolland (Reference Rolland2016) investigated the sustaining mechanism of the turbulent streaks within turbulent bands and spots, and concluded that the shear layers inside the velocity streaks generate vorticity and are responsible for the self-sustainment of the turbulent streaks. Duguet & Schlatter (Reference Duguet and Schlatter2013) described the motion of the streaks inside turbulent bands in plane Couette flow as the advection of small-scale structures by the large-scale flow. It would be interesting to investigate the case in channel flow following their analysis. Another open question regards what mechanism determines the tilt angle of the band. We speculate that the wave speed of the waves generated at the head, with respect to the convection speed of the bulk of the band, may give a hint to the answer.
Acknowledgements
We acknowledge financial support from the National Natural Science Foundation of China under grant number 91852105 and from Tianjin University under grant number 2018XZ-0006. We acknowledge the computing resources from National Supercomputer Center in Guangzhou. Helpful discussions with J. Tao, D. Barkley and A. P. Willis are highly appreciated. We also thank the anonymous reviewers for their very constructive comments.
Declaration of interests
The authors report no conflict of interest.
Supplementary movies
Supplementary movies are available at https://doi.org/10.1017/jfm.2019.899.