

Food and [millet] beer are without doubt the most exciting and interesting topics of native conversation [among the Bemba of Northern Rhodesia]… Any one who can follow the ordinary gossip of a Bemba village will be struck at once by the endless talk shouted from hut to hut as to what is about to be eaten, what has already been eaten, and what lies in store for the future, and this with an animation and a wealth of detail which would be thought quite unusual in this country [Great Britain]. It is, of course, natural in an area where the supply is never constant from day to day that the daily meal should be a subject of vivid interest. For those who are accustomed to buy food ready prepared, it is difficult to realize the emotional attitudes to foodstuffs among peoples who are directly dependent on their environment for their diet. Most of their food the Bemba grow, and hence they view their fields and gardens concretely in terms of their future prospects of food and drink. These they constantly discuss. I timed two old women talking over an hour on the single topic of the probable order of ripening of the pumpkins in three gardens, and the way in which they were likely to be distributed. The question evidently dominated their imagination…
These casual observations of native life are significant. For us it requires a real effort of imagination to visualize a state of society in which food matters so much and from so many points of view, but this effort is necessary if we are to understand the emotional background of Bemba ideas as to diet.
Traditional farming – farming in the absence of fossil fuels, electricity, commercial seed, tractors and combines and other industrial inputs such as inorganic fertilizers, pesticides and herbicides – has sustained much of the human species for ten millennia. And not just sustained: the global emergence of farming led to a thousand-fold increase in the size of the human population by the beginning of the Industrial Revolution in the late eighteenth century (Cohen, Reference Cohen1995: 96). Traditional farming provided the foundation for early civilizations, cities and states, all of which evolved along with it. By some estimates, traditional farming or something very like it was still feeding a third of the world’s people in the second half of the twentieth century (Haswell, Reference Haswell1973).
In preindustrial societies, even those with towns and cities, almost everyone belonged to a farming household. In sixteenth-century England, for example, when London and several other urban areas were already flourishing, an estimated 80 percent of households were rural and more or less directly involved in farming (Wrigley, Reference Wrigley1988: 12–13). No matter how surviving written records may distort the reality, human history since the origins of agriculture has, until quite recently, been predominantly the history of traditional farmers and the food they produced, and only secondarily the nonfarming people who ate some of it. Elizabeth I, Cardinal Richelieu, Moctezuma and the Mughal Emperors could only ever have been two or three degrees of separation from a poor dirt farmer, and a few weeks away from starvation.
Throughout most of its history, traditional farming has yielded what present-day agricultural scientists would regard as pitifully small quantities of food each year.Footnote 1 Most of that food was eaten locally – indeed most of it was eaten by the family that produced it. In other words, traditional farming has often operated near the margin of subsistence. This has been true even where farmers were able, in a good year, to set aside some produce for sale at the local market. The fact that past agrarian societies were made up overwhelmingly of farming families is an indication of the inability of traditional farming to generate a sufficiently large and reliable surplus of food to support a substantial nonagricultural population. Life near the margin meant that even small changes in the food supply could translate into comparatively large changes in health, survival, productive capacity and the ability to raise a family. Thus, the demographic fate of our farming ancestors was hostage to food systems that many people today would consider obsolete and worthy only of “development.” That is no reason to fault traditional farmers – they did what they could, with very limited resources at their disposal, against an environment that could be by turns both obdurate and capricious. Their efforts might even be viewed as heroic.
This book is about the manifold linkages between farming and human population in the preindustrial world. It draws upon evidence, recent and historical, from all parts of the world where traditional agriculture has existed in recent centuries – and in some places still exists, if only in modified form. It continues and enlarges a debate (discussed in the next section) originally framed by Thomas Robert Malthus more than two centuries ago, at about the time that modern farming was taking its first fumbling steps. Malthus bequeathed the debate to classical economics, where it played a central role until it was pushed aside by the rise of new economic doctrines late in the nineteenth century. Malthus also injected the debate into the new field of population science, although it remained a secondary concern at a time when purely methodological advances necessarily dominated the discipline. (But recall that one important population scientist, Charles Darwin, was by his own account deeply swayed by Malthus’s theoretical arguments.) In the mid-twentieth century the debate caught fire again, largely under the influence of the economist Ester Boserup, who aimed to stand Malthus on his head. Boserup’s ideas provided the basis for innumerable writings in anthropology, especially archaeology, placing the interaction of population and traditional agriculture at the center of arguments concerning not only the evolution of farming systems but also that of preindustrial economies and political systems in general. And the fire was stoked (often to the point of over-heating) by ecologists concerned with the “population bomb,” some of whom formulated a kind of über-neomalthusianism that had little to do with what Malthus actually believed. Although the debate has lost some of its fervor in recent years, it remains important in such fields as economic demography, historical demography, economic anthropology, agricultural economics and geography, development economics and human ecology.
The Classic Debate
The details of the classic debate over population and agriculture will be presented in Chapters 5 and 6, and we need only sketch a brief outline of it here. Malthus believed that the size of a population, and its tendency to grow or decline, was determined by its food supply. Therefore, any increase in food supply resulting from improvements in agricultural practice would inevitably (in the absence of deliberate “preventive checks” on fertility) lead to population growth, which in the short term could be quite rapid.Footnote 2 This rapid increase in the number of people to be fed would quickly consume any temporary surplus generated by the new methods of farming, and population size would equilibrate at the level just allowed by the new farming system and the population’s minimal nutritional requirements for sustaining itself. In this scheme, the food supply is the “independent variable” or driving force for demographic change. For Boserup, in contrast, food supply is quite elastic under any form of farming, and changes in population size or density are the primary force determining the level of food production: “population growth is here regarded as the independent variable which in its turn is a major factor determining agricultural developments” (Boserup, Reference Boserup1965: 11). Although Boserup recognized that there were many different ways preindustrial farmers could increase their food supply in response to population growth, she emphasized only one of them: how long arable land was allowed to lie fallow after a continuous period of cultivation. It is important to note that Boserup explicitly treated population size or density as an exogenous variable and was not much interested in why it might change. It just does – or doesn’t, as the case may be. All this, in Boserup’s own opinion, made her an anti-Malthusian.
Not surprisingly, the actual debate turns out to be more complicated, especially once the contributions of other, more recent writers are taken into account (see Chapter 6). But most participants still adopt a position that is recognizably either “Malthusian” or “Boserupian.” Only fairly recently have several authors suggested that Malthus and Boserup may not be as incompatible as we have thought (see Pryor and Maurer, Reference Pryor and Maurer1982; Lee, Reference Lee, Coleman and Schofield1986; Turner and Ali, Reference Turner and Ali1996; Wood, Reference Wood1998).
As I say, the debate has lost some of its fervor – but not because it has been settled. Instead, I will argue that the debate has languished mainly because it has been dominated by inappropriate or incomplete methods, models and scales of analysis, not because we know which side won. To go even further, the very fact that the debate has crystallized into two diametrically opposed “sides” has itself impeded understanding of the underlying issues. In later chapters, I will provide a detailed discussion of the classic debate as it stood at the beginning of the twenty-first century, but most of this book will involve an attempt to transcend the limitations of the debate or at least to reframe its basic terms so that we can better understand what the important questions are.
An Empirical Example
To convey something of the current state of the debate – and some of the problems with the way it has been structured – it is useful to look at some empirical results from a major survey of traditional farming in the southwest Pacific nation of Papua New Guinea (Bourke et al., Reference Bourke, Allen, Hobsbawn and Conway1998; Allen, Reference Allen2001; Bourke, Reference Bourke2001). I choose this example, not because it is egregious and thus an easy target, but precisely because it represents one of the best empirical studies done to date on this subject. Between 1990 and 1995 a group of geographers at the Australian National University developed a geographical information database known as the Mapping Agricultural Systems in Papua New Guinea Project (MASP). Local agricultural “systems” (the basic map units) were defined based on field data concerning six variables (Allen, Reference Allen2001: 239):
the type of fallow vegetation established on fields just before clearing for cultivation
the length of the fallow period
the principal staple crops
the spatial arrangement of crops within and between cultivated fields
techniques other than fallowing used to maintain soil fertility.
These data were linked in a GIS to demographic information from the 1980 national census and to other data sources (for technical details, see Bourke et al., Reference Bourke, Allen, Hobsbawn and Conway1998). A total of 274 local systems were mapped, a remarkable achievement under trying field conditions.
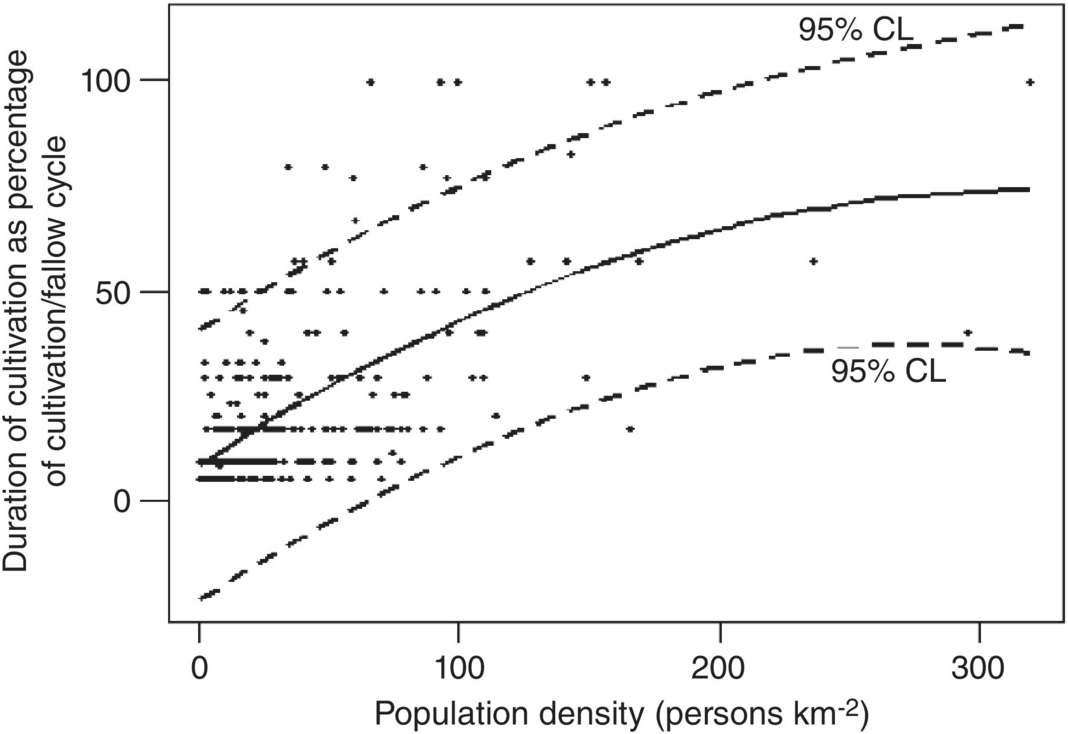
Results from the MASP project that are most pertinent to the classic debate about population and agriculture are shown in Figure 1.1, which plots Boserup’s preferred measure of agricultural “intensity” (intended to reflect the magnitude of nonland inputs into the farming system) against local population density for all 274 mapped locations. Despite considerable scatter in the data, Allen (Reference Allen2001) concludes that there is a significant, nonlinear relationship between the two. Since population density is plotted on the x-axis, the implication is that population density is the independent variable driving differences in agricultural intensity, just as Boserup believed. So much for Malthus.
Agricultural intensity by population density, 274 local farming systems in Papua New Guinea, c. 1990–5. Agricultural intensity is estimated as the number of years the average field is continuously cropped as a percentage of the length of the total cropping/fallow cycle. Solid curve is a quadratic equation fit by OLS regression. CL, confidence limit.

There are various problems of a purely statistical nature with this analysis, which its author readily acknowledges.Footnote 3 But there are deeper conceptual problems that are at least as important. First, do the two variables actually measure what they are supposed to measure? Population density is notoriously difficult to interpret. The quantity used here appears to be “gross” population density, the ratio of standing population to the area of all land that “belongs” to the farming community in question. As such, the denominator includes not only active and potential arable, but areas uncultivable because of high slopes, poor soils, waterlogging, rocky outcrops and so forth – or because they are taken up by house sites, ceremonial grounds or other nonagricultural features. Surely the different locales vary in the proportion of their territory consisting of such nonarable land. Population density is presumably intended as a proxy measure of what Boserup called “population pressure,” itself a slippery concept discussed in Chapter 3. But surely the amount of “pressure” that a population exerts upon the land that feeds it is influenced in profound ways by elements of the physical environment (elevation, rainfall, temperature, slopes, soils, etc.). Rich environments can arguably support more people without undue “pressure” than poor ones. Despite the fact that Papua New Guinea encompasses an enormous range of local environments, there is no statistical adjustment for that variation in Figure 1.1. And it is likely that there are many other unobserved variables whose potential confounding effects have not been controlled.
Similarly, cropping frequency is a problematic measurement of “agricultural intensity” (another slippery concept). The meaning of agricultural intensity will receive considerable attention in later chapters. For now it is enough to say that it reflects the magnitude of nonland inputs (labor or capital) into food production designed to increase or at least maintain crop yields per hectare of cultivable land. Cropping frequency at best tells us something about the amount of potentially cultivable land that is actively devoted to farming in a given year, but nothing about other possible inputs such as mulching, manuring, irrigation, drainage, soil preparation, weeding and other widespread traditional farming practices.Footnote 4 And note that the measure of intensity used in Figure 1.1 cannot exceed 100 percent, corresponding to permanent cultivation; it therefore cannot distinguish farming systems in which each field yields one crop per year from more intensive multicropping systems.
There is an even deeper problem with this analysis. Even if the data were sufficient to convince us of a close causal relationship between population density and agricultural intensity, they tell us nothing about the direction of causation. If we were to switch the x- and y-axes in Figure 1.1, we might conclude that the level of agricultural intensity determines population density – that is, that the food supply is the main factor determining population size or density, just as Malthus believed. So much for Boserup.
There are other conceptual problems. Both Malthus and Boserup talk of changes over time within populations. Their predictions are thus inherently dynamic and should be tested against longitudinal data. As remarkable as the MASP dataset is, it is still a cross-sectional snapshot of the situation in Papua New Guinea as it existed in the early 1990s. It is at least imaginable that (for example) the one farming system represented by the point at x > 300 and y = 100 could have, if followed prospectively for several decades, headed toward the southeast, contrary to both Malthus and Boserup. Given the lack of control for environmental variation and non-fallow methods of intensification, any number of single-system dynamic trajectories could have been observed, some consistent with existing theory, some not.
The foregoing difficulty points to the final problem with this analysis, something statisticians call the ecological fallacy. The ecological fallacy can occur whenever we try to draw causal inferences from data reported at a level of spatial aggregation higher than the level at which the actual causal processes are occurring – as when we try to understand the behavior of individuals by analyzing the behavior of crowds. The classic example of an ecological fallacy was a study of the epidemiology of tuberculosis conducted in the 1930s using data aggregated at the level of US states (Cowles and Chapman, Reference Cowles and Chapman1935). Each state’s mortality rate from tuberculosis was analyzed in terms of several purported explanatory variables, all of which were statewide characteristics or averages. One finding considered especially important at the time was that the state’s average altitude and hours of sunshine each year were negatively correlated with statewide tuberculosis death rates, suggesting that patients ought to be moved to mountainous regions in sunny climes. Unfortunately for people who rushed to build sanatoriums in the “right” locales, when the study was redone years later using data on individual patients the apparent beneficial effects of altitude and sunshine disappeared (Morgenstern, Reference Morgenstern1982). The state as a whole, it turns out, is just too far above the pathologic processes operating in the infected individual for meaningful results to be derived.Footnote 5
The data in Figure 1.1 are presented and analyzed at the level of the “farming system” (Allen, Reference Allen2001). We are not told how big a “system” is, but it seems to be a regional community sharing a fairly homogeneous set of farming practices. But regions aren’t cropped and then allowed to lie fallow – individual fields are. And in the absence of a clearer understanding of what we mean by “population pressure,” it difficult to know whether its effects play out at the regional level or at the level of the individual farm. How do we decide at which scale to pitch our analysis? In the absence of a clear answer, it’s almost always best to disaggregate. We can always reaggregate our observations later if we wish to.
Rethinking the Relationship between Human Population and Traditional Agriculture
What kinds of questions do we want to ask about the relationship between a system of agriculture and the characteristics of the population it feeds – the population’s size, density, growth rate, age structure, fertility and mortality levels, migration patterns and so forth? If the goal is to move beyond the conventional debate, the following questions would seem to need answering first.
Is the Relationship Simple or Complicated?
Despite their disagreements, both Malthus and Boserup (and their respective supporters) make the linkage sound simple and straightforward. But there may in fact be multiple linkages at many different spatial and temporal scales, not all of which linkages operate in the same direction or with the same intensity. One problem in reframing the issue is to identify all the important linkages, while recognizing that there may be a practically unlimited number of unimportant ones – a nice sense of judgment is needed. One failure of the current debate on population and traditional farming is, I would argue, that some of the important linkages have been ignored.
Is the Relationship Unidirectional or Reciprocal?
Food supply and population size may be positively correlated, but does food supply determine population size, or does an increase in population size induce increases in food supply – or both? Malthus and Boserup preferred unidirectional linkages.Footnote 6 I can think of no a priori reason to reject reciprocal relationships. Could Malthus and Boserup both have been right?
What are the Precise Mechanisms Underlying the Relationship?
This is the crucial question. If food supply is to influence population, it must do so through at least one of the basic “forces” of population change – fertility, mortality or migration.Footnote 7 It is startling, then, to realize the extent to which these essential demographic processes have been ignored in the recent debate regarding the linkage between population and agriculture. A population can be growing at a certain rate (for example) because it has low mortality and modestly high fertility or because it has high mortality and very high fertility, two scenarios that imply rather different things about dietary sufficiency and its effects on mortality or fertility. By the same token, if population is to influence agriculture, it must do so through at least one of the physical, temporal or spatial components of the agricultural process – the allocation of land, labor and other scarce resources, the use of manures, soil tillage, the choice of crops, the scheduling of sowing and so on (see Chapter 2). Again, the classic debate has mostly ignored all details of agricultural practice except the one emphasized by Boserup: the length of time a particular piece of land is actively and continuously cropped relative to the time it lies fallow. But there may be no predictable relationship between population density and the length of the cropping/fallow cycle if all fields are well manured. By identifying and linking specific demographic and agricultural mechanisms, we stand to gain greater insight into the relationship between population and farming.
At what Scale or Scales do the Mechanisms Operate?
This question, too, is crucial. As far as spatial scale is concerned, most discussions of the relationship have been restricted to quite aggregated levels of analysis – chiefly the level of an entire population, community or region, however defined. Only more recently have population scientists investigated less aggregated scales – e.g. the individual farmer, the household, the group of kinfolk who regularly combine to share food and work. There is, of course, no one universally correct scale for all analyses – it depends on the question being asked. Questions about environmental degradation may best be studied at a regional scale, those concerning agricultural decision-making at the household scale. The same holds true of temporal scale. The relationship between population and agriculture can be studied over months, years, decades, centuries or millennia, and indeed has been studied profitably at all these scales. But we cannot hope to cover all scales, spatial or temporal, in a book of reasonable length. Careful decisions must be made.
At high levels of spatial aggregation the risk of committing the ecological fallacy becomes great, especially if the most important causal linkages are operating at lower scales of aggregation. For this reason, the whole debate needs to be disaggregated. Throughout this book, I will emphasize the farming household and its farm as the most important (but not the only) scale at which both food production and consumption are managed and demographic decisions and outcomes occur.Footnote 8 But we need to be careful here, for no household in the preindustrial world is absolutely autonomous when it comes to food. For example, extra-household work groups are ubiquitous in traditional farming, although they tend to be small, transitory and focused on specific tasks (see Chapter 12). They also tend to be made up of people who are closely related to (and living near) whatever household is organizing them. And, of course, food-sharing networks that span multiple households are also universal (Chapter 12). In addition, households are not internally undifferentiated. Peter Laslett (Reference Laslett, Netting, Wilk and Arnould1984: 353) has famously called the household “a knot of individual interests.” Insofar as the household members have a stake in the success of the household, they have overlapping interests. But in general they do not have identical interests – a point emphasized in the recent literature on the behavioral ecology of the family (Mock, Reference Mock2004; Forbes, Reference Forbes2005). Not all members are treated the same: females are often at a disadvantage when it comes to food distribution, sons preferred over daughters, and elder sons preferred over younger ones (Barlett, Reference Barlett and Wilk1980c; Wilk, Reference Wilk and Wilk1989a, Reference Wilkb). As Maclachlan has observed in rural south India, the management of household labor may sometimes involve an element of coercion (Reference Maclachlan1983: 108 ff.) – especially when it comes to getting adolescent and unmarried adult sons to do their customary share of the work. Nonetheless, it has been acknowledged by researchers in a wide variety of disciplines that, in every known traditional agrarian society, the household has a unique status as the most important unit within which farm management decisions are made, day-to-day farm work organized and food resources pooled (Netting, Reference Netting1993: ad passim; see also Hill, Reference Hill1982; Fricke, Reference Fricke1984; Netting et al., Reference Netting, Wilk and Arnould1984; Haswell and Hunt, Reference Haswell and Hunt1991; Wilk, Reference Wilk1991; Ellis, Reference Ellis1993, among many other possible references). The historical demographer John Hajnal (Reference Hajnal1982) has even suggested that household membership in the rural preindustrial world can be defined in terms of regularly shared food – a une vino e uno pane, as one medieval Tuscan tax roll put it (Klapisch and Demonet, Reference Klapisch and Demonet1972).
I suggest, then, that the traditional farming household, along with the farm it runs, is the most salient scale – I am tempted to say the most natural scale – at which to begin investigating the interactions of demography and food production. This does not mean that other scales are irrelevant; they are not. But the most localized scale would seem to be the right place to start identifying causal mechanisms.
In order to understand the current debate over population and farming (if only to loosen its conceptual grip), we will need to spend some time at the aggregate-, macro-demographic- or population-level of analysis; this we shall do in Chapters 4–6. But most of the rest of the book will be devoted to investigating how the questions change – along with the possible answers – when the scale of analysis is shifted to the household, its members and its farm. In the final chapter we will return to levels above the household, albeit not very far above the household.
Why Study Traditional Farmers?
At this stage an impertinent question may have occurred to some readers: if the debate about the relationship between agriculture and demography is a general one, why focus on traditional farming, which appears to be headed for extinction? Why not devote our attention solely to modern, industrialized farming, so utterly different in scale and productivity from preindustrial systems, so obviously (for better or worse) the way of the future? One honest answer that satisfies me but will not move many readers is that I have studied the demography and population biology of traditional, preindustrial farmers for the past 40 years, in both the field and the archive, and I think I have something to say about them. But there are at least three more general (and perhaps more generally satisfying) answers.
First, modern farming – depending of course on how you define it – has existed for, at most, about two centuries. Truly industrialized farming is even newer: a convenient starting date might be 1909, when Fritz Haber first demonstrated his method of fixing atmospheric nitrogen as ammonia for use in inorganic fertilizers.Footnote 9 In profound contrast, traditional agriculture has survived for more than ten thousand years in some parts of the world (Barker, Reference Barker2006), an accomplishment that should not be gainsaid. If one wishes to understand the demographic dynamics of historical populations (and many prehistoric ones as well), traditional farming is the right place to start.
Second, if you are interested in economic development and wish to help transform the remaining vestiges of traditional agriculture, you need to know something about the initial conditions of the whole transformation (see, e.g., Schultz, Reference Schultz1964; Wharton, Reference Wharton1969). This is precisely why Boserup first became interested in traditional agriculture.
Third – and, I would argue, most importantly from a theoretical point of view – if you want to understand the general linkages between agriculture and population processes, traditional farming is a good place to start because, in comparison to what is found in modern, industrial farming, those linkages are simple, strong and direct. As will be emphasized later in this chapter, traditional farming depends almost entirely on local, biological sources of nonsolar energy (i.e. humans and sometimes animals), fertilizers (animal manures, green manures, etc.) and genetic resources (so-called landraces or local varieties of crops and livestock). Modern commercial farming, in contrast, is subsidized by vast, mostly nonlocal, industrial operations fed by fossil fuels. The physical and spatial limits of these two types of production could scarcely be more different. Modern agriculture relies upon the whole national economy and much of the rest of the world; traditional agriculture does not – indeed, cannot, for long-distance transport of food is too energetically costly and its infrastructure too under-developed to be economical (see below). As archaeologists can attest, longer-distance trade in the past mostly involved small, lightweight, imperishable items of high value – perhaps jade carvings or ceremonial bronze axe heads – not staple foods.
Because of high bulk transport costs – as well as the limited capacity to preserve food in the absence of refrigerated transport – food distribution is almost always extremely localized under preindustrial conditions. As a consequence, it is easier to link a traditional farming system to the population it feeds than is the case in modern commercial agriculture. Today it is possible for an orange grown in the Levant to be eaten by someone in Nova Scotia, even though the grower and the eater are very unlikely to have any other form of relationship. The “population” served by the Levantine orange grower is, potentially, the entire world. Food produced by many traditional farming systems, in stark contrast, may not go beyond the farm itself and, if it does, will rarely go far, and it will be conveyed mostly by an intimate network of kinsmen and neighbors (Richards, Reference Richards1939: 154–71; Sillitoe, Reference Sillitoe1983: 256–8).
In addition, many of the potential linkages between agriculture and demography have to do with the influence of dietary inadequacy on fertility or mortality (see Chapter 8). In most modern farming systems, those linkages have been loosened or even severed by the widespread use of effective contraceptives and the comparatively easy availability of modern medical care and public health services. Thus, many of the potential causal mechanisms linking demography and food supply are too attenuated to be studied easily in modern industrial populations.
Can Traditional Farmers Save the World?
It has been suggested that there is another reason to study traditional farmers – to save ourselves (see, for example, Altieri, Reference Altieri, Carroll and Vandermeer1990). In recent years, many researchers in the agricultural sciences have argued that one of the surest ways to promote sustainability (whatever that means) in our own farming industry is to adopt methods used in traditional farming, which, by virtue of the fact that it has been around for thousands of years, must be sustainable. And even if traditional systems are not literally sustainable, it is clear that they generally do less damage to local ecosystems than modern farming does, precisely because (the supporters of this point of view argue) traditional farmers have ecologically minded practices and spiritual beliefs that discourage such damage. This line of reasoning has inspired some fine recent studies of traditional farming (for useful reviews, see Brookfield, Reference Brookfield2001a; Cairns, Reference Cairns2007; Gliessman, Reference Gliessman2007; Scherr and McNeely, Reference Scheer and McNeely2007). But it is, I believe, based on questionable assumptions – even setting aside the likelihood that traditional farming practices would never be able to feed a global population that has now exceeded seven billion people. If it is in fact the case that many preindustrial farming communities are environmentally nondestructive (and clearly some are, at least compared to industrial farming), we have to ask whether it is because of their specific agricultural practices and beliefs, or because they are unable to be destructive. As the anthropologist Allen Johnson once remarked:
Ironically enough, although my own field experience convinces me that in many ways the Machiguenga [shifting cultivators living on the eastern Amazonian slope of the Andes in Peru] do feel a ‘oneness with nature,’ hold a ‘mystical world view,’ and by virtue of their materially simple life are less ‘alienated’ (in some sense; I agree the term is vague) than we affluent moderns, I nonetheless find the Machiguenga to be more alike than distinct from us when it comes to resource management. Their relatively small destructive impact on the environment results less from an ideology of protective oneness than from a low population density [c. 0.3 persons km–2], a scattered population, and an individualistic, family-centered technology that makes it impossible for them to devastate any particular resources. Since their population density is low relative to resources mainly for historical reasons related to the depopulation of native Americans following contact with conquering Europeans, I will argue that it is essentially an historical accident that they have not yet expanded their population and methods of exploitation to produce either severe environmental degradation or a cultural emphasis on the protective management of resources to prevent such degradation.
Whether or not one believes that post-Columbian depopulation is the cause of the Machiguenga’s current low population density, Johnson’s point is a good one: many preindustrial populations live in rough balance with nature because they do not have the strength to upset the balance. I recall, the first time I did fieldwork in a (then) remote part of highland Papua New Guinea (PNG), being rather shocked at the proposals of a group of local men who were debating the best way to become rich. As it happens one of the men had been to Port Moresby, the nation’s capital city. Port Moresby is located in PNG’s only pocket of savannah grassland and has comparatively few trees; Port Moresby is also, by my local informants’ standards, almost unimaginably wealthy – it has paved roads, lots of motor vehicles, multistory buildings, and markets with wondrous manufactured goods that were not available locally. To the man who had seen Port Moresby, the surest path to wealth was obvious: they needed to chop down all their trees so the local environment would be more like Port Moresby’s. No one in the group suggested that this was inherently a bad idea, but there was general agreement, and considerable regret, that they would never be able to muster enough manpower to effect the desired deforestation.
My own view of the advisability of emulating traditional farmers is captured rather nicely by Gene Wilken, an agricultural geographer with years of experience with, and great respect for, the traditional farmers of Mesoamerica:
Some traditional systems have enviable resource conservation records, others do not. But those that have maintained or enhanced the resource base over time merit examination. These successful experiments by generations of farmers in particular places constitute valuable lessons that should not be ignored or lost.
But before our enthusiasm for centuries-old systems outruns the record, we should note the failures. It is also condescending to view traditional farmers as sagacious husbandmen, imbued with infallible folk wisdom, in mystic harmony with the environment. In fact, they share with their industrialized counterparts the human propensities to respond to short-term opportunities while disregarding long-term costs, to misinterpret the durability and flexibility of agroecosystems, and generally to err. The many past and present examples of depleted resources and degraded landscapes attest to the potential for traditional mismanagement. But failure is part of the agricultural experience and has as much to teach, in its own way, as success.
In this book I shall not make the assumption that traditional farming practices are necessarily environmentally friendly and geared toward long-term sustainability or resource conservation. To do so would bias our enquiry from the outset by taking for granted a demographic stability that may or may not exist in any particular case. Certainly, traditional farmers manage their resources – a fact that will be emphasized in Chapter 2 – but do they do so with an eye on long-term sustainability and conservation or on short-term economic advantage? I would argue that traditional farmers are usually short-termers, even if their practices do end up having (unintended) consequences for the longer term. I would also argue that some degree of environmental degradation is common under traditional farming and may even act as an important driver of both agricultural and demographic change (see Chapters 3 and 6).
Some Important Differences between Traditional and Industrial Farming
Obviously traditional and modern farming differ in a myriad of ways. There is, of course, an historical continuum linking the two, but on the time scale of farming in general it was brief, perhaps 200 years out of ten millennia or so.Footnote 10 In this section I ignore the continuum and contrast preindustrial farming with its fully developed modern industrial counterpart in order to identify the differences that are most consequential for the rest of this book.
One obvious difference has already been noted: industrial farming is underwritten by bank loans, cheap fossil fuel (much of it from other countries) and an enormous manufacturing sector providing tractors, harvesters and other tools and machinery, fertilizers of whatever chemical composition is required, carefully targeted herbicides and pesticides and seed bred according to Mendelian principles or produced through genetic engineering. The only local resources of any importance are water, soil and human labor – and the water may be pumped in from elsewhere, the soil heavily modified by industrial fertilizer and mechanized tillage and the input of human labor laughably small by preindustrial standards (if appalling by our own). Traditional farming, in stark contrast, depends upon “natural” sources of energy that are produced locally, usually on the farm that uses them. Thus, both human workers and draft animals (if the latter are used) are mostly raised and fed on the farm where they work. Other inputs, such as manure and seed stock, are also local and themselves usually come from the farm that applies them.Footnote 11 Tools are simple and are manufactured either by the farmers themselves or by a local blacksmith, if such a person exists.
There are several important implications of these differences. First, there are major differences between industrial and preindustrial farmers in the sheer amount of energy they can channel into food production (not counting, of course, solar energy, converted into storable chemical energy by photosynthesis).
Power in traditional farming comes mostly from humans and animals fueled by foods produced on the farm or in the local community… Compared with even small fossil fuel devices, human and animal power appears puny indeed… The limited power of individual humans or animals is often insufficient for tasks that involve substantial mass transfers or tight schedules.
As we shall see in later chapters, this “puniness” is of profound importance in understanding the biological constraints on the household labor force, the need to allocate labor judiciously, the inability of the household to undertake large bulk transfers of soil or other materials on its own and the need for inter-household cooperation on tasks that must be done quickly. Above all, it accounts for the common observation that subsistence farmers try to invest energy efficiently and rest at every opportunity (see Chapter 9). To put the energy limits in more quantitative terms:
Human work is slow because the body has poor energetic performance. The human body can convert around 25% of dietary energy to mechanical energy as physical work and most humans can continuously sustain a maximum power output of 75 W [18 cal s–1]. Many laboring tasks in agriculture, such as digging, lifting, and carrying, require work rates of 300–600 W (Stout et al., Reference Stout, Myers, Hurrand and Faidley1979) and so must be interspersed with substantial rest periods.
In most tasks, rates of effective work are considerably less than 75 W. In harvesting, for example, 75% of muscular effort is expended in lifting our bodies, tools, and containers, and just 25% in getting the harvest into storage. When manual harvesting operations are expended over a 10 h work day that includes [necessary] rest periods, work rate is only 22 W. Animals are superior to humans because they are bigger and stronger, not because they are intrinsically more efficient. A horse, for example, can sustain 750 W (1 HP) and over a 10 h day can deliver 27 MJ, but once again only around 6% of that is converted to useful work. In contrast, moderate-size tractors can continuously deliver 35 to 50 kW [i.e. 35,000– 50,000 W], converting (non-dietary) fossil fuel to useful work at efficiencies around 35% at the crankshaft, and 25% at the drawbar under average soil conditions.
On all preindustrial farms, even where draft animals are used, most labor is human labor. On many subsistence farms, all labor is human labor.Footnote 12 And whether human or animal, the energy that fuels the labor is produced on the farm by that same labor. The farm (unlike the factory) recycles part of its manufactured goods (food) into the production process, which reduces the quantity of goods that can be used for other purposes, such as feeding children who are too young to work the farm. To most economists, a subsistence farm must seem a bit like a lunatic wooden-toy factory that burns a large fraction of the toys it makes to fuel the production of more toys.
If the energy inputs into subsistence farming are severely limited (by modern standards), so too are the energy outputs in the form of food. Figure 1.2, for example, shows perhaps the two best centuries-long time series of data on staple grain yields spanning part of the preindustrial period, the period of the industrial revolution and the period of modern, industrialized farming. The two countries shown, England and Japan, were (and are) located in two of the most intensive farming regions in the world. From the eighth century to the mid-nineteenth century, rice yields in Japan were nearly stagnant and barely more than a seventh of modern values. By the thirteenth century, English wheat yields were only about 5 percent of modern yields, although there was steady improvement over the late medieval and early modern periods. Both regions took off dramatically around 1850 with the adoption of “scientific” farming. These differences in yield between preindustrial and modern grain production can be taken, at least approximately, as exemplifying the general differences in productivity between traditional and industrial farming. They also illustrate how brief the transition between the two was.
Long-term historical trends in wheat yields in England (●) and rice yields in Japan (▲).

All these points are illustrated in Table 1.1, which contrasts three recent rice-farming operations in terms of direct on-farm energy inputs, indirect inputs including those of a commercial, industrial or otherwise off-farm nature and yields expressed in energy units.Footnote 13 Also shown is the energy efficiency of rice production, i.e. the ratio of harvested energy to the sum of energy inputs. The average Iban subsistence farmer, wholly dependent on shifting cultivation, is almost five times more efficient than modern rice growers in California – but then modern rice growers can afford to be extravagant with energy, subsistence farmers cannot. The efficiency of subsistence farming, widely praised by agroecologists, is purchased at the price of low productivity and a situation in which every household must often work hard just to meet its own needs.
| Iban | Japan | California | |
|---|---|---|---|
| Inputs | |||
| Direct energy: | |||
| Labor | 0.642 | 0.804 | 0.008 |
| Machinery | — | 0.189 | 0.360 |
| Fossil fuels | — | 0.901 | 4.275 |
| Indirect energy: | |||
| Nitrogen | — | 2.088 | 4.116 |
| Phosphorus | — | 0.225 | 0.201 |
| Seeds | 0.392* | 0.813 | 1.140 |
| Irrigation | — | 0.910 | 1.299 |
| Insecticides | — | 0.348 | 0.191 |
| Herbicides | — | 0.699 | 1.119 |
| Electricity | — | 0.007 | 1.597 |
| Transport (nonhuman) | — | 0.051 | 0.121 |
| Output (rice yield) | 7.318 | 17.598 | 22.370 |
| Energy efficiency | 7.08 | 2.45 | 1.55 |
| Percentage workforce involved in agriculture | > 95 | c. 20 | ≤ 5 |
* Seeds used by the Iban are included under indirect energy not because they are produced off-farm, but because they were produced in the previous farming year, not the current one.
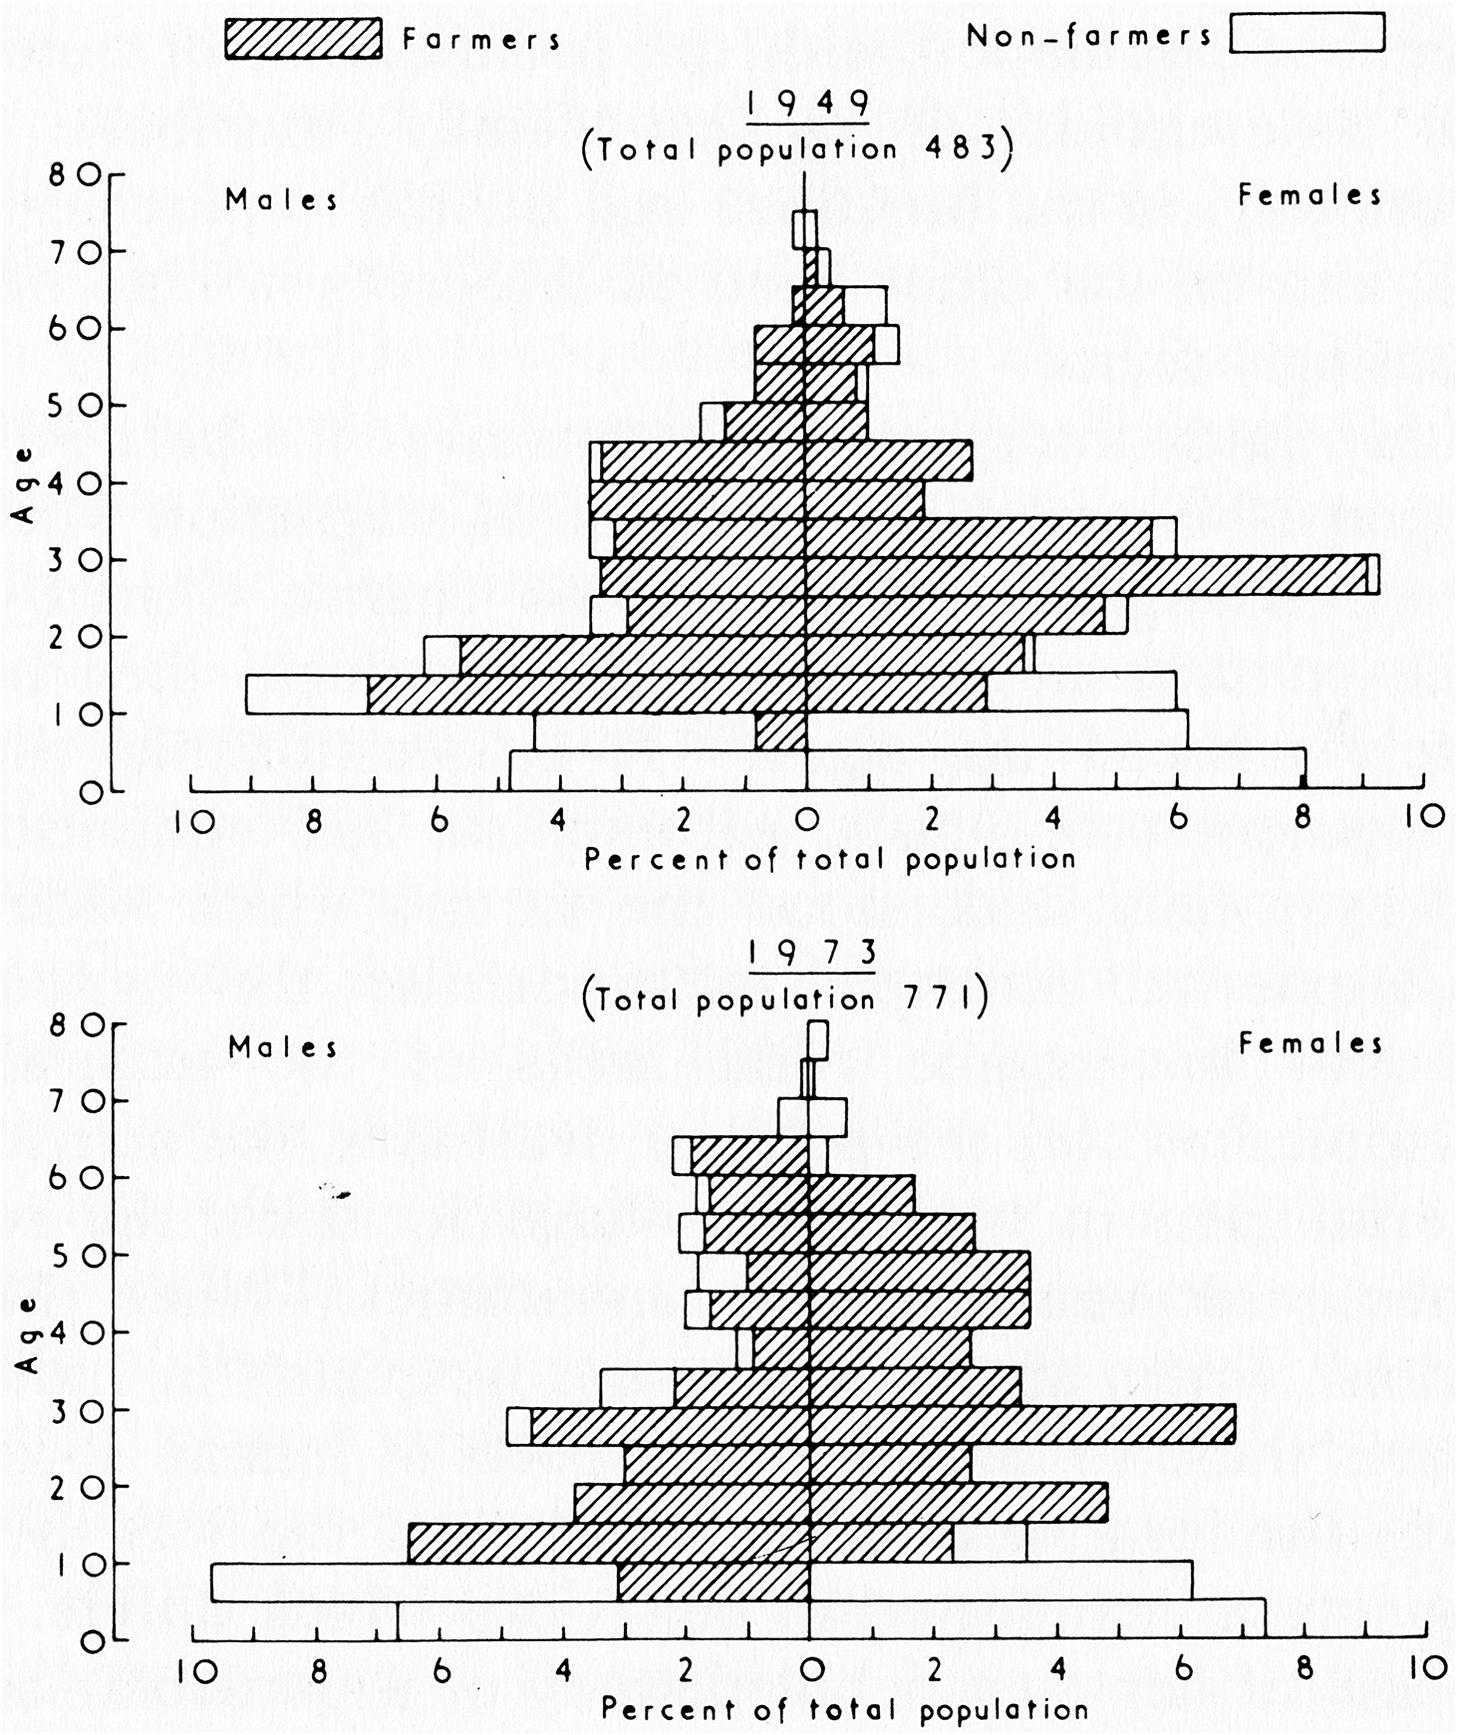
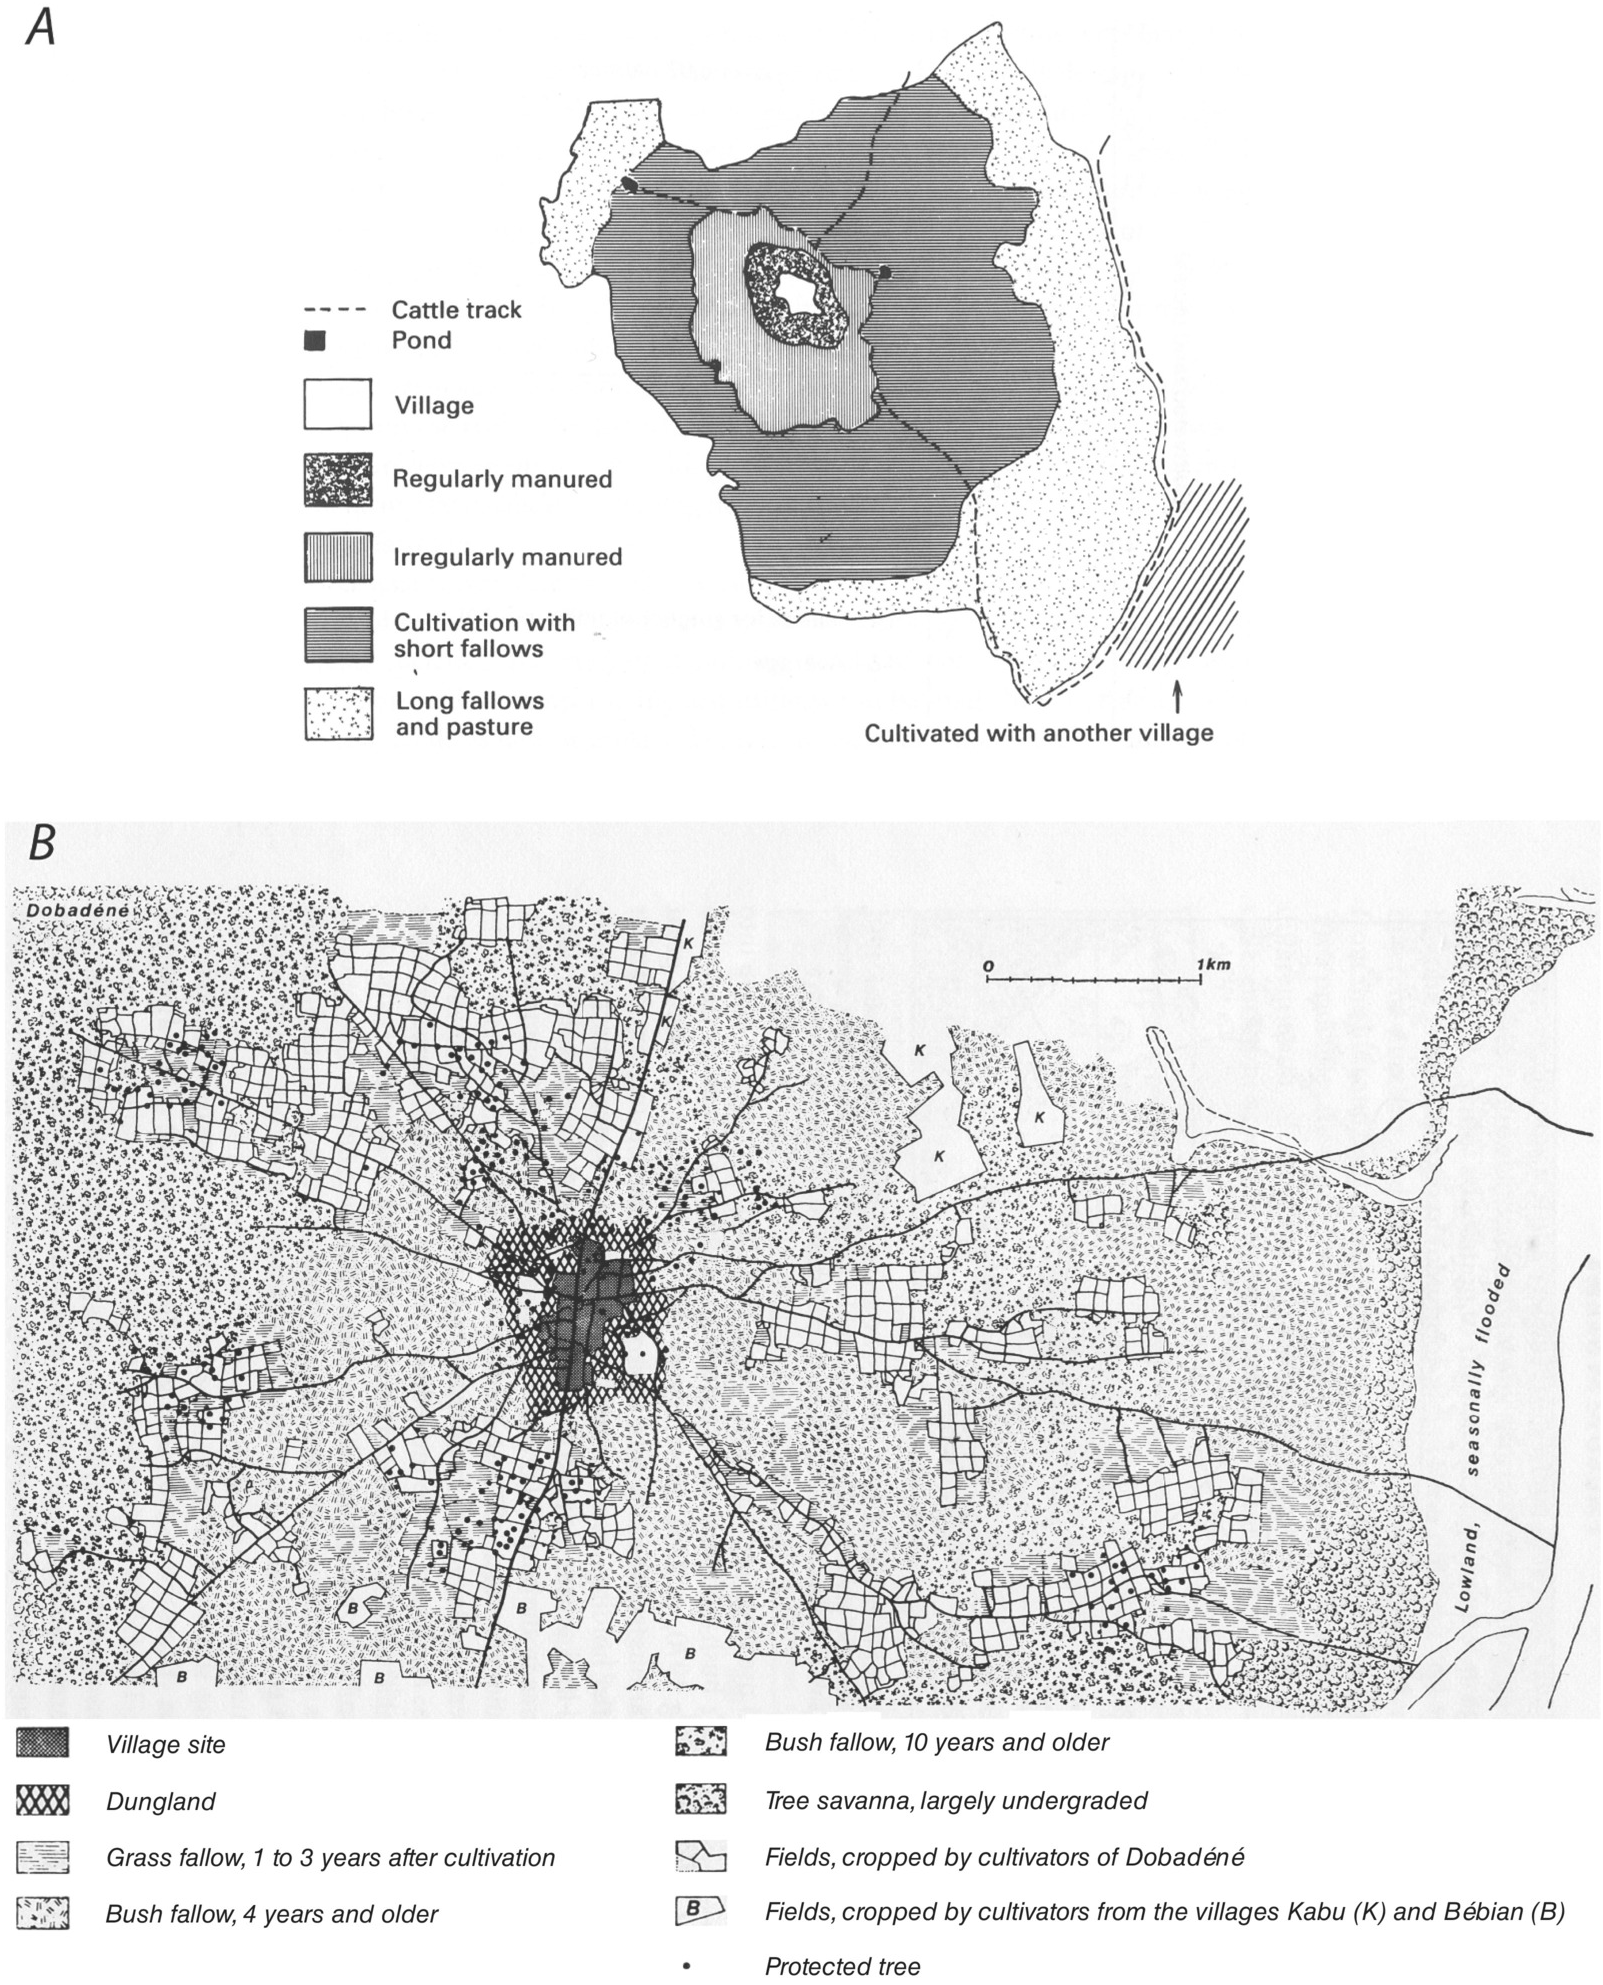
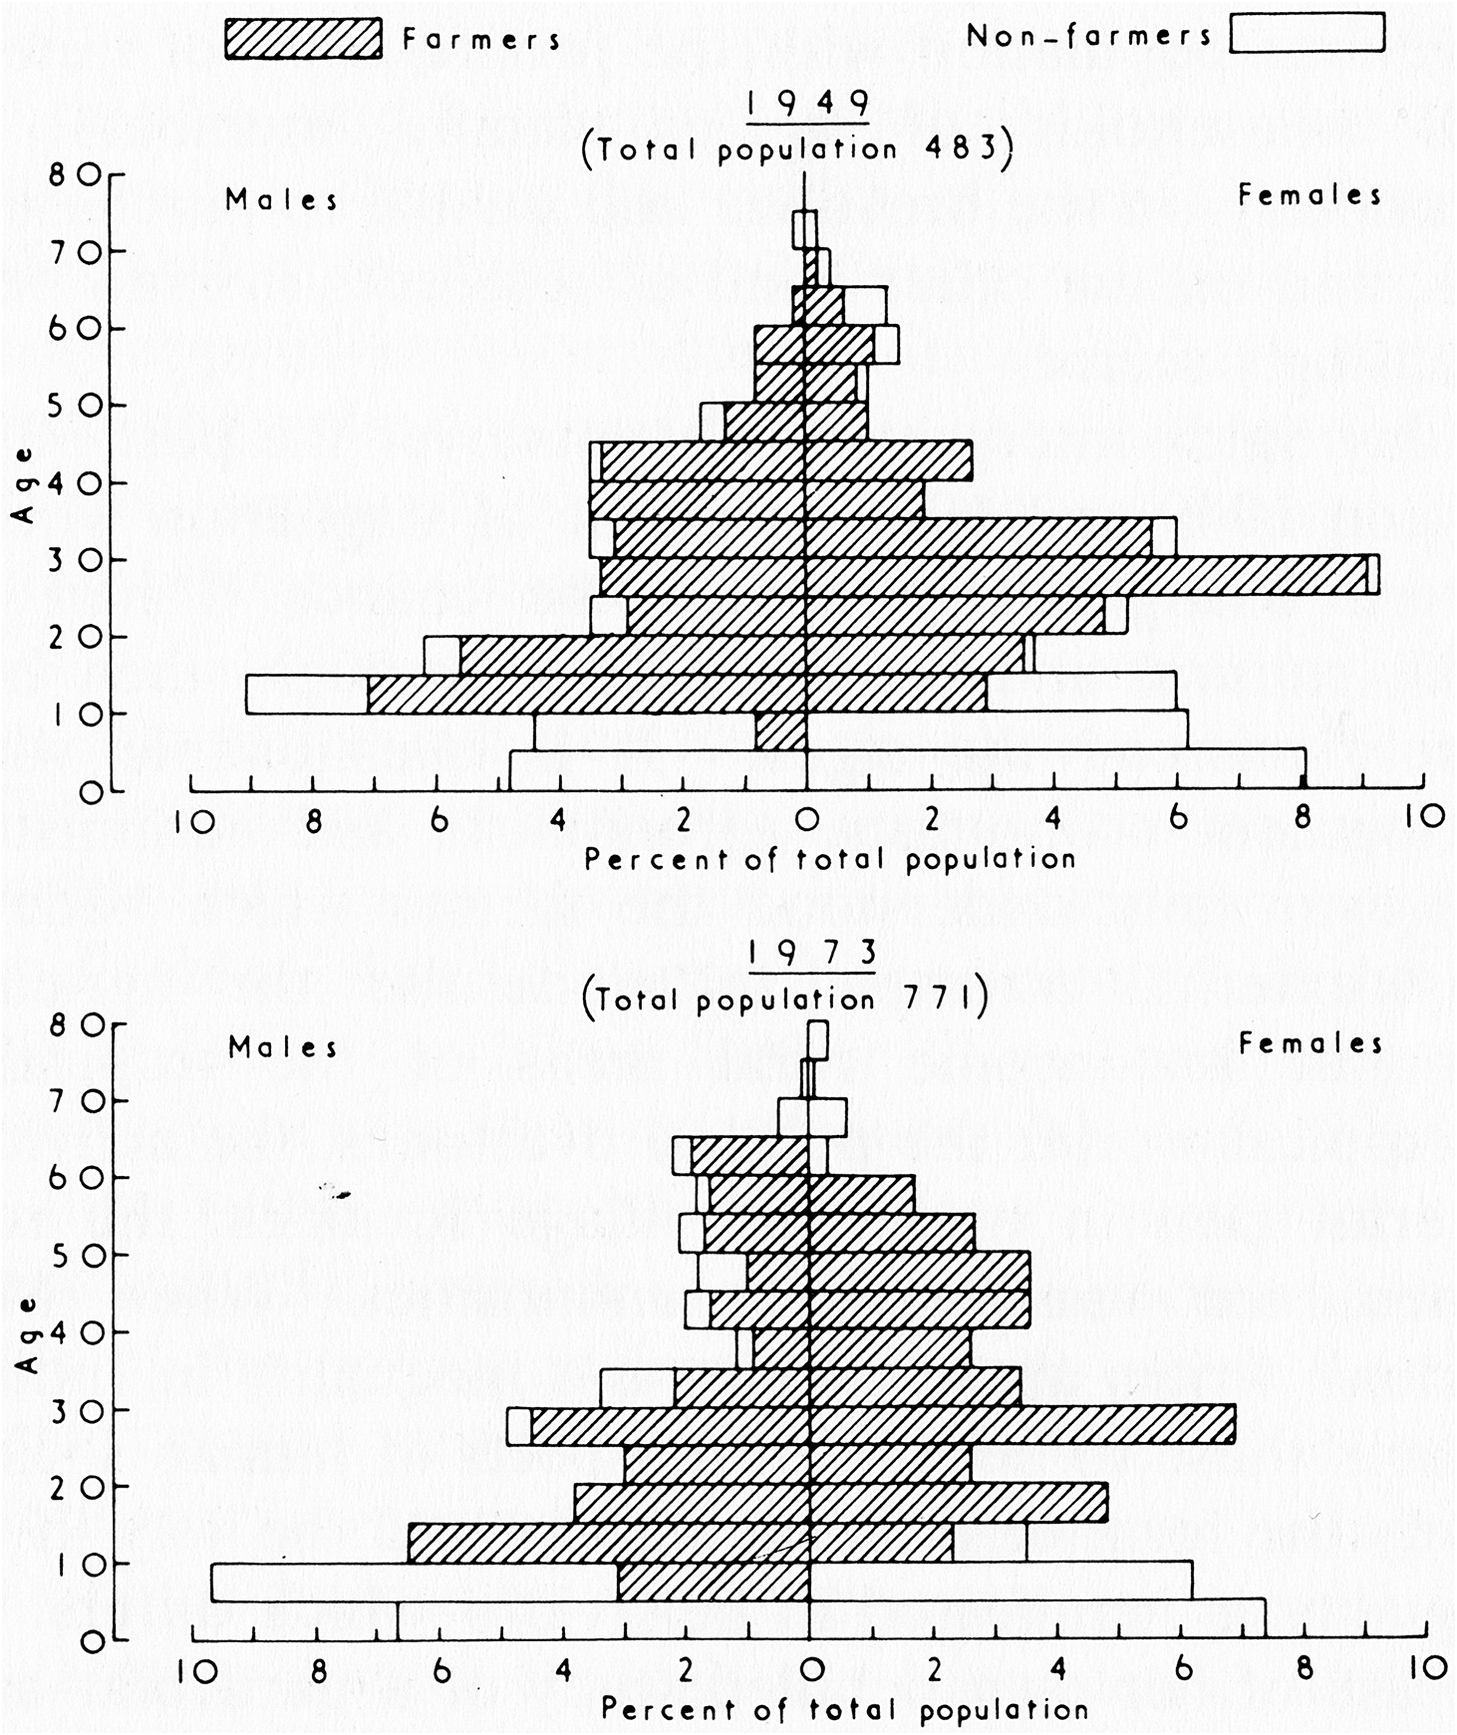
One corollary of this low productivity is that the available workforce in traditional farming communities must be dedicated almost exclusively to food production (Table 1.1). In the West African example shown in Figure 1.3, the only villagers not directly involved in farming are young children and a tiny handful of merchants, teachers, imams, government officials and elders (Haswell, Reference Haswell1985).
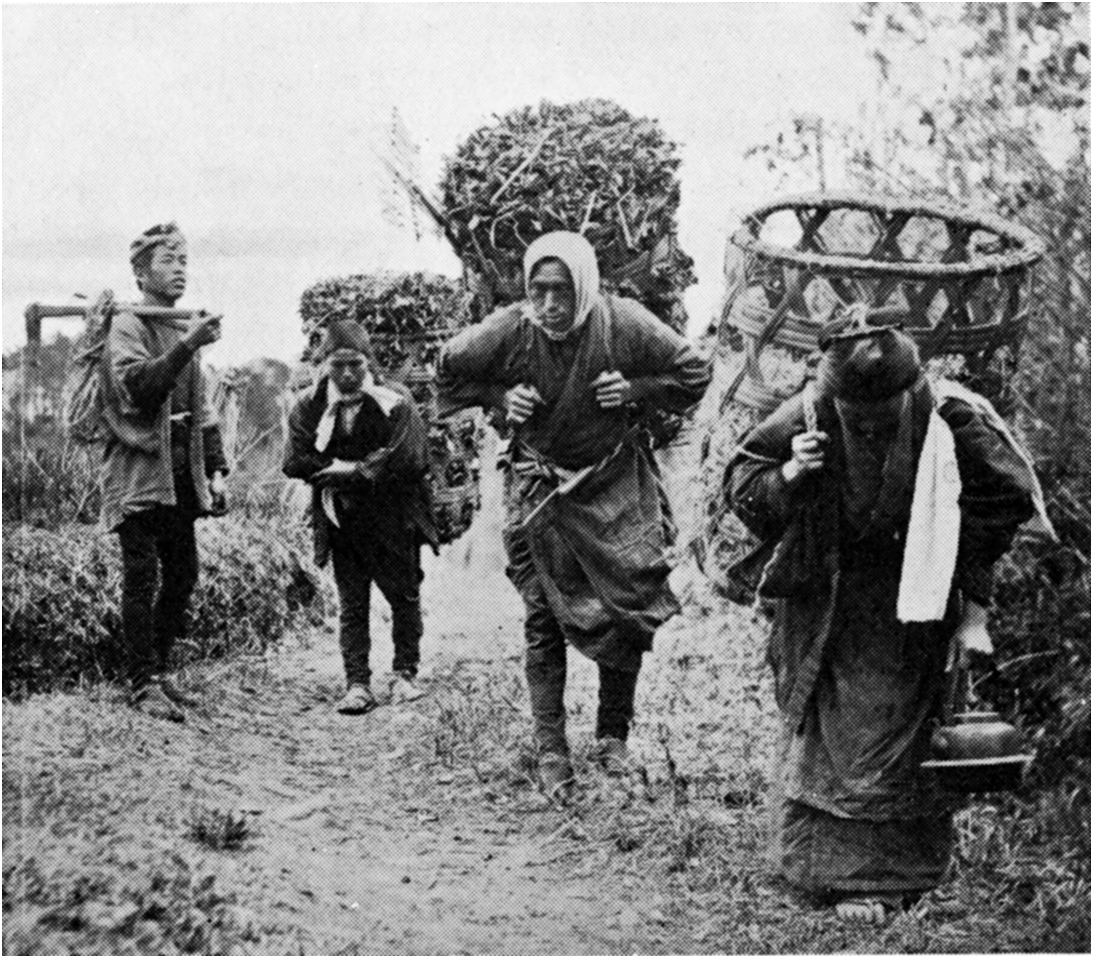
Another way in which the absence of nonhuman, nonanimal energy profoundly affected the lives of most traditional farmers was by impeding transport. Preindustrial methods of transport were energetically costly (Table 1.2), in part because most haulage was done by humans or animals that had to be fed for their efforts, and because infrastructure for transport (tracks, roads, bridges, canals, ports) was primitive well into the early modern period (Albert, Reference Albert1972; Chaloner and Ratcliffe, Reference Chaloner and Ratcliffe1977; Fenton and Stell, Reference Fenton and Stell1984; Hindle, Reference Hindle2002).Footnote 14 As the great French geographer Pierre Gourou noted with reference to China before 1940:
The transport of merchandise required large amounts of human labour, for there were almost no roads accessible to carts or motorized vehicles; and it must be remembered that draught animals were in competition with human porters for the consumption of cereals. In Szechwan, in 1938, the cost of coal transport in panniers suspended from a yoke doubled the pithead price after a journey of only 20 km. In the whole of China, in 1938, the price of a tonne-kilometre of human porterage was about 0.62 Chinese dollars, or 6 or 7 French francs of that period [approximately 21¢ US at the 1934 exchange rate]. The human porter was poorly paid, for he only earned the equivalent of 5 French francs for carrying 40 kg over 30 km in a day. However, even at these very low rates the cost of transport was crippling, being ten or twenty times higher than by modern methods. It was impossible, under such conditions, to carry heavy loads for long distances; 100 km was about the limit. When shortages or actual famine affected large areas, creating a huge demand for the movement of foodstuffs, it was impossible to supply the needs without water transport.
Clark and Haswell (Reference Clark and Haswell1967: 178–99), who have closely examined this problem, estimate that the energetic costs of hauling a tonne of grain over moderately hilly country on the backs of humans or animals and in the absence of well-developed roads were so high that no one could move it more than about 20 km without consuming the equivalent of more than half its energy content. No wonder people seized every opportunity to use water transport wherever it was available.Footnote 15
High transport costs, combined with all the risks and fears associated with straying too far from home, meant that traditional farming communities were characterized by a degree of localization that most of us would find oppressive. As Joe Pierce once wrote of a traditional Anatolian farming community:
Almost everyone born in the valley lived and died there. In [the village] he would marry someone who had also been born and reared there. Hence, such things as international politics or even national politics did not concern him much.
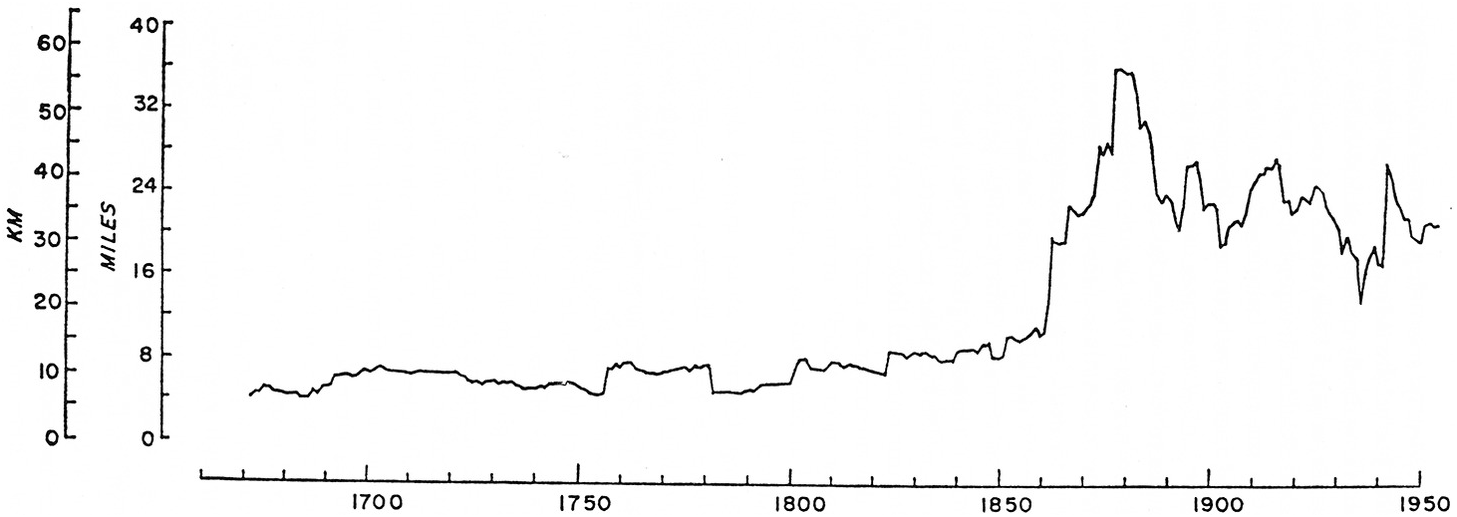
It is practically impossible to monitor life-time migration patterns prospectively for individuals from preindustrial populations, so various proxy measures are used in population research. For example, it is comparatively easy in a cross-sectional survey to ascertain the birthplaces of a husband and wife and later determine the map distance between those locations. The average or distribution of such “marriage distances” can then be used as a proxy measure of the spatial extent of an individual’s social network. For example, Figure 1.4 shows temporal trends in the average marriage distance in the English farming community of Charlton-on-Otmoor from the late seventeenth century to the mid-twentieth century. For at least 150 years the average distance remained fairly constant at about 10 km, but then shot up dramatically after 1860, increasing by some 300 percent.Footnote 16 Since the abrupt increase coincides with the arrival of railroads in the area, Figure 1.4 can be taken as a graphic illustration of one of the effects of industrialization on customary patterns of movement.
Marriage distances, Charlton-on-Otmoor Parish, Oxfordshire, England. Changes in mean marriage distance (excluding endogamous marriages) from c. 1670–1950. The rapid increase in marital distance c. 1860 reflects the railroad reaching the area.

The lives of our preindustrial farming ancestors were thus spent in a world that was tiny compared with our own. The places known to them were known with an intimacy we can only guess at. But their knowledge may not have been worth much 20 km away. In a traditional farming village in Colombia, we are told,
[m]ost people move only between their houses and their fields. Year after year they use only a certain trail and when asked about trails in another direction they are often ignorant or uncertain of them. They may know a few neighboring trails, those used by villagers who have their fields in the same general direction, but a man who owns a field on the slopes west of the village does not necessarily know how the slopes to the east of it can be reached. And there is little interest in knowing.
One demographically important consequence of this extreme spatial circumscription is that populations in the rural preindustrial world tended to be extremely vulnerable to year-to-year fluctuations in local conditions. Today, at least when there are reasonably well-developed transport facilities and stable political systems, food can be airlifted thousands of kilometers to communities affected by famine. In the past it could scarcely be headloaded 20 kilometers and then only in small batches.
Subsistence Farming as the Most Basic Form of Traditional Farming
I have suggested that a focus on traditional farming allows us to simplify the conceptual and analytical problems involved in studying the connection between population and agriculture. To simplify things even more, I will be concerned in this book primarily with subsistence farming, which can be regarded as a special kind of traditional farming. “Subsistence” has at least two distinct meanings, and we must be careful to keep them separate. In the first meaning, the unit of production – in this case, a farming household – produces primarily for its own use. This can be called the subsistence form of production – what Sahlins (Reference Sahlins1972) labels the domestic mode of production. The second meaning is what might be called the subsistence level of production, which implies that the production unit is able to produce food at a level just sufficient to meet its needs and no more. When I speak of subsistence farming, I am using the first of these two meanings. It is a separate question – though theoretically quite an interesting one – whether the subsistence form of farming usually operates at or near the subsistence level of production. I suspect it often does, but that is an empirical question, not a definitional one.
Mainstream economists have sometimes had a hard time dealing with the subsistence form of farming even as a theoretical concept. During the 1960s, for example, students of economic development started to realize that poor, non-industrialized countries could not be transformed overnight by investments in industry alone without prior improvements in the agricultural sector (which, of course, made up by far the greater part of the economies in question). This posed an analytical problem for economists, precisely because the agricultural sector was typically dominated by subsistence-oriented farms run by family-based households. Economists knew how to model factories, but traditional family farms were a different matter:
The theory of the family farm is essentially the theory of what may be called the “household firm”… There are two characteristics of this conceptual creature which are crucial for economic theorizing: first, that a part of the output goes to the household; and second, that a part of the input comes from the household. The “pure” firm “purchases” almost all its inputs and “sells” almost all its outputs in the market at market prices against money payments. But the household firm simply transfers in kind a part of the household input potential to the firm and a part of its output to the household. The consequence of this institutional hybridization is that the models of the household firm have also to be hybrids of the theory of the productive firm and the theory of the consumer household.
To speak of things as “hybrids” would seem to suggest that they are (slightly unnatural?) products of the marriage of pure forms that already exist. In reality, of course, the family farm predates the capitalist firm by thousands of years. How do we meld established models of purely productive firms and purely consuming households to deal with this strange “conceptual creature” that does both? Or should we even try to meld them? I suggest that the primary point of confusion here is that many economists have mistakenly assumed that the real purpose of the subsistence-oriented family farm is to grow and eat food, but in reality it does those things only to attain its real goal. Even back in the 1960s, some economists understood this point:
With the introduction of the capitalist system labor became a commodity, like any other commodity to be purchased or dispensed with, hired or sacked, according to the needs of the firm and the state of the market. For the peasant chef d’entreprise such freedom of action can never exist. His labor force consists mainly of his kith and kin; his wife, his children and their dependents, his elderly parents. To hire and fire them according to the dictates of some external regulatory mechanism would be at once, inhuman, impractical, and irrational. Inhuman because only in exceptional circumstances are alternative employment opportunities ever generally available. Impractical because members of the labour force, as members of the family are entitled to a share in the ownership of the mean of production; because historically the enterprise is the sum of the labours of the generations. Irrational because the objectives of the enterprise are primarily genealogical and only secondarily economic…
The objectives of the enterprise are primarily genealogical or (more or less equivalently) demographic and only secondarily economic – precisely so. The real purpose of a subsistence farm is to create and sustain a family. Food is essential for meeting that goal, but it is not the goal per se.
The Subsistence-Oriented Farming Household as a Demographic Enterprise
This, then, is the central principle guiding this book: the subsistence farming household is essentially a demographic enterprise. I will argue that, if accepted, this principle has the potential to transform the whole debate about population and traditional farming. But why call it an enterprise, which sounds a bit mercenary? According to the Shorter Oxford English Dictionary, the primary definition of an enterprise is “A piece of work taken in hand, an undertaking; esp. one that is bold, hazardous, or arduous” (Brown, Reference Brown1993: 828). As later chapters will show, subsistence farming is certainly hazardous and arduous. Failure is not only a possibility but a reality for many households. And subsistence farming is plainly an undertaking – that is, it is initiated consciously and deliberately to meet a specific goal. Like any other enterprise, farming involves human agency, consciousness and purpose, plus a lot of hard work. Then why a demographic enterprise? As argued in the previous section, the goal of the enterprise is to create and raise a family, and the three basic forces of demography – fertility, mortality, migration – are the determinants of whether that goal is met or not.Footnote 17
There are several important implications of viewing the subsistence farming household as a demographic enterprise. First, and perhaps most importantly for the population/agriculture debate, it means that “population” and “subsistence agriculture” are not separate things acting on each other from a remove – they are in fact the same thing. Thus, it may not be strictly correct to speak of “linkages” between demography and subsistence farming, as do Malthus, Boserup and more recent writers. Instead, it may be better to regard them, at the household level, as a single, integrated set of processes. The whole raison d’être of subsistence farming is demography.
Second, when the principal unit of production corresponds to the principal unit of consumption, as it does by definition in subsistence farming, “production” and “consumption” become part of a single overarching process – no market mechanism intervenes to separate them. Of course production and consumption can still be distinguished empirically and measured separately. But the “agricultural” sphere, the purely productive part of the enterprise, is no longer separate from the “domestic” sphere – the domain of economic activity most oriented toward family food consumption. The two are linked as source and sink, and, as often happens in physiology, the sink can drive the source. Thus, the theory of subsistence farming should cover everything from food production to food consumption and beyond – including field preparation, tillage, sowing, weeding, manuring, reaping and transport, but also food processing, storage, distribution, haulage of fuel and water, cooking, eating, carry-over of seed and (importantly) the care and feeding of children. In subsistence farming, there is no gap between the agricultural and the domestic – both are essential parts of the household demographic enterprise. As shown in Chapters 9 and 10, this insight has important implications for how we think about household energy budgets and the allocation of household labor.
Third, any attempt to understand subsistence farming as a demographic enterprise must allow for human agency. Now, “agency” has become a terrifying bugbear in the social sciences, one that seems to inspire a lot of incomprehensible quotes from Continental philosophers. There will be no such quotes in this book. The view of human agency adopted here is simple, utilitarian and I dare say reductive. I begin, quite shamelessly, by assuming a reasonably constant human nature among all farmers, ancient and modern, as neatly captured by the archaeologist Peter Bellwood:
The range of individual human behavior patterns can be treated as relatively uniform during the time span of agriculture… Given the modern biological unity of mankind, individual human behavior patterns of 10,000 years ago were probably essentially similar in their range to those of today. Thus, desires for economic and reproductive success, peer-recognition, [and] freedom from fear and disease, plus capacities for calculated altruism and morality, have presumably always characterized anatomically modern humans like ourselves. So too have abilities to be acquisitive and destructive. There is no evidence to suggest otherwise, although this opinion is impossible to justify with complete certainty. It is maintained as a working hypothesis underpinned by uniformitarian principles.
Next I assume that subsistence farmers qua farmers are usually rational decision-makers and managers.Footnote 18 This may appear to be the same musty assumption made by classical economists – not to mention a challenge to the fascination present-day economists seem to have for the irrational in human behavior – but it is not, or at least not quite. No doubt subsistence farmers have production goals in mind at the outset of the agricultural year, and they try to manage their limited resources in an attempt to meet them. But their goals are usually modest and are not aimed at maximizing profit. Rather the yearly economic goal of the subsistence farmer is to produce enough food to keep his or her family alive and to plant next year’s crop, and perhaps a bit more to act as a buffer against unanticipated shortfalls. To fall back on some old but useful jargon, subsistence farmers are satisficers, not maximizers.Footnote 19 Yet, no matter how modest their economic aspirations, their ultimate goal is of profound demographic importance: to produce new children who will survive to adulthood, the very process that keeps the population as a whole going (even if that is not the immediate concern of the farmers themselves). And besides, even their modest goals can be frustrated by environmental uncertainty, incomplete information, under-capitalization, institutional barriers, stupidity and sheer pigheadedness. To use a modern economic phrase, I think subsistence farmers, like everyone else, are characterized by bounded rationality (Kahneman, Reference Kahneman2003). Subsistence farmers are quite as capable as we are of making foolish decisions. But the consequences of their foolishness – including perhaps the starvation of their children – are direr than the consequences of ours.
Salient Features of (a Model of?) the Subsistence Farming Household
In theory, then, this book is about demographic processes inherent to the subsistence form of traditional, family-based farming. When marshalling empirical evidence, however, I will sometimes be forced to deal with traditional farming behavior that transcends pure subsistence – for example, the activities of traditional farmers who market some of their produce. How much error do I introduce by doing so? Suffice it to say I will try to avoid discussing systems that stray very far from the subsistence ideal (or at least to point it out whenever I do). How many traditional farming systems will I exclude by doing so? Fewer than might be expected. Many traditional farming households, it is true, produce food for nonhousehold consumption – e.g. to take to the market or to meet social or political obligations (rents, taxes, tributes, etc.). But in many cases these households can be viewed as fairly straightforward extensions of the pure subsistence ideal. In those cases, some large fraction of the food produced, often well over 50 percent, may still be consumed by the household that grows it. In addition, most cash earned in marketing may itself be spent on food for the household. In fact, agricultural economists often use the fraction of a household’s monetary income spent on food as an indicator of how integrated the household is in the cash economy – if the fraction is large then the household cannot be considered a truly commercial enterprise, but something still close to subsistence. The earliest stages of the farming household’s involvement in the cash economy might even be considered “subsistence by other means.” In my opinion, this sort of “impure” or near-subsistence farming was once widespread and is still quite common today. The important thing about it is that food production is still dominated by a subsistence logic rather than a commercial one.
Subsistence farming (traditional farming without wide distribution of food beyond the household) is, like traditional farming itself (farming without industrial inputs), defined as a negative and therefore runs the risk of being a junk category. I do not think it is: despite the tremendous diversity of practices that fall under the heading of subsistence or near-subsistence farming, subsistence farming communities all share certain important characteristics and can be studied together profitably. But rather than trying to distill those characteristics into a short dictionary definition, I think it would be more useful to list the shared attributes. What follows, then, is a catalog of features that are shared widely by the farming systems discussed in this book, and that will be explored in detail in later chapters. Since several of the features have already been mentioned, this list can serve as a summary of the present chapter as well as a pointer to things to come.
(1) The primary unit of food production – the farming household – is also the primary unit of food consumption. Most food grown by a household is eaten by that same household. Most food eaten by a household is grown by that same household. Note the judicious use of “most.” No subsistence farming household is or ever was truly isolated when it comes to food.
(2) Supra-household work groups do exist and are important, but are small, localized and evanescent. Mobilized to perform a few specific tasks during particular parts of the agricultural year, such groups break up into their constituent households during the rest of the year. The tasks involving larger work groups are typically those that must be done quickly and that can be expedited by a division of labor (field clearance, plowing and harvesting are important examples).
(3) Farming households are farming families. They are typically made up of a core of closely related kin – usually within a single degree of relatedness – plus their spouses.
(4) The objective of the subsistence-oriented farming household is to create and feed a family, not to make a profit. Demographic processes (fertility, mortality, migration) are an inherent part of meeting that goal. Thus, the subsistence household is a demographic enterprise, not strictly an economic one.
(5) Most farm management decisions originate within the household. In most cases decision-making is dominated by the male head of household, albeit under the influence of other household members (and some nonmembers). Larger groups are likely to be involved in decisions about common-use resources.
(6) Exclusive access to arable land and disposition of its produce are (at least temporarily) vested in the household. Under usufruct, these forms of control may last only while a plot is cultivated. Even when control is more permanent, it may not be heritable. Permanent alienation of land may be controlled by a larger group such as a lineage.
(7) Subsistence farms are small operations. Households themselves are small in size, usually falling between one and twelve members, with a mean of about five to seven. The area of arable land allotted to the household is also small, often much less than ten hectares. Both household size and household land area vary in important ways, and at least some fraction of that variation is likely to be stochastic (random).
(8) Farming households are dynamic. Households change over time – they can even be said to have a built-in demographic life cycle. The changeability of households often makes them difficult to define, especially in prospective studies. But the changeability cannot be ignored. Household dynamics are an important element of the household’s ability to adapt to changing circumstances, and yet those same dynamics can sometimes create problems to which the household in turn must adapt.
(9) The demographic composition of the household is the single most important determinant of both production goals and availability of household labor in subsistence farming. If the household demographic enterprise is to succeed, then agricultural yields must meet the household’s joint nutritional requirements. These requirements vary by age and sex, as well as by workload and health status (which also vary by age and sex). It follows, then, that the food needs of the household as a whole are determined in large part by the age and sex composition of its members, as well as its absolute size. Insofar as household members constitute the usual labor force for farming, the total physiological work capacity of the household members is a major limiting factor in how much labor can be invested in the family farm. As detailed in Chapter 9, physiological work capacity also varies by age and sex as well as by health status.
(10) In most years, agricultural production is likely to be slightly more than needed to meet immediate subsistence requirements. Given the unpredictability of the agricultural environment, meeting subsistence goals reliably may require some excess production during normal or good years – the so-called “normal surplus” (Allan, Reference Allan1965: 38–48) – as a hedge against the possibility of production shortfalls during bad years (but see Chapter 2 for a different risk-avoidance strategy that does not involve a normal surplus).
(11) Beyond the normal surplus, there is little incentive to produce in excess of the household’s own needs (including enough plant material to sow next year). Food storage and transport facilities are poorly developed. It is difficult to carry over even the normal surplus for future consumption or to disperse it beyond the local neighborhood. There is little if anything to be gained by producing much above the subsistence level, except perhaps to meet highly localized social obligations.
(12) Agriculture is the primary occupation of every household in the community. Most adult workers (and many children) are directly or indirectly involved in food production. Indirect involvement might include the making of agricultural tools, milling grain, building farm structures and so on; such work is usually done by semispecialists who are directly involved in food production for most of the year. Many subsistence farmers also do a certain amount of hunting and collecting of wild foods (Wilken, Reference Wilken1970; Delang, Reference Delang2006; Tucker, Reference Tucker, Kennett and Winterhalder2006), and these contributions need to be included in the household budget.
* * *
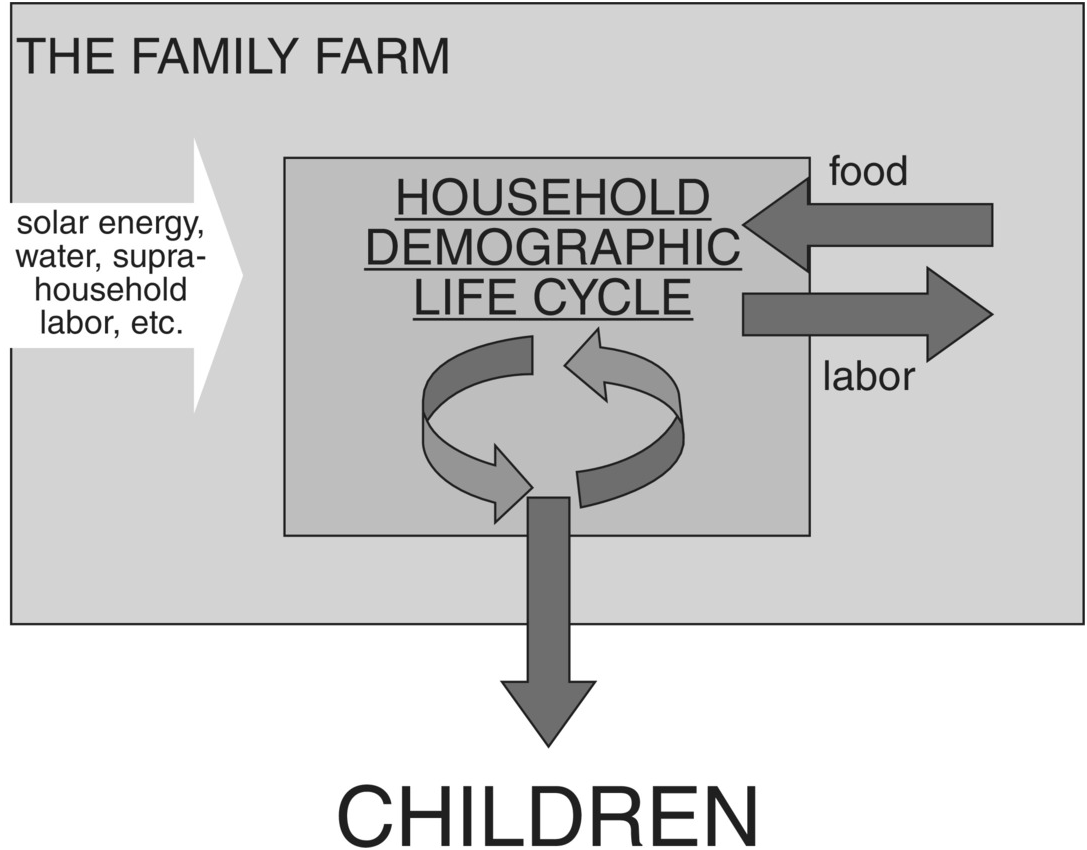
For the moment, it might be best to think of this portrait of subsistence farming not as an exact representation of something to be found in the real world, but as a model – that is, an ideal, stylized picture that may provide a useful, deliberately simplified starting point for analysis and (more importantly) understanding. The basic elements of this model of subsistence farming are summarized in Figure 1.5, which will reappear throughout this book.
The model of subsistence farming that will guide this book.

Raymond Firth (Reference Firth and Wharton1969: 24) once called subsistence farming “an almost pure economic concept” – note “concept,” not “phenomenon” – that excludes just about everything of interest to the anthropologist. Be that as it may, the cautious modeler always begins with the simplest possible case and adds “realistic” complications later, and only if they promise to enlighten. What this implies, however strange it may seem, is that even if subsistence farming does not exist and has never existed, it is still worth devoting a book to it.
A Digression on the Use of Abstract Models in Thinking about Subsistence Farming
Subsistence farming is an important subject for a book even if it doesn’t exist? Sensible people might well regard this assertion as a sign of mental weakness on the part of the author. But that would miss the whole point of scientific modeling. As the population biologist Joel Cohen once remarked (Reference Cohen1995: 429), models are “cartoons” of reality. What he meant by this is that a scientific model, one intended for use in empirical studies, is expected to share certain points of similarity with some delimited piece of reality, but only in a very simplified, schematic way. Like a cartoon, a model leaves out most of reality – and quite deliberately so. What it includes, the modeler dearly hopes, are the most fundamental and general elements needed to understand a set of real-world processes (note that I say “understand” not “perfectly predict the behavior of”). A model never is reality, it is only a tool for thinking about reality – a point all too many modelers lose sight of. A wise modeler never mistakes her model for the real world.
The logic of scientific modeling was captured admirably by counter-example in a short story by Jorge Luis Borges (Reference Borges1970: 141) called “Of Exactitude in Science” and purportedly taken from a manuscript of 1658. Here it is in its entirety:
…In that Empire, the craft of Cartography attained such Perfection that the Map of a Single province covered the space of an entire City, and the Map of the Empire itself an entire Province. In the course of Time, these Extensive maps were found somewhat wanting, and so the College of Cartographers evolved a Map of the Empire that was of the same scale as the Empire and that coincided with it point for point. Less attentive to the Study of Cartography, succeeding Generations came to judge a map of such Magnitude cumbersome, and, not without Irreverence, they abandoned it to the Rigors of Sun and Rain. In the western Deserts, tattered Fragments of the Map are still to be found, Sheltering an occasional Beast or beggar; in the whole Nation, no other relic is left of the Discipline of Geography.
Some five decades ago, an anonymous editor of the Journal of the American Medical Association made the same point with considerably less irony:
A model like a map cannot show everything. If it did it would not be a model but a duplicate. Thus the classic definition of art as the purgation of superfluities also applies to models, and the model-maker’s problem is to distinguish between the superfluous and the essential.
As George Orwell might have said – but didn’t – all models are lies, but some models are more useful lies than others.
In a scientific context, “model” is often taken to mean an explicitly mathematical formulation – a mathematical model. Now, mathematical models have their virtues: they are precise and make quite focused predictions about the real world; they are also unambiguous, if only for those who are fluent in the arcane language in which they are couched. But mathematics is not necessary for doing modeling. Models can be graphical or even verbal – just pictures and words, not equations – and still fulfill all the useful functions of models. Mathematical models do have a certain cachet in some circles, but after long experience I have come to believe that they are often premature, misleading and over-sold. Certainly mathematical models of any complexity are difficult to communicate to anything but a specialist audience, and for that reason alone are of limited use to the scientific community as a whole. Almost all the models presented in this book will be graphical or verbal, and whenever an equation appears I will do my best to explain it in pictures and words.
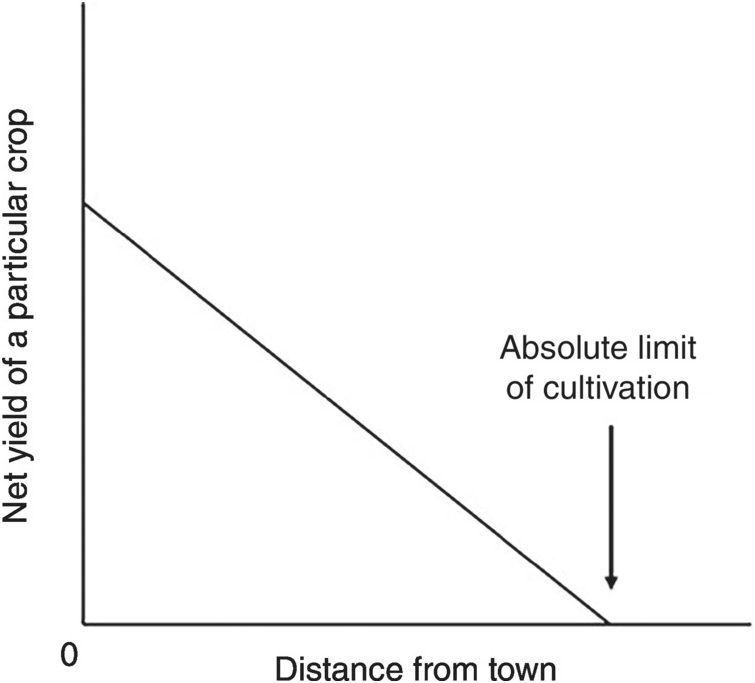
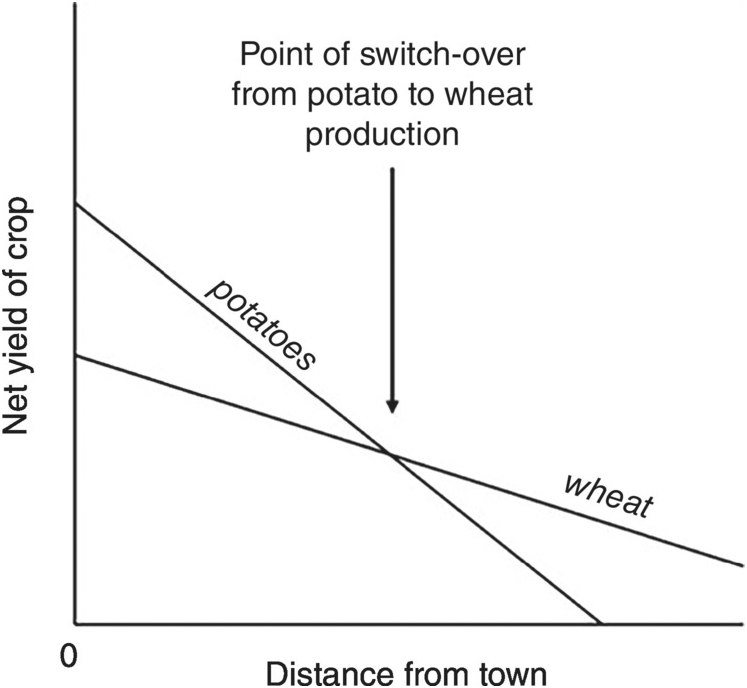
Whatever form a scientific model takes, its underlying logic is always the same. That logic can perhaps best be conveyed by an example. The particular example I’ve chosen is one of the earliest models to be developed and applied in a thoroughly modern way. Happily for us, it is a model of preindustrial agriculture (although it has also been applied successfully to modern industrialized farms). While not explicitly a model of the relationship between population and farming, it provides important insights into the spatial distribution of farming populations and will crop up repeatedly in later chapters. Although it sometimes finds modern expression in complicated mathematical or computer models (Blaikie, Reference Blaikie1971; Sasaki and Box, Reference Sasaki and Box2003), the original version was purely verbal and graphical – which is exactly the version most researchers still use and understand today. It is, in my opinion, a very pretty model.
The model was invented by the German mathematician (and farmer) Johann Heinrich von Thünen (1783–1850), who presented it in a book titled The Isolated State, published in 1826. At that stage in his career, von Thünen had partially retired from academia and had purchased a large farm in the northern plains of Germany. In thinking how best to organize his farm, von Thünen started with the following scenario:
Imagine a very large town at the center of a fertile plain that is crossed by no navigable river or canal. Throughout the plain the soil is capable of cultivation and is everywhere of the same fertility. Far from the town, the plain turns into an uncultivated wilderness that cuts off all communication between this State and the outside world.
There are no other towns on the plain. The central town must therefore supply the rural areas with all manufactured products, and in return will obtain all its provisions from the surrounding countryside…
The problem we want to solve is this: what pattern of cultivation will take shape in these conditions? And how will the farming system of the various districts be affected by their distance from the town? We assume throughout that farming is conducted absolutely rationally.
We would now call these model assumptions. They are not intended to be particularly realistic (although the flat loess plains of northern Europe where von Thünen’s farm was located meet the assumptions about as well as any other part of the Earth’s surface); rather, they are intended to simplify the situation so that the effects of one particular variable can stand out unobscured. Spatial analysts would now call the uniform, featureless plain posited by von Thünen an “isotropic” plain – the same in all directions.
So we are to plunk a town down in the middle of an isotropic plain and start up a market for agricultural produce in its center. How would farming come to be organized in the countryside around the town? Well, the only thing that can possibly differentiate one farm site from another on an otherwise uniform landscape is its distance from the market. Since the plain is flat and has no feature to impede or facilitate movement, there is a perfect correlation between distance and transport costs. This means that the cost of getting a particular crop to market increases linearly with distance from the market, and thus the net income (or effective yield) for the farmer after subtracting the cost of transporting the crop, goes down linearly with distance (Figure 1.6). Ultimately there will be a distance from the town so great that transport costs cannot be even partly offset by the market value of the produce (Figure 1.6, arrow). If we rotate our net yield line around the center point provided by the town, we will find that the town is surrounded by a circle of finite radius, beyond which the crop will not be grown for the market – assuming, as von Thünen does, that farmers are economically rational. The town cannot expect to get the crop from outside this circle unless it coerces it.
Yield of a single crop net of transport costs as a function of distance from von Thünen’s town.
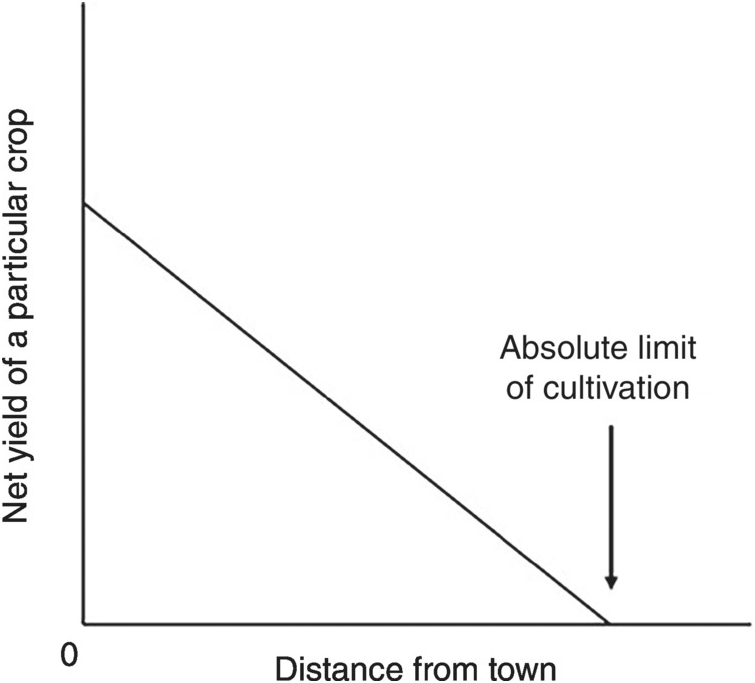
Now imagine that two crops are available for cultivation – for example, wheat and potatoes. Potatoes yield more than wheat in northern Europe, but are bulky and heavy because of their higher water content and are thus more expensive to transport than wheat. Therefore, as shown in Figure 1.7, the line of net yield starts higher for potatoes than for wheat (reflecting higher gross yield), but declines more rapidly as distance from the town increases (reflecting higher transport costs). Under these circumstances, it will often be the case that the two net yield lines cross (Figure 1.7, arrow). Beyond that crossing point, potatoes will provide a lower net yield or income than wheat, and we would expect to see a fairly sharp boundary at the crossover point separating an area near the town given over to potato cultivation and a more distant area under wheat. And if more crop choices are available?
It is on the whole obvious that near the town will be grown those products that are heavy or bulky in relation to their value and that are consequently so expensive to transport that the remoter districts are unable to supply them. Here also we find the highly perishable products, which must be used very quickly. With increasing distance from the town, the land will progressively be given up to products cheap to transport in relation to their value.
For this reason alone, fairly sharply differentiated concentric rings or belts will form around the town, each with its own particular staple product.
From ring to ring the staple product, and with it the entire farming system, will change; and in the various rings we shall find completely different farming systems.
These predictions are illustrated in the upper portion of Figure 1.8. Note that the particular form of land use within each concentric ring in this figure reflects the market values and transport costs prevailing for particular kinds of produce in northern Germany in the 1820s. The more general prediction is that zones of land use will array themselves in roughly concentric circles around their primary market, with transport costs and perishability being the main factors determining in which circle each crop or system of land use will appear. Of course, perfect concentric circles will form only under the imaginary condition of perfect isotropy; but even when isotropy is violated to some degree (Figure 1.8, lower portion), the same underlying logic can still be discerned on the ground.
Yields of two different crops net of transport costs as a function of distance from von Thünen’s town.
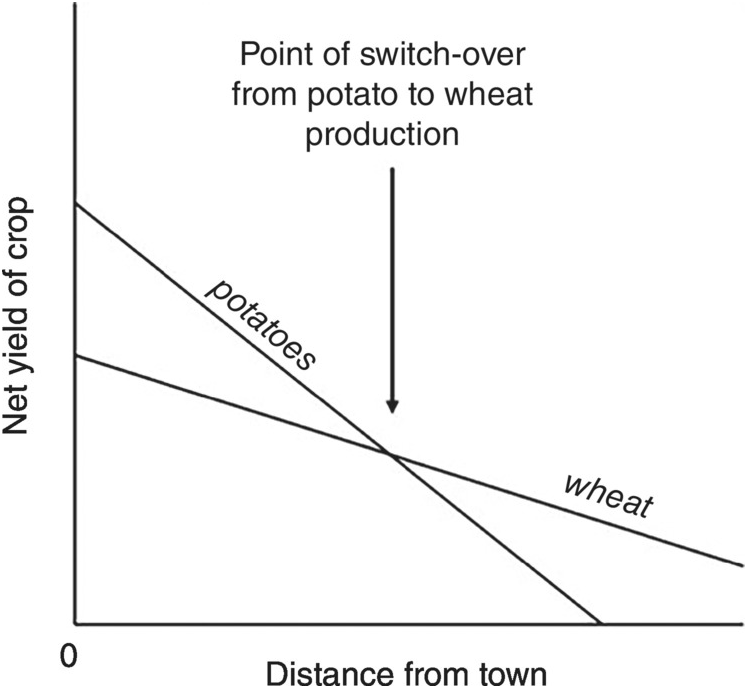

von Thünen’s original model was based on a centralized market system handling crops with fixed cash values. Can it possibly be applied to subsistence agriculture in which nothing is marketed and no urban centers exist? In the early 1960s, the geographer Michael Chisholm generalized von Thünen’s logic beyond its commercial base (Reference Chisholm1962: 21–75). This he did first by calculating costs and income in energetic terms, not in cash value. Next he assumed that the settlement at the center of the whole system was not a large market town, but a single farmstead or a small village or hamlet with its fields arrayed around it; transport costs then involved movement of farmers from their houses to their fields and back again, sometimes lugging produce, sometimes not. He also combined the costs of bringing in the harvest with other travel costs associated with movement between house and field. For example, a farmer might head- or back-load some quantity of manure to a field well before it is ready to be harvested (Figure 1.9). The energetic costs of doing so must be included in the farm’s (i.e. household’s) energy budget. Since the “domestic” is not separate from the “agricultural” in subsistence farming, activities such as hauling fuel for cooking also incur transport costs (Figure 1.10), which influences the farmstead’s location relative to the natural sources of fuel. Most fundamentally, if the farmer must visit a field frequently for weeding, thinning, manuring or any other tender care, it is better if the field is close so that the cost of the frequent visits is minimized. For that reason, fields that are cultivated intensively are expected to lie closer to the farmer’s domicile than fields that do not require everyday care. Thus, according to Chisholm, farming should become less intensive as we move from the inner to the outer rings of the farm-based land-use system.
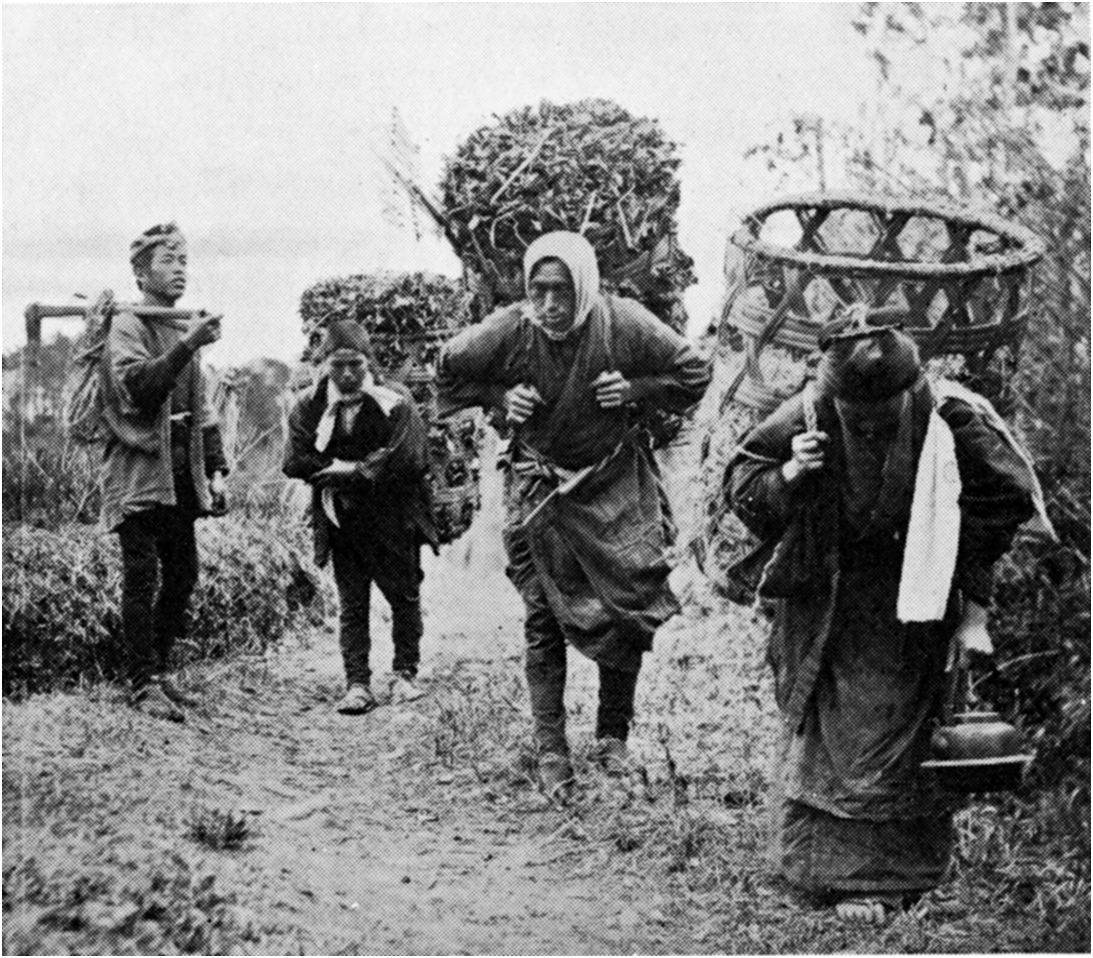
A farm woman carrying peats for fuel, Isle of Lewis, Scotland, c. 1900. The peats are carried in a wickerwork basket (cliabh in Gaelic). Note the woman’s attempt to reduce the opportunity costs of haulage: she is knitting stockings while walking with her load.

Chisholm’s extension of von Thünen’s logic to non-commercial, subsistence-oriented farming was itself an important accomplishment, and numerous studies have demonstrated its usefulness for understanding the spatial organization of traditional agriculture (see Blaikie, Reference Blaikie1971, for an especially good example). Some examples from sub-Saharan Africa are shown in Figure 1.11.
von Thünen in Africa. (A) Observed land-use pattern around a dryland village, Gourjae, eastern Niger. From Grégoire (Reference Grégoire1980) as modified by Mortimore (Reference Mortimore1998: 43), with permission of the Université de Bourdeaux. (B) Observed land-use pattern around a semiarid savanna village, Dobadéné, Chad; “dungland” is the most intensively cropped area.
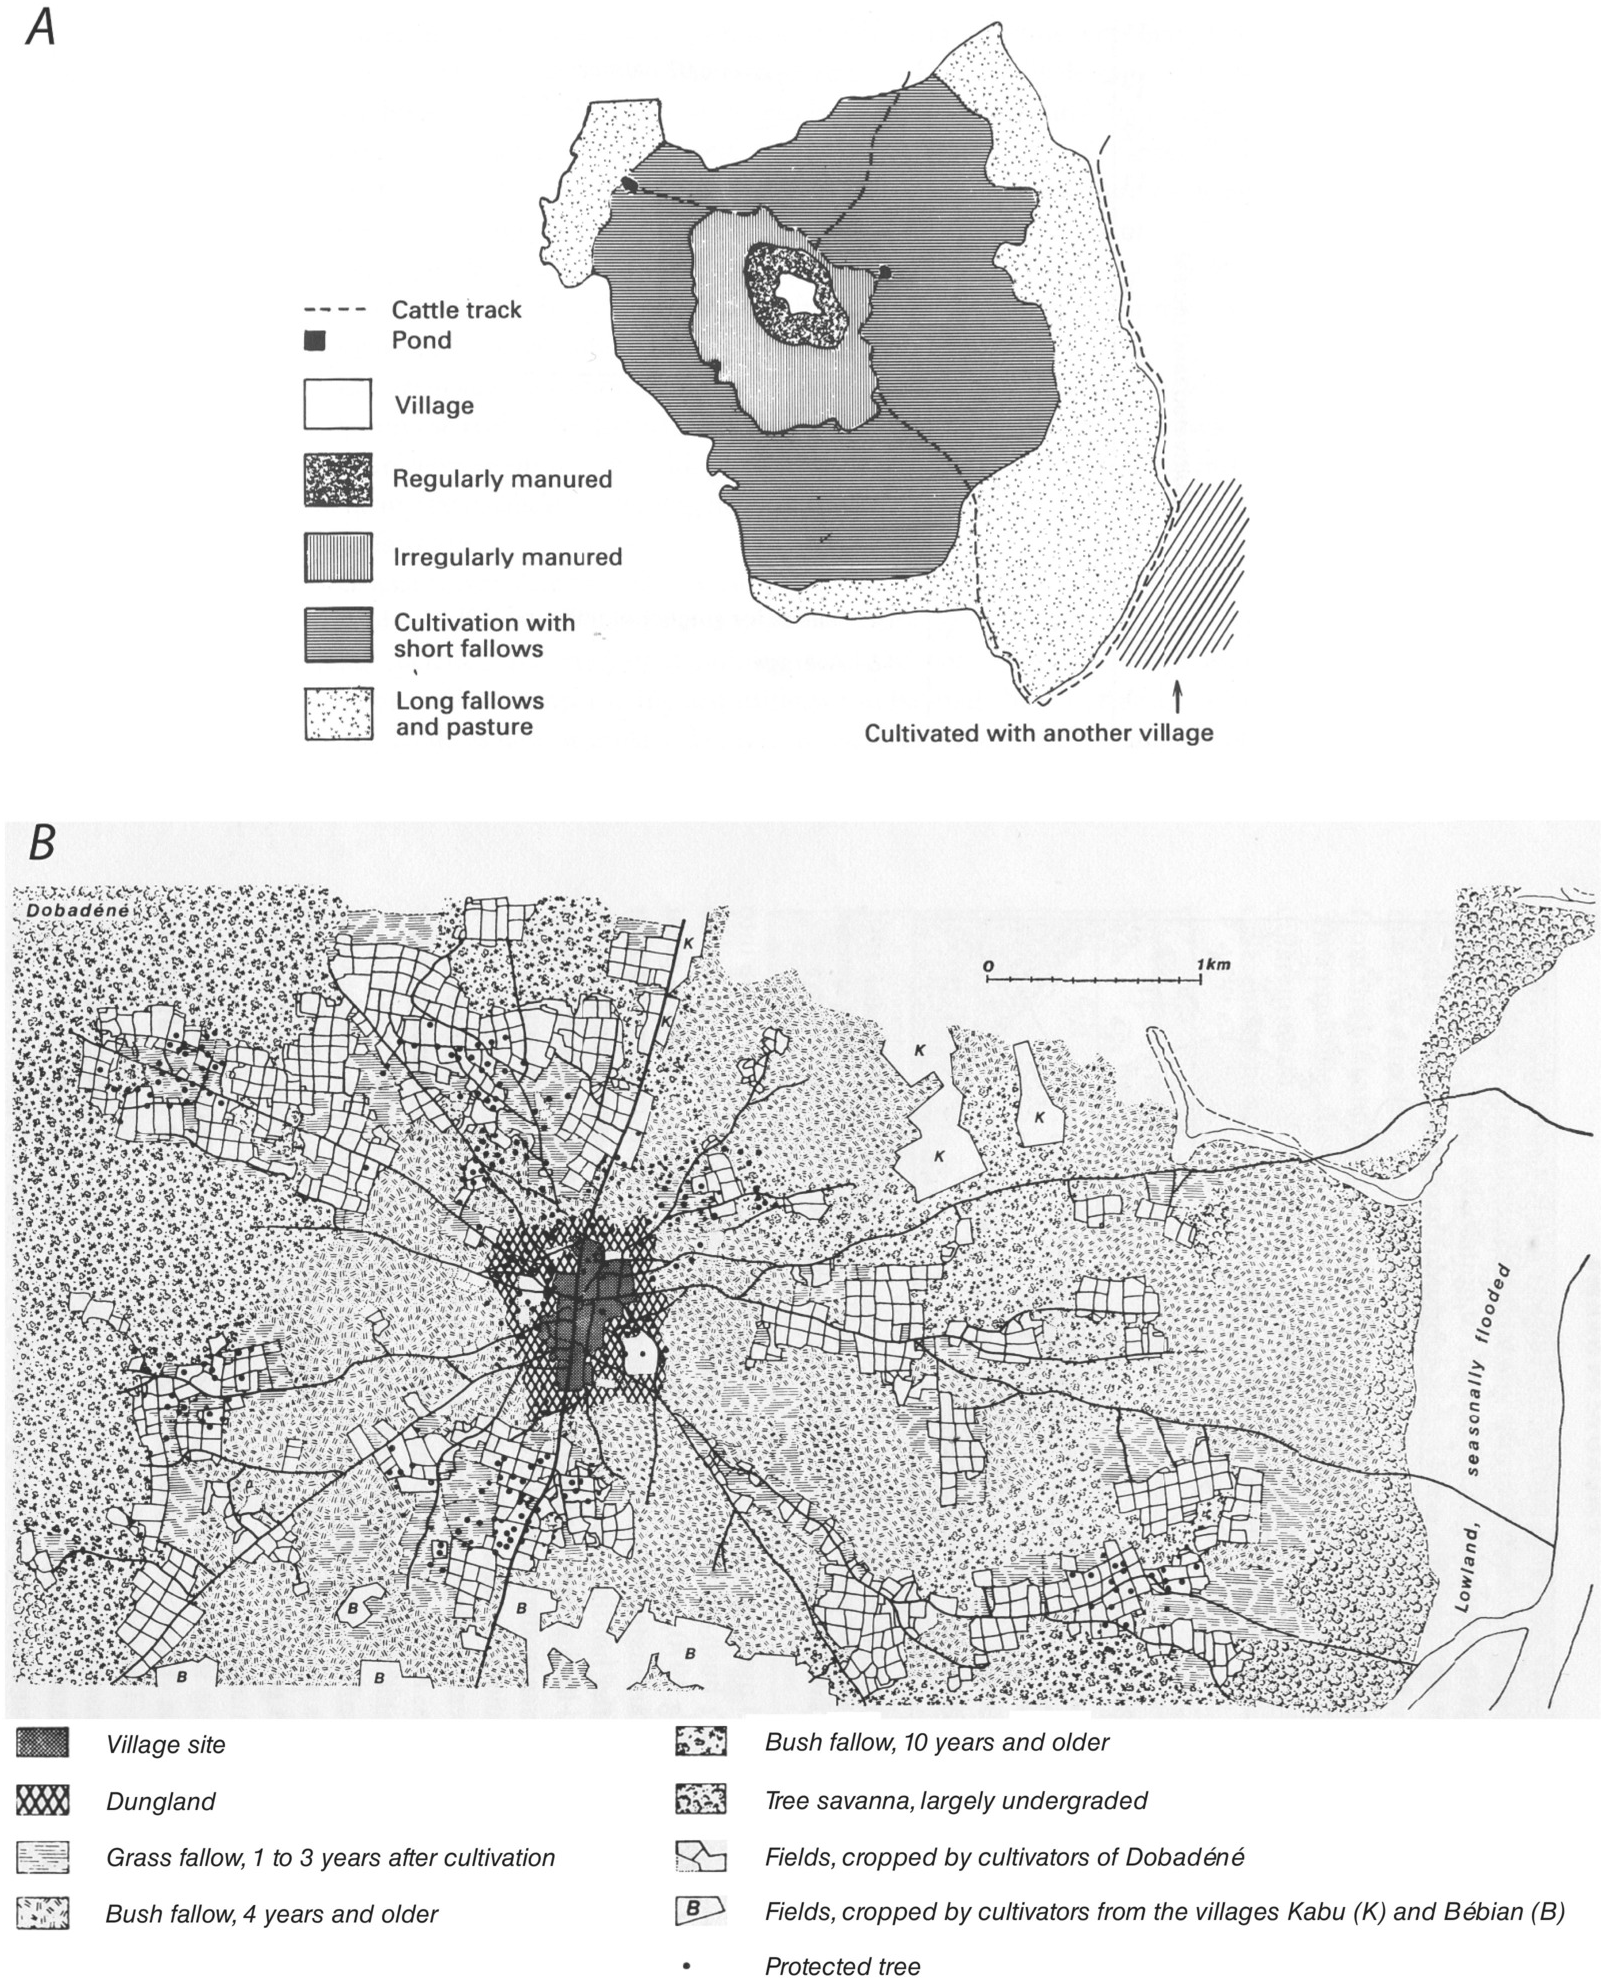
Although not explicitly concerned with population and farming, von Thünen’s model has played a part in the debate over population and agricultural intensification. Figure 1.12, for example, shows the distribution of distances between the birthplaces of spouses for two preindustrial farming communities: shifting cultivators from the rainforests of the Congo Basin, and intensive grain farmers in northern Italy. In both cases, the most common marriage distance is less than 5 km, and the median is less than 20 km. But the distribution for the shifting cultivators has a longer upper tail (note the difference in the right-hand portion of the scale), implying greater mobility over a larger area than is typical of northern Italian farmers. Cavalli-Sforza and Bodmer make much of this difference, taking it as showing in general that, as food production intensifies or population density increases, preindustrial communities become even more localized. Perhaps, but of course these two cases alone do not prove the assertion. Stone (Reference Stone1996), however, has provided a more general model by drawing on von Thünen and Chisholm’s ideas about the spatial organization of farming. His model predicts that intensification of food production was often accompanied by spatial concentration of food production in the pre-modern era of high transport costs (indeed, he uses the two italicized terms interchangeably). As intensification increases, the need to visit fields frequently (to thin, to weed, to manure, to irrigate) increases as well. As a result, the travel and haulage costs to more distant fields become prohibitive. At the same time, the yield of nearby fields becomes high enough to justify abandoning more distant fields. The net result is a greater concentration of farming around the settlement or farmstead (Figure 1.13). Perhaps, then, Cavalli-Sforza and Bodmer were justified in generalizing from the data in Figure 1.12 to claim that, as a general rule, more intensive food production implies lower mobility under preindustrial conditions. Note that we are more inclined to accept this conclusion, not because of additional data, but from the existence of a coherent model.
Distributions of distances between birthplaces of spouses in two preindustrial farming populations. (A) Issongo shifting cultivators, Central African Republic, c. 1965 (population density 1–2 km–2, mean village size 100, 20 percent village endogamy). (B) Intensive farmers in the Upper Parma Valley, northern Italy, c. 1950 (population density 50 km–2, mean village size 300, 55 percent village endogamy).

Increasing spatial concentration of production with increasing intensification of farming (i.e. increasing investments of labor and capital in arable fields), based on the logic of Stone (Reference Stone1996: 29–32).
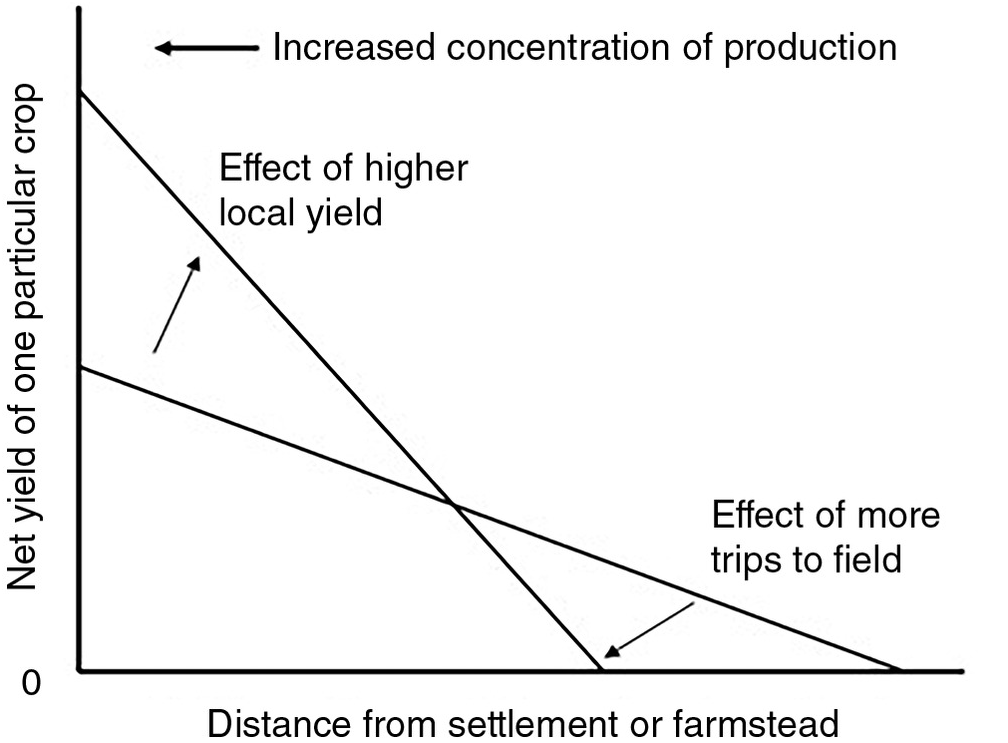
But recall that we are interested in von Thünen here less for his specific model and its predictions and more for what he tells us about the logic of modeling. Here is what he has to say on that subject:
I hope the reader who is willing to spend some time and attention on my work will not take exception to the imaginary assumptions [e.g. isotropy] I make at the beginning because they do not correspond to conditions in reality, and that he will not reject these assumptions as arbitrary and pointless. They are a necessary part of my argument, allowing me to establish the operation of a single factor, a factor whose operation we see but dimly in reality, where it is in incessant conflict with others of its kind.
This method of analysis has illuminated – and solved – so many problems in my life, and appears to me to be capable of such widespread application, that I regard it as the most important matter contained in all my work.
So far as I know, this passage was the first clear expression of a general logic of modeling that is still widely used in the physical, biological and social sciences. The logic, involving holding everything constant in a model while allowing one factor to vary, has come to be called partial equilibrium analysis, sensitivity analysis or the method of ceteris paribus (“all other things being equal”). It allows for something rather like an experiment to be conducted on a schematic representation of reality.
The second half of this book, starting with Chapter 7, constitutes, in effect, a series of partial equilibrium analyses. I present a general, deliberately simplified model of the traditional farming household (a version of which was introduced in this chapter), and I proceed to ignore most of the innumerable variables falling outside the model, just as von Thünen ignored the entire world lying outside his isolated state. Throughout the book I make extensive use of three model-inspired simplifications: (i) I focus on subsistence farming rather than production for the market or compelled by elites, (ii) I assume that individual subsistence farms are largely autonomous when it comes to food production and consumption, and (iii) I pursue the notion that the subsistence farming household is at heart a demographic enterprise. None of these three simplifications provides an absolutely true or complete picture of reality, as is acknowledged throughout the book. But they have all been useful in focusing the enquiry and aiding model development, and they all can be modified or even discarded in future research (in fact, Chapter 12 modifies the second of my three simplifying assumptions).
One particular suite of things that I have chosen to ignore might be sorely missed by some readers – the processes and factors that are often placed under the rubric political economy or political ecology. I have little to say about voracious landlords, oppressive leaders, taxes, tributes, rents, corvée labor, marauding armies, global financiers, even markets for local produce. I choose to ignore these things, not because I think they are never important to traditional farmers. Of course they are important: often enough their effects can dominate the ecology of a farming community. But even those who most strongly argue for the primacy of sociopolitical factors in the origin, evolution and ecology of traditional farming usually acknowledge that population processes are ever-present and important, either as cause or consequence. Thus, my whole intention is to isolate and study what I regard as a universal, if not always completely determinative, set of variables – just as von Thünen highlighted the universal variables distance and transport costs without ever suggesting that these were the only or even the primary factors affecting land use. I want to turn a microscope, so to speak, on the linkages between population and traditional farming even as others train a “macroscope” on the larger social and political context. I am bold enough to suggest that the microscopic view might actually inform and enrich the macroscopic view. It certainly doesn’t replace it.
Having constructed my model, I examine specific features or dimensions of it one at a time while holding the rest of its components constant. I then contemplate how each such partial analysis illuminates the reality of traditional farming in general. The confrontation with reality is, of course, an essential part of the whole modeling strategy. But we should never expect the model to fit the data perfectly – the model is too simplified to do that.Footnote 20 We should hope, however, that the model will help us interpret and make sense of the data. Insofar as it does so, it is a useful model – and that is the sole criterion of the model’s success.Footnote 21 But, no matter how useful a model may be, never forget that it is, at bottom, a lie.