


Introduction
Among survivors of CHD, neurodevelopmental deficits are common and have profound impacts on their future health and quality of life. Patients who undergo cardiopulmonary bypass in infancy are at increased risk of poor neurodevelopment outcomes and should have early, dedicated neurodevelopment evaluation. Reference Sood, Newburger and Anixt1 In practice, there are many barriers to implementing this guidance. Social disadvantages have been found to affect medical outcomes in CHD and can particularly affect the ability of families to access appropriate developmental services. Reference Davey, Sinha, Li, Gauthier and Flores2 Barriers include limited transportation, difficulty obtaining time off for multiple, lengthy appointments, and arrangements for other children in the household. Other factors include the limited availability of sub-specialty appointments and potential gaps in knowledge about these children’s need for specialty screening.
Our study examines the patterns of formal follow-up in our institution’s neurodevelopment clinic and the neurodevelopment outcomes of CHD patients in a rural, underserved, and resource-limited region. We looked at whether area deprivation index was associated with differences in neurodevelopment follow up. Area deprivation index is a composite measure of neighbourhood disadvantage based on income, education, employment, and housing quality. Reference Kind and Buckingham3 We specifically examined the disconnect between scheduled and completed neurodevelopment appointments, as well as factors that may increase the risk of missed appointments and delayed diagnosis for neurodevelopment disorders. Identifying populations at higher risk of never receiving or missing neurodevelopment care can help guide targeted interventions using novel strategies to address these specific gaps in care. This could be particularly impactful in populations facing social disadvantage, as prompt identification and intervention for neurodevelopment delays can help improve an individual’s ability to obtain financial stability in the future with higher levels of education and job readiness. Reference Davey, Sinha, Li, Gauthier and Flores2
Materials and methods
We conducted a single-centre chart review of patients with CHD seen at any point from 2012 to 2024. We did not include patients with simpler lesions such as bicuspid aortic valve or patent ductus arteriosus, as these patients were unlikely to have fallen into the higher-risk cohort for neurodevelopment delay. We recorded multiple medical, demographic, and social parameters to help stratify our population. We also categorised patients based on the complexity of their underlying anatomy into three groups, single ventricle, complex biventricular, and simple biventricular. From this cohort, we collected data about neurodevelopment appointment scheduling and attendance. We collected information about missed appointments as well as completed appointments to help determine which patients have received specialised neurodevelopment care.
We also looked at the prevalence of specific neurodevelopment diagnoses in our population, specifically speech, motor, and global delay, as well as autism and attention deficit or atention deficit with hyperactivity disorder (ADD/ADHD). We designated the age of diagnosis based on the first time a diagnosis appeared in their chart.
Statistical analysis
Descriptive statistics were used to summarise demographic characteristics, CHD classifications, neurodevelopmental outcomes, referral patterns, appointment attendance, and missed visits. Categorical variables were summarised using frequencies and percentages, while continuous variables were summarised using medians and interquartile ranges because several variables demonstrated non-normal distributions.
Comparisons across area deprivation index quartiles were performed separately for state-level and national-level area deprivation index measures. For categorical variables, chi-square tests were used to evaluate overall group differences, and Cochran-Armitage trend tests were used to assess monotonic trends across ordered area deprivation index quartiles. For continuous non-normal variables, Kruskal–Wallis tests were used for overall comparisons, and Spearman rank-based trend tests were used to assess trends across quartiles.
Logistic regression models were used to evaluate associations between area deprivation index quartiles and binary neurodevelopment outcomes, including one or more missed neurodevelopment appointments. Odds ratios with 95% confidence intervals were reported. Unadjusted and adjusted models were performed. Adjusted models included distance from the children’s hospital (>60 miles), race, and Medicaid insurance status as covariates. Quartile 1 (Q1), representing the least deprived neighbourhoods, was used as the reference group for all regression analyses.
For analyses evaluating completion of neurodevelopment visits in the overall CHD cohort, patients were classified as having completed a visit if they had one or more completed neurodevelopment visits recorded. Patients with no completed visits or no neurodevelopment records available were classified as not having completed a visit. All analyses were conducted in R version 4.4.1 (R Foundation for Statistical Computing, Vienna, Austria), and two-sided p values < 0.05 were considered statistically significant.
Results
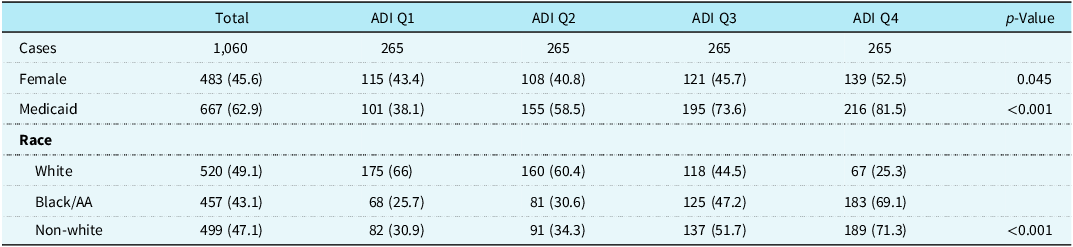
We identified 1,060 patients with a relevant CHD diagnosis seen before age 18 years, with documented social parameters (specifically, an area deprivation index). The complexity of CHD and prevalence of neurodevelopment problems were similar between quartiles. Our cohort was 43% African American and 49% White. The proportion of non-White patients increased with worsening area deprivation index (p < 0.001). Reference Kathiresan, Cho, Bhattacharya, Truong, Hornsby and Natarajan4 There were 667 (63%) patients with Medicaid, and this was also more common with worsening area deprivation index (p < 0.001) (Table 1).
Demographic and clinical characteristics of the CHD cohort overall and by state area deprivation index quartile

Table 1. Long description
The table presents demographic and clinical characteristics of a cohort of children with CHD, broken down by area deprivation index quartiles. It includes 1,060 cases, divided into four quartiles (Q1 to Q4) based on the Area Deprivation Index, with Q1 representing the least deprived areas and Q4 the most deprived. The table has 10 rows and 6 columns. Column headers are Total, ADI Q1, ADI Q2, ADI Q3, ADI Q4, and p-Value. Row labels include Cases, Female, Medicaid, and Race. The Race row is further divided into White, Black/AA, and Non-white. Each cell contains the number and percentage of cases for each parameter within each quartile. Notable trends include an increase in the proportion of non-White patients and those with Medicaid with worsening area deprivation index, both with p-values less than 0.001.
Demographic breakdown of a cohort of children with CHD. Report includes the incidence of each parameter in the entire cohort and then in each area deprivation index quartile. Values are presented as n (%). Area deprivation index quartiles are based on state-level Area Deprivation Index, with Q1 representing the least deprived areas and Q4 representing the most deprived areas. p values compare characteristics across state area deprivation index quartiles only. p values are shown only for selected variables where group comparisons were performed.
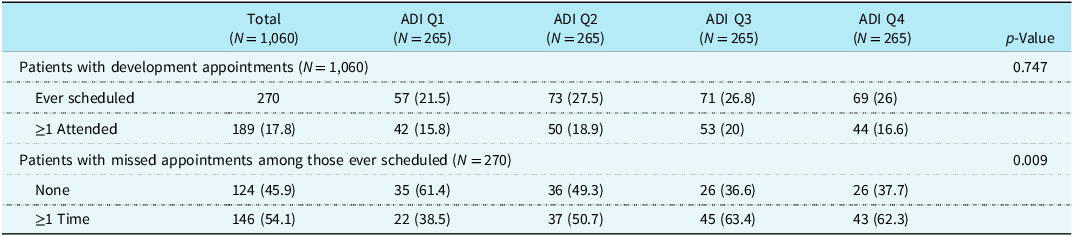
Neurodevelopment appointments were scheduled for 270 patients (25%). Patients who were scheduled for neurodevelopment appointments were broadly similar to the total cohort demographically, although Medicaid coverage was more common among scheduled patients than in the overall cohort (74.8% versus 62.9%).
Patients from more deprived neighbourhoods had slightly higher rates of referral for neurodevelopment evaluation, and they had similar rates of attendance of at least one appointment compared with patients from less deprived areas. When looking at missed clinic appointments (both missed appointments and same-day cancellations), children from more deprived neighbourhoods had higher numbers of at least 1 missed neurodevelopment appointment (p = 0.009) (Table 2).
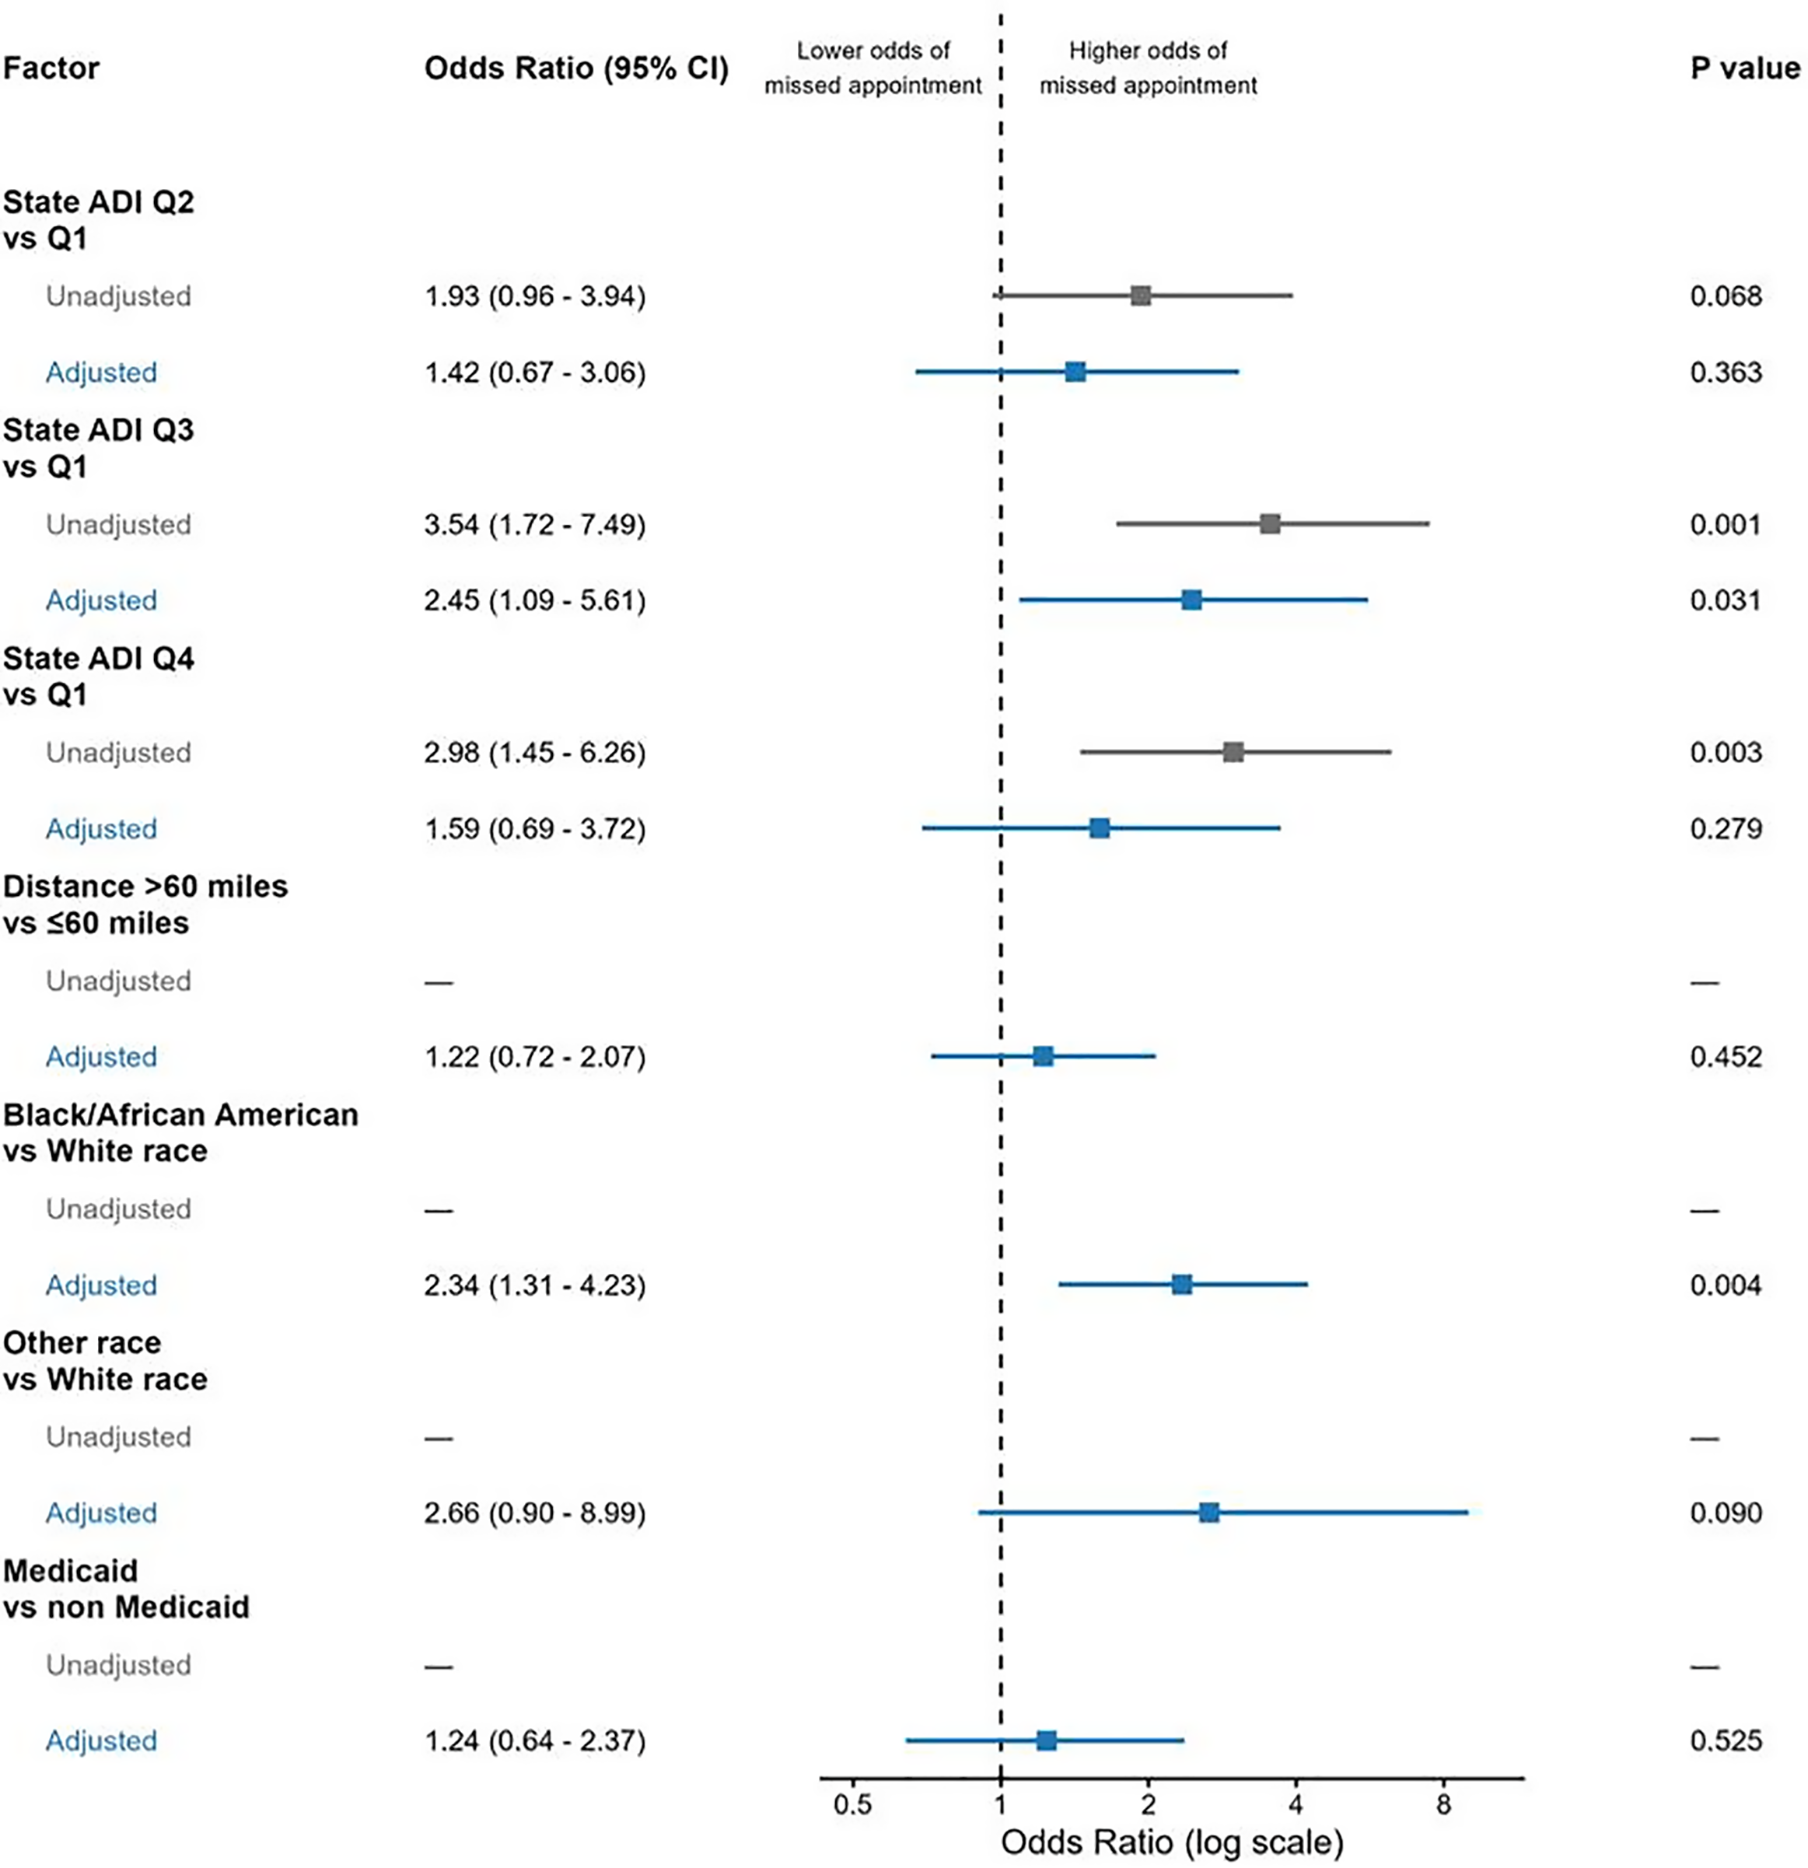
Among patients with scheduled neurodevelopment appointments, higher state-level neighbourhood deprivation was associated with increased odds of missing one or more visits in unadjusted analyses. Compared with children living in the least deprived quartile (Q1), patients in Q3 and Q4 had significantly higher odds of missed appointments (Q3: OR 3.54, 95% CI 1.72–7.49, p = 0.001; Q4: OR 2.98, 95% CI 1.45–6.26, p = 0.003). The association for Q2 did not reach statistical significance (OR 1.93, 95% CI 0.96–3.94, p = 0.068).
After adjustment for distance from the children’s hospital, race, and Medicaid insurance status, the association remained statistically significant for Q3 (OR 2.45, 95% CI 1.09–5.61, p = 0.031), while associations for Q2 and Q4 were attenuated and no longer statistically significant. Black/African American race was independently associated with higher odds of missed appointments (OR 2.34, 95% CI 1.31–4.23, p = 0.004) (Figure 1).
Odds ratios and 95% confidence intervals are shown for unadjusted and adjusted models, with the x-axis displayed on a logarithmic scale. The outcome was having 1 or more missed neurodevelopment appointments, with no missed appointments as the reference category. Reference groups for predictors were State ADI quartile 1, distance ≤60 miles, White race, and non-Medicaid insurance. Adjusted models included State ADI quartile, distance from the children’s hospital, race, and Medicaid insurance status.

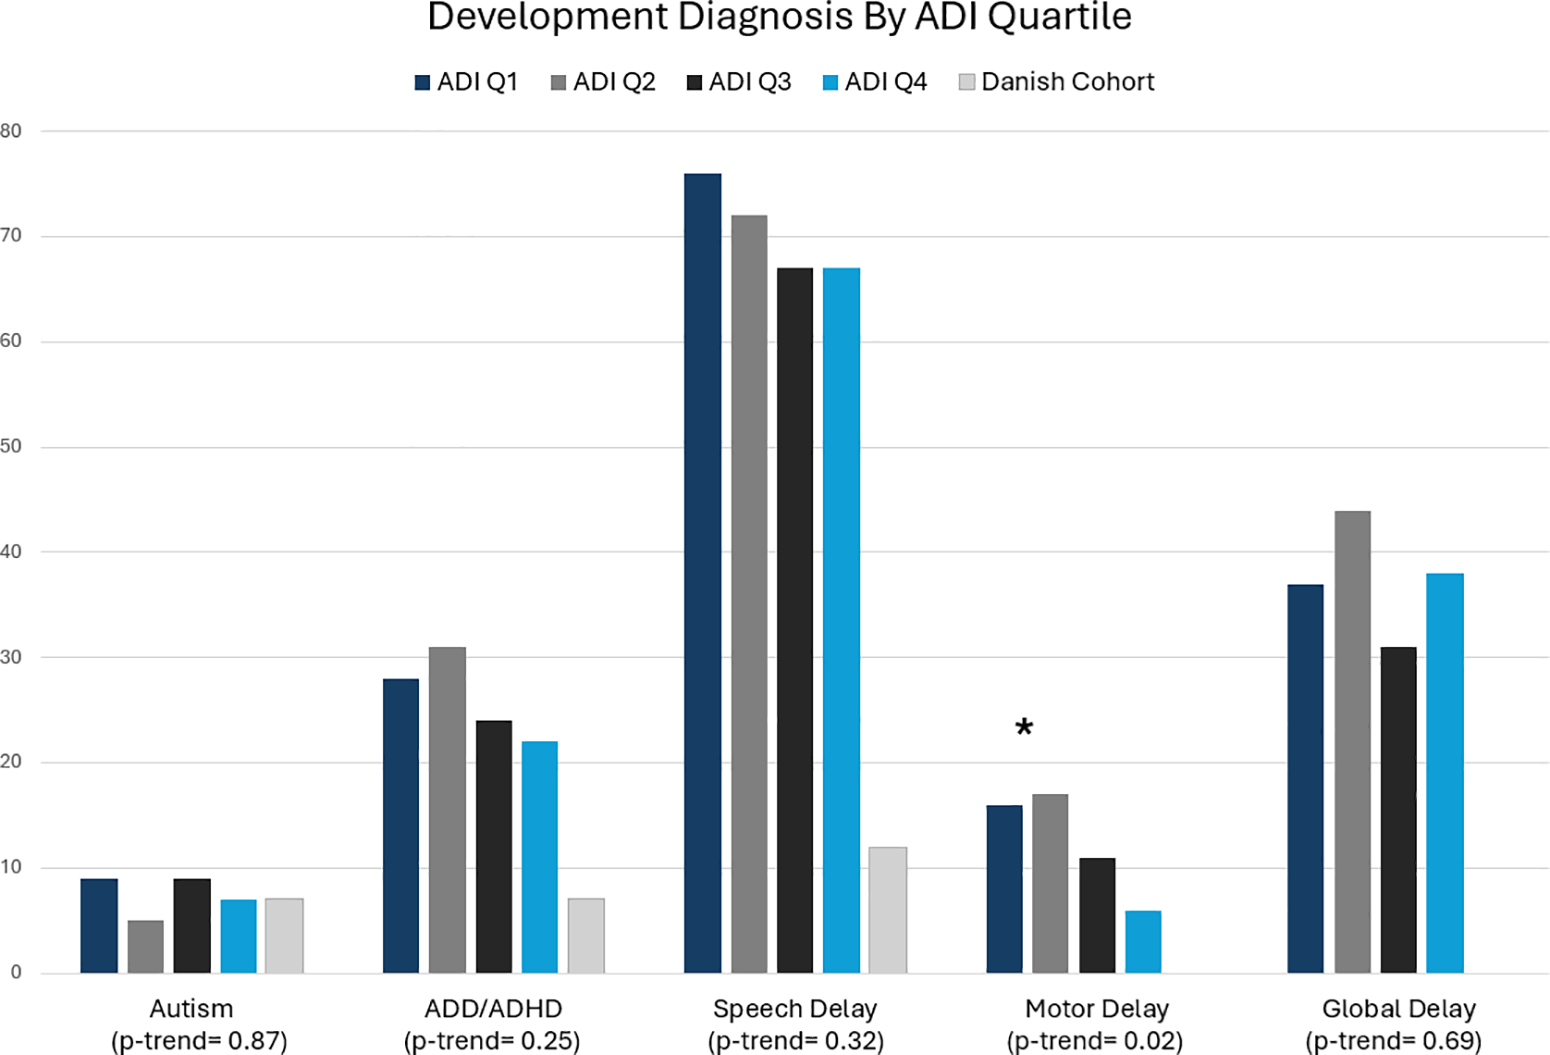
The incidence of most developmental diagnoses was similar between area deprivation index quartiles, except for motor delay, which was uncommon, but most frequently noted in patients from less deprived areas. When comparing the incidence of autism, ADHD/ADD, intellectual delay, and general development disorders (speech and motor delays) to a large cohort from a Danish registry, our cohort had a higher incidence of ADHD/ADD and developmental delay. In our group, 9.9% of patients had ADHD/ADD, compared to 3.2% in the Danish cohort, and over 27% of our patients had some developmental delay, compared to just 4.4% in the Danish cohort Reference Miles, Körmendiné, Laugesen, Sørensen, Kasparian and Madsen5 (Figure 2).
Bar graph showing the incidence of common neurodevelopmental diagnoses in our CHD cohort, with the incidence of each divided among quartiles. For comparison, the incidence of these diagnoses in a large Danish cohort is also shown but not included in the statistical analysis. Among quartiles, only motor delay shows a difference among quartiles, more common in lower quartiles (p = 0.023). In comparison to the Danish cohort, ADD/ADHD and speech/motor delay are more common in our cohort.

We analysed our population for variation in patients receiving late neurodevelopment diagnosis; we classified this as a neurodevelopment diagnosis made after a patient is 5 years of age. We chose the cut-off of 5 years, as most children will enter the school system at this age and will no longer have early intervention services. Late diagnosis was uncommon among patients who eventually received a diagnosis of speech, motor, or global developmental delay. Autism spectrum diagnoses did tend to occur at a later age; the average age of diagnosis in our cohort was 9.3 years (4.4–13.4 years), and in Q4, the average age of diagnosis was 12.6 years, both delayed when compared to the national average of 5 years. Reference van ’t Hof, Tisseur and van Berckelear-Onnes6 Attention deficit and hyperactivity disorders were diagnosed around 8.9 years, and there was little variation among quartiles. This was similar to the general population, where the average age of diagnosis can range from 8– to 17 years, with gender playing a large role in the variance. Reference Dalsgaard, Thorsteinsson and Trabjerg7
Discussion
While overall our neurodevelopment referral rates were comparable to other reported cohorts and consistent across area deprivation index quartiles, our data suggest that patients from more deprived neighbourhoods have a higher risk of missing scheduled neurodevelopment evaluations. Reference Kathiresan, Cho, Bhattacharya, Truong, Hornsby and Natarajan4 This is particularly concerning, as neurodevelopment services are often limited, which amplifies the loss of a missed appointment. There also appears to be a trend toward later diagnosis of autism in our cohort overall, with even later diagnosis in the most deprived communities. Existing literature shows evidence that patients with negative social determinants of health had worse neurodevelopment outcomes, particularly in socialisation, school success, and family quality of life. Reference Davey, Sinha, Li, Gauthier and Flores2 Adding delays in diagnosis, access to care could worsen these outcomes and limit a child’s ability to access appropriate interventions as early as possible. This could translate into problems with medical literacy, employment, and overall quality of life in adulthood. In patients with complex CHD, this could translate into worsened medical outcomes.
Area deprivation index is a potential tool to identify congenital heart patients at increased risk of missing appointments for neurodevelopmental evaluation. This parameter is already integrated into major electronic health records and so could be easy to integrate into risk stratification algorithms. This single variable takes into account several factors that have previously been associated with negative developmental and medical outcomes in patients with CHD and does not rely on patients reporting these concerns. Reference Davey, Sinha, Li, Gauthier and Flores2,Reference Ortinau, Wypji and Ilardi8 Incorporating area deprivation index into clinical workflows may support targeted outreach, and it could also guide the development of innovative strategies to utilise local resources alongside remote healthcare expertise. One such strategy could involve combining telehealth and a hub-and-spoke model to conduct neurodevelopment consultations in a community paediatrician’s office, with a neurodevelopment specialist attending remotely. Having a geographic model for patients at risk could help guide these types of initiatives.
Conclusion
Children with certain CHDs require neurodevelopment evaluation, but rates of neurodevelopment evaluation generally lag behind guidelines. There are likely many barriers to attendance, and our study suggests that area deprivation index may be useful in identifying patients at high risk of missing scheduled neurodevelopment appointments. This measure is commonly tracked in major electronic health records and can account for several important social factors affecting a patient’s care and could be a useful parameter for identifying patients in need of more resources to ensure clinic attendance.
Neurodevelopment appointment scheduling, attendance, and missed appointments across state area deprivation index quartiles

Table 2. Long description
A table with four rows and seven columns comparing neurodevelopment appointment scheduling, attendance, and missed appointments across state area deprivation index quartiles. Column headers are Total (N=1,060), ADI Q1 (N=265), ADI Q2 (N=265), ADI Q3 (N=265), ADI Q4 (N=265), and p-Value. Row labels include Patients with development appointments (N=1,060), Ever scheduled, 1 Attended, Patients with missed appointments among those ever scheduled (N=270), None, and 1 Time. Values are presented as n (%). Notable trends include a higher percentage of patients with missed appointments in the most deprived areas (ADI Q4) compared to the least deprived areas (ADI Q1).
Breakdown of clinic attendance among a CHD cohort. Values are presented as n (%). Area deprivation index quartiles are based on state-level area deprivation index, with Q1 representing the least deprived areas and Q4 representing the most deprived areas. Percentages for “Ever scheduled” and “≥1 Attended” were calculated using the full cohort denominator (N = 1,060). Percentages for missed appointment categories were calculated among patients who had scheduled neurodevelopment appointments (N = 270).
Acknowledgements
Study data were collected and managed using REDCap electronic data capture tools hosted at the University of Mississippi Medical Center. REDCap (Research Electronic Data Capture) is a secure, web-based software platform designed to support data capture for research studies, providing 1) an intuitive interface for validated data capture; 2) audit trails for tracking data manipulation and export procedures; 3) automated export procedures for seamless data downloads to common statistical packages; and 4) procedures for data integration and interoperability with external sources.
Financial support
This research received no specific grant from any funding agency, commercial, or not-for-profit sectors.
Competing interests
None.

 Open access

