




No CrossRef data available.
Article contents
Functional MRI neuroanatomic correlates of the Hooper Visual Organization Test
Published online by Cambridge University Press: 01 November 2004
Abstract
The Hooper Visual Organization Test (VOT), a commonly applied neuropsychological test of visual spatial ability, is used for assessing patients with suspected right hemisphere, or parietal lobe involvement. A controversy has developed over whether the inferences of this test metric can be assumed to involve global, lateralized, or regional functionality. In this study, the characteristic visual organization and object naming aspects of the VOT task presentation were adapted to a functional MR imaging (fMRI) paradigm to probe the neuroanatomic correlates of this neuropsychological test. Whole brain fMRI mapping results are reported on a cohort of normal subjects. Bilateral fMRI responses were found predominantly in the posterior brain, in regions of superior parietal lobules, ventral temporal-occipital cortex, and posterior visual association areas, and to a lesser extent, the frontal eye fields bilaterally, and left dorsolateral prefrontal cortex. The results indicate a general brain region or network in which VOT impairment, due to its visuospatial and object identification demands, is possible to be detected. Discussion is made of interpretive limitations when adapting neuropsychological tests to fMRI analysis. (JINS, 2004, 10, 939–947.)
Information
- Type
- Research Article
- Information
- Journal of the International Neuropsychological Society , Volume 10 , Issue 7 , November 2004 , pp. 939 - 947
- Copyright
- © 2004 The International Neuropsychological Society
INTRODUCTION
The Hooper Visual Organization Test (VOT) (Hooper, 1958) is a commonly applied test of visual perceptual function, which has been applied as a screening instrument for assessing neurological impairments in adolescents and adults, including elderly populations (Gomez-Tortosa et al., 1996; Greve et al., 2000; Love, 1970; Paul et al., 2001; Richardson et al., 1995; Sterne, 1973; York & Cermak, 1995). First introduced in 1958, the test procedure consists of the presentation of 30 line drawings, each showing a common object that has been cut into several pieces and scattered across the page of a test booklet. The subject performing the task is instructed to overtly name the object represented if the pieces were correctly assembled into the original image. Considered a sensitive test for visuospatial and visual organization ability (Hooper, 1983), the cognitive processes are multifactorial, including mental rotation, visual working memory, object identification and name retrieval. Given the high visuospatial demands of the task, the right hemisphere and posterior parietal lobes are presumably involved in the neural substrate (Mesulam, 2000). The object identification and naming demands should involve the ventral temporo–occipital area (Ungerleider & Haxby, 1994). However, considerable controversy has evolved around the question of whether the VOT should be regarded as a measure of global, lateral, or region-specific functional ability. Studies of patients with lateralized brain injuries (Boyd, 1981; Wang, 1977) have concluded that no significance difference exists between lateralization of injury and VOT performance score. Studies which attempted to account for region of lesion sites (Fitz et al., 1992; Lewis et al., 1997) differ in their conclusions, with Fitz et al. claiming a sensitivity to non-dominant parietal lobe involvement, while Lewis et al. reported an increased sensitivity to right frontal lobe.
The object naming aspect of the VOT performance has also received critical review, since subjects that are intact to the visuospatial integration demands may score poorly if they suffer from compromised confrontational naming (Cirillo et al., 1999; Greve et al., 2000; Seidel, 1994). In an attempt to address this issue, a multiple choice derivative of the VOT has been proposed (Schultheis et al., 2000), and test results from the multiple-choice version indicated higher performance scores among anomic subjects.
Functional MRI (fMRI) has been applied extensively within the last decade as a non-invasive means for assessment and localization of brain functionality. Based on the concept of a blood oxygenation level-dependent (Ogawa et al., 1993) endogenous contrast mechanism, fMRI measures regional hemodynamic responses as indicator of neuronal activity. Applied to either individual subjects or population studies, fMRI has been utilized to probe the neuroanatomic basis for the performance of neuropsychological test procedures, including the Stroop (Gruber et al., 2002; Peterson et al., 1999; Zysset et al., 2001), Wisconsin Card Sort Test (Konishi et al., 1999; Monchi et al., 2001; Volz et al., 1997), and n-back tasks (Braver et al., 1997; Callicott et al., 1999; Cohen et al., 1994; Ragland et al., 2002). fMRI has also been applied to visuospatial paradigms (Grön et al., 2000; Ng et al., 2000; Sack et al., 2002; Vannini et al., 2004), object recognition (Kraut et al., 1997; Shen et al., 1998; Sugio et al., 1999), and mental rotation tasks (Carpenter et al., 1999; Cohen et al., 1996; Gauthier et al., 2002; Jordan et al., 2002; Tagaris et al., 1996; Weiss et al., 2003). To date, no published study has examined the VOT with fMRI.
In this study, the characteristic visual organization and object naming aspects of the VOT task presentation were adapted to a fMRI paradigm. The task method was altered to minimize the confrontational naming dependence. A cohort of normal subjects performed the VOT paradigm while being scanned, and group results of their global hemodynamic fMRI responses were mapped to a standard structural template. The intent was to explore the neuroanatomic correlates of the task performance, and thereby provide a means to assess the presumptions of VOT task involvement, both for lateralization and localization. Anatomical mapping of the fMRI responses to the VOT could yield increased understanding of the relevance and applicability of this neuropsychological test to clinical populations.
MATERIALS AND METHODS
fMRI Paradigm
The clinical VOT consists of 30 line drawings, each depicting a simple object which has been cut into two to four pieces and rearranged in a puzzle-like fashion. Respondents are required to name the object. This task was adapted to a visual fMRI presentation by digitizing each of the VOT line drawings and programming them into SuperLab Pro software (Cedrus Corporation, San Pedro, CA). These images were presented to subjects inside the MRI scanner using a laptop computer and LCD projector directed onto a backlit screen. The screen was positioned at the foot of the scanner table, and viewed via an angled mirror incorporated into the MRI head coil. Each of the line drawing trials was serially presented for 6 s, immediately followed by a single word presentation for 4 s (Figure 1). The subjects were instructed to mentally reassemble the picture pieces and covertly name the line drawing during each picture presentation, and then decide whether the following word presentation was the correct name of the object. The subjects indicated with a button press (LUMItouch, Photon Control, Burnaby, British Columbia, Canada) whether or not they thought the word presentation was a correct match for the preceding fractionated line drawing, and a record was kept of response accuracy. The first three VOT presentations were used in a brief practice session prior to the scan start, leaving the final 27 VOT images for the fMRI presentation. The order of the VOT presentations was the same as in the clinical test booklet. Twelve of the 30 VOT trial presentations were pseudo-randomly followed by a correctly matched word presentation. The continuous VOT image/word presentation series was preceded by 28 s and followed by 20 s of blank screen with fixation point, yielding a total fMRI scan time of 5 min, 18 s.

Schematic of fMRI task timing and blocked-diagram reference function. The sequence was repeated for twenty-seven 10-s picture–word pairs presented during each VOT paradigm fMRI scan. Each picture presentation lasted 6 s, followed by a 4-s word presentation. During the word presentation, the subjects responded “yes” or “no” whether the word matched the preceding picture. The reference function for fMRI contrast was “on” for the first 3 s of each picture presentation and “off” during the remaining 7 s of the 10-s epoch.
fMRI Acquisition and Preprocessing
Magnetic resonance image data were obtained with the following equipment: 1.5T scanner (Signa LX; GE Medical Systems, Milwaukee, WI); standard quadrature radiofrequency head coil; single-shot gradient-recalled echoplanar pulse sequence. T2*-weighted images sensitive to blood oxygen level-dependent (BOLD) contrast were acquired during the functional scans with the following parameters: TR/TE = 2000/40 ms; flip angle = 85°; FOV = 24 cm; 64 × 64 matrix; 22 coronal slice locations with 6 mm thickness/1 mm skip yielding whole brain coverage. One hundred fifty-nine time points were continuously acquired for a scan duration of 5 min, 18 s. During the same scan session a set of co-registered high resolution T1-weighted anatomical images were also acquired: 3D SPGR pulse sequence; TR/TE = 21/7 ms; flip angle = 45°; FOV = 24 cm; 256 × 128 matrix; 124 contiguous axial sections with 1.2 mm thickness yielding whole cranial volume coverage.
Statistical Parametric Mapping (SPM99, Wellcome Department of Cognitive Neurology) software was utilized for analysis. Pre-processing steps applied to the fMRI echoplanar images included motion correction, normalization into a Talairach standard atlas space defined by the Montreal Neurological Institute echoplanar template in SPM99, and finally spatial smoothing using a 12-mm full-width at half-maximum Gaussian kernel. The spatial smoothing extent of approximately 3 voxels is consistent with recommendations for cluster-level statistical inferences (Hayasaka & Nichols, 2003).
Data Analysis
After discarding the first four time points in each fMRI scan to allow for equilibrium of magnetization steady-state, time-series analysis was first performed on each participant individually. The analysis applied the general linear model on a voxel-by-voxel basis (Friston et al., 1995). A boxcar model including bandpass filtering for filtration of the high and low frequency signals and convolution with a canonical hemodynamic response function was used in the regression analysis. The onsets of the applied regressor were defined by the timings for the initiation of each VOT image presentation. The regressor durations of each task cycle was specified as 3 s. This 3-s duration was empirically derived after noting that the subjects reported in post-scan debriefing that they were usually able to name the VOT images in less time than the allotted 6 s of image presentation. The resultant t maps were overlaid on a T1 anatomical template for inspection.
Averaged group-level results were obtained by further analysis of the single subject contrast maps with a random effects one sample t-test approach (Friston et al., 1999). Statistical inferences were made at the cluster level threshold of p < .005 (FDR corrected), with a cluster extent threshold of 5 voxels. Suprathreshold voxel clusters were examined using both the SPM “glass brain” and overlaid on a T1 weighted structural volume template for anatomical localization. Lateralization indices were derived to compare volume extents of suprathreshold clusters in regions of right and left hemispheres. The lateralization index was defined by the formula [(left − right)/(left + right)], in units of suprathreshold voxels. With this formula, a positive lateralization value indicates left hemisphere extent predominance, and a negative value indicates right hemisphere predominance. Laterality extent values greater than .200 or less than −.200 were considered significant (Springer et al., 1999).
Gender variations in the fMRI group results were examined by splitting the group into male and female subgroups and utilizing the random effects two sample t test in SPM99. Gender differences were derived by defining contrasts of male > female, and female > male. Parametric modulation of the fMRI response by degree of difficulty was examined with a random effects analysis in the order of task presentation. The VOT items increase in difficulty with the order of presentation.
RESULTS
19 normal volunteers (right handed; 11 male; M age 22.9 years) performed this fMRI paradigm, after first obtaining their informed consent in accordance with local human subjects review board protocols. All subjects had at least 12 years of education, and normal or corrected-to-normal vision. After the fMRI scan session all subjects reported that they had been able to successfully perform the VOT task, with average response accuracy indicated by the button presses at greater than 92% correct. Head motion was less than 50% displacement of a single voxel dimension in any of six angular planes.
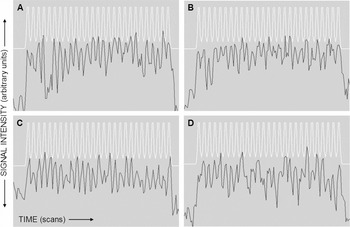
Individual subject fMRI results regularly mapped to bilateral regions of parietal, occipital, posterior inferomedial temporal, and frontal lobes. Of these regions, maximal cluster intensity was typically located in posterior superior parietal lobules, with robust response also indicated for occipital visual association areas. In the majority of subjects the inferior occipital lobe clusters extended along the ventral visual association area tracts to medial posterior temporal lobes. The left frontal lobe response was typically located near the lateral region of precentral sulcus, with suprathreshold voxels in inferior and/or middle frontal gyrus. The right frontal lobe response variably mapped to mediolateral regions of middle frontal lobe, and usually caudal to the left hemisphere fMRI homologue. Figure 2 illustrates signal versus time plots from the average of suprathreshold voxels in 4 representative subjects (2 male, 2 female). Comparison to the smoothed reference function indicates a high temporal correlation with the brief hemodynamic signal responses for each of the 27 task epochs.

Comparison of smoothed reference function (white trace) with fMRI averaged time courses (black trace) from four individual subject exemplars. Scan time is plotted on the horizontal axes, and signal intensity is plotted vertically. Individual subject time courses were derived by averaging the responses from suprathreshold voxels. Subjects A and B were male, C and D were female.
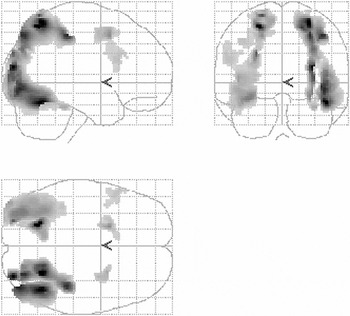
Averaged group results are displayed in Figures 3 and 4. At p < .005 (FDR corrected), extensive suprathreshold voxel clusters are demonstrated in bilateral superior parietal lobules (corresponding to Brodmann area 7), bilateral lateral occipital and posterior medial temporal lobes (Brodmann areas 19 and 37), bilateral middle frontal gyri (Brodmann areas 6 and 9), and left anterior cingulate gyrus (Brodmann area 32). The maximum global fMRI group response (t = 6.11) was located in the left posterior superior parietal lobe cluster, followed by the right posterior superior parietal cluster (t = 6.05). Overlaid on a brain volume template, the bilateral posterior superior parietal clusters have a right extent greater than left regional hemispheric response (Figure 4B, C, D, and F). The laterality index value for the parietal region clusters was −.520, indicating a significant right hemisphere lateralization for these regions. The bilateral lateral occipital and fusiform gyrus responses also indicate a slight right greater than left response (Figure 4B, C, D, and E). The laterality index value for these regions was −.052, showing insignificant right hemisphere predominance. In the frontal lobes, the cluster in left lateral inferior/middle frontal gyrus lies close to Broca's area (Figure 4A, D, and F). The smaller right frontal middle gyrus cluster is relatively medial and slightly caudal compared to the location of the left frontal gyrus response (Figure 4C and F). At this threshold, the only other cluster of fMRI response is indicated near left frontal anterior cingulate gyrus (Figure 4F). The laterality index value for these frontal lobe regions was .217, indicating a slight left hemisphere predominance. Table 1 lists the Talairach coordinates, maximum t values, and anatomical locations for each of the suprathreshold cluster group results.

“Glass brain” 3-dimensional view of suprathreshold clusters normalized to a standard brain template. Group results displayed at FDR-corrected (false discovery rate) p < .005; height threshold T = 3.89; extent threshold = 5 voxels.

Suprathreshold cluster group results normalized and overlaid on a smoothed six-axis view structural brain surface rendering.
Suprathreshold cluster maxima coordinates and locations

No significant gender differences in the group results were seen with either the male > female or female > male contrast at the groupwise FDR-corrected threshold level of p < .005. At a lower threshold of p < .00005 (uncorrected), the males > females contrast yielded a 16-voxel cluster in the posterior cingulate region (Talairach coordinates 4 −48 15), and females > males indicated a 34-voxel cluster in right inferior parietal lobe (44 −35 44). The application of linear parametric analysis over time as an indicator of fMRI response in relation to increasing task difficulty did not yield a significant groupwise cluster, even at a reduced threshold of p < .001 (uncorrected).
DISCUSSION
As indicated by these fMRI results, and as expected considering the complex, multifactorial nature of the task, multiple cognitive regions are implicated in VOT performance. The group fMRI mapping demonstrates an extensive bilateral response across all brain lobes, predominantly posterior, with a significant right hemisphere extent lateralization in parietal lobes. Of these localizations, the fMRI clusters in bilateral superior occipital and posterior superior parietal lobes demonstrate the most robust response. Presumably, these clusters reflect brain regions subserving the visuospatial processes that are the intended focus of the VOT spatial integration construct demands, and have been implicated in previous fMRI studies of visuospatial paradigms (Carpenter et al., 1999; Cohen et al., 1996; Gauthier et al., 2002; Grön et al., 2000; Jordan et al., 2002; Kraut et al., 1997; Ng et al., 2000; Sack et al., 2002; Shen et al., 1998; Sugio et al., 1999; Tagaris et al., 1996; Vannini et al., 2004; Weiss et al., 2003). Extensive clusters in bilateral regions of lateral occipital and posterior inferomedial temporal lobes are similarly robust, and follow the expected ventral visual stream subserving object identification and semantic retrieval (Carpenter et al., 1999; Gauthier et al., 2002; Haxby et al., 1991; Kraut et al., 1997; Shen et al., 1998; Sugio et al., 1999). The left frontal lobe cluster overlays the anatomical region of lateral inferior/middle precentral gyrus that is proximal to Broca's area, and likely represents the covert naming response for the fMRI paradigm. The small bilateral middle frontal gyrus clusters reflect activity in the frontal eye fields for this visual task, and the left anterior cingulate cluster likely represents a response to attention load.
The hemispheric lateralization indexes indicated a significant difference in comparison between parietal regions, with right parietal extent significantly great than left parietal. These lateralization index values are a measure of comparative fMRI spatial extent only, and do not necessarily indicate a segregation or difference between hemispheric functions; that is, it is not known from these results whether right and left parietal regions are involved in similar or different aspects of visuospatial processing. The left frontal region is probably a lateralized linguistic response related to the word-retrieval task demands, but the paradigm was not optimally designed to isolate specific functional responses. The lateralization index values are intended as a comparative measure of global–bilateral fMRI spatial extent.
These spatially extensive fMRI mapping results, at first inspection, could be interpreted as indicating at least a bilateral, and even a global network of functionality for VOT performance. Indeed, it would seem intuitive that without subserving networks of primary and visual association areas, VOT performance would be impaired. Object identification and expressive language are also expected networks of task involvement, since even a simplified multiple-choice or word discrimination paradigm design will still depend on a linguistic operative. However, some important aspects of fMRI assessment and the fMRI paradigm need to be considered.
Unlike lesion studies, or other functional mapping methods such as intraoperative cortical stimulation or transcranial magnetic stimulation, fMRI mapping by itself does not provide a hierarchy of functional organization and connectivity (Sarter et al., 1996). Interference with task performance from either a lesion or one of the mentioned stimulation techniques can be interpreted ad hoc as an indication that the affected region is a critical resource that must be invoked for effective task performance. Compared to these focal stimulation techniques, functional imaging modalities such as fMRI provide an advantageous means of spatially mapping multiple regions that demonstrate a hemodynamic response to a stimulus or cognitive task. But the fMRI indication that distributed cerebral interactions are involved in a psychometric task does not provide direct evidence that a focal region is imperative to the functionality that the test is intended to probe. For example, it is not known from these fMRI group results what the effects of a specific lesion or pathology would have on an individual subject's VOT performance. When assessed within these constraints, these fMRI results can offer evidence of the regions and pathways that are involved in the VOT and by implication the possible neural sources which may be indicated by a performance deficit. Previous studies have attempted to address this issue of differences between functional imaging and lesion studies. Ng et al. (2000) reported a bilateral posterior parietal fMRI participation in a group of normal volunteers performing a modified version of the Benton Judgment of Line Orientation visuospatial task. Comparison was made to a cohort of patients with either right or left parietal lobe damage. The right hemisphere lesion group was found to have a somewhat more severe performance deficit. Sack et al. (2002) reported superior parietal lobule involvement with fMRI mapping during performance of a visually presented spatial judgment task. Task performance was selectively impaired when volunteers were subjected to repetitive transcranial magnetic stimulation (rTMS) of the superior parietal lobules. Hemispheric differences or laterality in the parietal lobes were not reported in the Sack et al. study. Further research will be necessary to determine the correspondence between fMRI mapping results and degree of deficit from localized cerebral damage to performance of either the VOT or other visuospatial task paradigms.
The fMRI paradigm used in this study was an attempt to adapt the VOT method to the constraints of a MRI-compatible presentation and performance. The modification of the normally required overt naming response to a covert word generation and simplified word discrimination task allowed an effective minimization of confounding head movements associated with overt word production. This modification precluded an ability to record confrontational naming task accuracy, and the involvement of networks for overt speech. It is unknown to what extent the modification of the VOT paradigm to exclude overt verbal responses may have affected the fMRI mapping results. Presumably the decreased confrontational naming component of the fMRI paradigm may have affected the extent and magnitude of detected responses in functional language regions. This may have shifted the indices of lateralization or biased the results toward posterior regions. Debriefing of the subjects indicated that they were compliant with the paradigm instruction to covertly generate a word name for the VOT image presentations, and the accuracy of word discrimination responses demonstrated at least some measure of success to the naming performance. This word discrimination modification is similar in effect to the multiple-choice derivative proposed by Schultheis et al. (2000). Accuracy of word discrimination response was not applied as a covariate in the analysis, since the intent of the study was toward a general delineation of the regional responses to the VOT performance. As measured by the word discrimination scores there was a limited range in performance, with all subjects performing very well. Additional investigation with fMRI of subjects who perform poorly on VOT might yield differences for fMRI results in relation to intact subjects, or insights into lesion sites that directly affect VOT performance.
By modeling the fMRI paradigm after the VOT method, some restrictions are applied to the outcome specificity. As previously noted, the fMRI results indicate a general map of regional task involvement, but lack a specific focus to the critical task demands for visuospatial integration ability. The fMRI analysis is based on a simple comparison of (1) a visuospatial task performance condition, during the initial 3 s of each VOT image presentation; and (2) a presumed non-task condition, during the remaining 7 s between presentations. This presumption is based on subjects' post-fMRI debriefing indicating that they were usually able to identify each image during the first few seconds of its presentation. However, the selected control condition during which a reduced amount of visuospatial processing occurred was not devoid of visual stimulus or cognitive effort. The visual stimulus, working memory, and object name recognition processing that occurred during the control condition would be expected to minimize the effects of these operatives within the final contrast results. For example, the lack of primary visual area response mapping could be due to a relative lack of visual stimulus contrast between the conditions. The chosen conditional contrast could be expected to favor the visuospatial VOT demands, at the expense of underestimating the ongoing processes that occur throughout the entire 10 s of each trial.
Similar to the clinical application of the VOT, a self-paced paradigm and appropriate analysis might provide a more accurate representation of task performance timing and resultant hemodynamic response. A modification of the VOT method toward the design of a fMRI paradigm with a controlled non-task stimulus condition could provide additional specificity to the visuospatial task demands. An example of such a paradigm might be to contrast task conditions of the VOT with performance of the Boston Naming Test during the same scan. The similarity in line drawings and confrontational naming demands between the two tests could control for both visual presentation stimulus and language response. The resulting contrast could be presumed to indicate the specific regions involved in visuospatial integration. Alternatively, a paradigm design that contrasts VOT performance with non-stimulus periods of “rest” would be expected to more fully demonstrate visual stimulus and cognitive responses, but at the expense of visuospatial processing specificity. Both fMRI paradigm design approaches of (1) self-pacing, and (2) further stimulus condition control are beyond the scope of this current study, but may warrant additional investigation.
Previous studies showing gender-based differences in fMRI of visuospatial paradigms have been reported, utilizing a maze task (Grön et al., 2000) and mental rotation (Jordan et al., 2002; Weiss et al., 2003). Gender differences were not detected in this study at the groupwise FDR-corrected threshold of p < .005, so no gender effect is observed within the laterality index measures. At a reduced threshold of p < .00005 (uncorrected), the gender-based differences in this study are subtle. While not all the gender-related differences from these previous citation studies were seen with the VOT fMRI paradigm, the posterior cingulate region with male > female contrast (Grön et al., 2000) and right inferior parietal region with female > male contrast (Grön et al., 2000; Weiss et al., 2003) are in agreement. Other previously reported regions of gender-based differences in fMRI of visuospatial paradigms (e.g., right frontal lobe in female > male contrast) that are not observed in this study may be due to different task demands for the VOT performance compared to the tasks of mental rotation or maze navigation employed in the prior reports. It is also possible that the gender imbalance and relatively small sample size of 11 male and 8 female subjects in this study is insufficient to adequately define gender-based differences.
Tagaris et al. (1996) reported a quantitative correlation between mental rotation task difficulty and fMRI responses in superior parietal lobe. fMRI of increasing angular disparity in a mental rotation task has been reported to demonstrate increasing fMRI responses in parietal, frontal, and temporal regions (Carpenter et al., 1999). Gauthier et al. (2002) measured a fMRI increase in superior parietal lobe proportional to viewpoint disparity during mental rotation, but not during object recognition. The VOT task difficulty increases with successive presentations, but parametric analysis of signal increase related to time did not yield a fMRI response correlation. Inspection of averaged time courses from the 4 exemplary subjects in Figure 2 fails to indicate a consistent signal increase during the task duration. The failure to detect a fMRI signal change corresponding to VOT task difficulty may be due to inter-subject variability, insufficient degree of increasing difficulty, or insensitivity of the analysis model to subtle response differences.
In summary, this study is a report on the multiple regional hemodynamic BOLD responses to a fMRI-adapted paradigm of the VOT method. The global and bilateral nature of these mappings indicates that VOT performance involves a complex and extensive network of perceptual, linguistic, and integrative cognition. These findings represent an initial application of fMRI to the neuroanatomic correlates of the VOT, and further study can be expected to elicit enhanced understanding of the brain–behavior relationships specific to this neuropsychological test. Consideration of these fMRI results must be made within the context of potential limitations and differences between functional mapping methods and lesion studies. These results suggest that clinical VOT assessments should be made within the framework of a test battery that provides complementary probes of similar functional abilities.
ACKNOWLEDGMENTS
The authors are grateful for the preliminary insights into VOT clinical methods provided by Dr. Jerry Halsten, of the Dean Medical Center, Madison, WI. Technical assistance was provided by Baxter Rogers, Alan McMillan, and Dr. Orhan Unal, of the University of Wisconsin–Madison Medical Physics Department.
References
REFERENCES
Boyd, J.L.
(1981).
A validity study of the Hooper Visual Organization Test.
Journal of Consulting and Clinical Psychology,
49,
15–19.Google Scholar
Braver, T.S.,
Cohen, J.D.,
Nystrom, L.E.,
Jonides, J.,
Smith, E.E., &
Noll, D.C.
(1997).
A parametric study of prefrontal cortex involvement in human
working memory.
NeuroImage,
5,
49–62.Google Scholar
Callicott, J.H.,
Mattay, V.S.,
Bertolino, A.,
Finn, K.,
Coppola, R.,
Frank, J.A.,
Goldberg, T.E., &
Weinberger, D.R.
(1999).
Physiological characteristics of capacity constraints in working
memory as revealed by functional MRI.
Cerebral Cortex,
9,
20–26.Google Scholar
Carpenter, P.A.,
Just, M.A.,
Keller, T.A.,
Eddy, W., &
Thulborn, K.
(1999).
Graded functional activation in the visuospatial system with the
amount of task demand.
Journal of Cognitive Neuroscience,
11,
9–24.Google Scholar
Cirillo, M.,
Swearer, J.,
Kane, K., &
Lavoie, M.
(1999).
Influence of perceptual organization and naming on the Hooper
Visual Organization Test in an older sample.
Journal of the International Neuropsychological Society,
5,
119.Google Scholar
Coello, E.,
Ardila, A., &
Rosselli, M.
(1990).
Is there a cognitive marker in major depression?
International Journal of Neuroscience,
50,
137–145.Google Scholar
Cohen, J.D.,
Forman, S.D.,
Braver, T.S.,
Casey, B.J.,
Servan-Schreiber, D., &
Noll, D.C.
(1994).
Activation of the prefrontal cortex in a nonspatial working memory
task with functional MRI.
Human Brain Mapping,
1,
293–304.Google Scholar
Cohen, M.S.,
Kosslyn, S.M.,
Breiter, H.C.,
DiGirolamo, G.J.,
Thompson, W.L.,
Anderson, A.K.,
Brookheimer, S.Y.,
Rosen, B.R., &
Belliveau, J.W.
(1996).
Changes in cortical activity during mental rotation. A mapping
study using functional MRI.
Brain,
119,
89–100.Google Scholar
Fitz, A.G.,
Conrad, P.M.,
Hom, D.L.,
Sarff, P.L., &
Majovski, L.V.
(1992).
Hooper Visual Organization Test Performance in Lateralized Brain
Injury.
Archives of Clinical Neuropsychology,
7,
243–250.Google Scholar
Friston, K.J.,
Holmes, A.P.,
Poline, J.B.,
Grasby, P.J.,
Williams, S.C.,
Frackowiak, R.S., &
Turner, R.
(1995).
Analysis of fMRI time-series revisited.
Neuroimage,
2,
45–53.Google Scholar
Friston, K.J.,
Holmes, A.,
Price, C.,
Buchel, C., &
Worsley, K.J.
(1999).
Multisubject fMRI studies and conjunction analysis.
Neuroimage,
10,
385–396.Google Scholar
Gauthier, I.,
Hayward, W.G.,
Tarr, M.J.,
Anderson, A.W.,
Skudlarski, P., &
Gore, J.C.
(2002).
BOLD activity during mental rotation and viewpoint-dependent object
recognition.
Neuron,
34,
161–171.Google Scholar
Greve, K.W.,
Lindberg, R.F.,
Bianchini, K.J., &
Adams, D.
(2000).
Construct validity and predictive value of the Hooper Visual
Organization Test in stroke rehabilitation.
Applied Neuropsychology,
7,
215–222.Google Scholar
Gomez-Tortosa, E.,
del Barrio, A.,
Barroso, T., &
Garcia Ruiz, PJ.
(1996).
Visual processing disorders in patients with Huntington's
disease and asymptomatic carriers.
Journal of Neurology,
243,
286–292.Google Scholar
Grön, G.,
Wunderlich, A.P.,
Spitzer, M.,
Tomczak, R., &
Riepe, M.W.
(2000).
Brain activation during human navigation: Gender-different neural
networks as substrate of performance.
Nature Neuroscience,
3,
404–408.Google Scholar
Gruber, S.A.,
Rogowska, J.,
Holcomb, P.,
Soraci, S., &
Yurgelun-Todd, D.
(2002).
Stroop performance in normal control subjects: An fMRI study.
Neuroimage,
16,
349–360.Google Scholar
Haxby, J.V.,
Grady, C.L.,
Horwitz, B.,
Ungerleider, L.G.,
Mishkin, M.,
Carson, R.E.,
Herscovitch, P.,
Schapiro, M.B., &
Rapoport, S.I.
(1991).
Dissociation of object and spatial visual processing pathways in
human extrastriate cortex.
Proceedings of the National Academy of Sciences of the United
States of America,
88,
1621–1625.Google Scholar
Hayasaka, S. &
Nichols, T.E.
(2003).
Validating cluster size inference: Random field and permutation
methods.
Neuroimage,
20,
2343–2356.Google Scholar
Hooper, H.E.
(1958).
The Hooper Visual Organization Test.
Los Angeles CA:
Western Psychological Services.
Hooper, H.E.
(1983).
The Hooper Visual Organization Test (1983 ed.).
Los Angeles CA:
Western Psychological Services.
Jordan, K.,
Wustenberg, T.,
Heinze, H.J.,
Peters, M., &
Jancke, L.
(2002).
Women and men exhibit different cortical activation patterns during
mental rotation tasks.
Neuropsychologia,
40,
2397–2408.Google Scholar
Konishi, S.,
Kawazu, M.,
Uchida, I.,
Kikyo, H.,
Asakura, I., &
Miyashita, Y.
(1999).
Contribution of working memory to transient activation in human
inferior prefrontal cortex during performance of the Wisconsin Card
Sorting Test.
Cerebral Cortex,
9,
745–753.Google Scholar
Kraut, M.,
Hart, J., Jr.,
Soher, B.J., &
Gordon, B.
(1997).
Object shape processing in the visual system evaluated using
functional MRI.
Neurology,
48,
1416–1420.Google Scholar
Lewis, S.,
Campbell, A.,
Takushi-Chinen, R.,
Brown, A.,
Dennis, G.,
Wood, D., &
Weir, R.
(1997).
Visual organization test performance in an African American
population with acute unilateral cerebral lesions.
International Journal of Neuroscience,
91,
295–302.Google Scholar
Love, H.G.
(1970).
Validation of the Hooper Visual Organization Test on a New Zealand
psychiatric hospital population.
Psychological Reports,
27,
915–917.Google Scholar
Mesulam, M.-M.
(2000).
Behavioral neuroanatomy: Large scale networks, association cortex,
frontal syndromes, the limbic system, and hemispheric
specializations. In
M.-M. Mesulam (Ed.),
Principles of behavioral and cognitive neurology
(2nd ed., pp.
1–173).
New York:
Oxford University Press.
Monchi, O.,
Petrides, M.,
Petre, V.,
Worsley, K., &
Dagher, A.
(2001).
Wisconsin Card Sorting revisited: Distinct neural circuits
participating in different stages of the task identified by
event-related functional magnetic resonance imaging.
Journal of Neuroscience,
21,
7733–7741.Google Scholar
Ng, V.W.,
Eslinger, J.P.,
Williams, S.C.,
Brammer, M.J.,
Bullmore, E.T.,
Andrew, C.M.,
Suckling, J.,
Morris, R.G., &
Benton, A.L.
(2000).
Hemispheric preference in visuospatial processing: A complementary
approach with fMRI and lesion studies.
Human Brain Mapping,
10,
80–86.Google Scholar
Ogawa, S.,
Menon, R.S.,
Tank, D.W.,
Kim, S.G.,
Merkle, H.,
Ellermann, J.M., &
Ugurbil, K.
(1993).
Functional brain mapping by blood oxygenation level-dependent
contrast magnetic resonance imaging. A comparison of signal
characteristics with a biophysical model.
Biophysical Journal,
64,
803–812.Google Scholar
Paul, R.,
Cohen, R.,
Moser, D.,
Ott, B.,
Zawacki, T., &
Gordon, N.
(2001).
Performance on the Hooper Visual Organizational Test in patients
diagnosed with subcortical vascular dementia: Relation to naming
performance.
Neuropsychiatry, Neuropsychology, & Behavioral Neurology,
14,
93–97.Google Scholar
Peterson, B.S.,
Skudlarski, P.,
Gatenby, J.C.,
Zhang, H.,
Anderson, A.W., &
Gore, J.C.
(1999).
An fMRI study of Stroop word-color interference: Evidence for
cingulate subregions subserving multiple distributed attentional
systems.
Biological Psychiatry,
45,
1237–1258.Google Scholar
Ragland, J.D.,
Turetsky, B.I.,
Gur, R.C.,
Gunning-Dixon, F.,
Turner, T.,
Schroeder, L.,
Chan, R., &
Gur, R.E.
(2002).
Working memory for complex figures: An fMRI comparison of letter
and fractal n-back tasks.
Neuropsychology,
16,
370–379.CrossRefGoogle Scholar
Richardson, E.D.,
Nadler, J.D., &
Malloy, P.F.
(1995).
Neuropsychologic prediction of performance measures of daily living
skills in geriatric patients.
Neuropsychology,
9,
565–572.Google Scholar
Sack, A.T.,
Hubl, D.,
Prvulovic, D.,
Formisano, E.,
Jandl, M.,
Zanella, F.E.,
Maurer, K.,
Goebel, R.,
Dierks, T., &
Linden, D.E.
(2002).
The experimental combination of rTMS and fMRI reveals the
functional relevance of parietal cortex for visuospatial
functions.
Cognitive Brain Research,
13,
85–93.Google Scholar
Sarter, M.,
Bernston, G., &
Cacioppo, J.
(1996).
Brain imagning and cognitive neuroscience: Toward strong inference
in attributing function to structure.
American Psychologist,
51,
13–21.Google Scholar
Schultheis, M.T.,
Caplan, B.,
Ricker, J.H., &
Woessner, R.
(2000).
Fractioning the Hooper: A multiple-choice response format.
Clinical Neuropsychologist,
14,
196–201.Google Scholar
Seidel, W.T.
(1994).
Applicability of the Hooper Visual Organization Test to pediatric
populations: Preliminary findings.
Clinical Neuropsychologist,
8,
59–68.Google Scholar
Shen, L.,
Hu, X.,
Yacoub, E., &
Ugurbil, K.
(1998).
Neural correlates of visual form and visual spatial processing.
Human Brain Mapping,
8,
60–71.Google Scholar
Springer, J.A.,
Binder, J.R.,
Hammeke, T.A.,
Swanson, S.J.,
Frost, J.A.,
Bellgowan, P.S.,
Brewer, C.C.,
Perry, H.M.,
Morris, G.L., &
Mueller, W.M.
(1999).
Language dominance in neurologically normal and epilepsy subjects:
A functional MR study.
Brain,
122,
2033–2045.Google Scholar
Sterne, D.M.
(1973).
The Hooper Visual Organization Test and the Trail Making Tests as
discriminants of brain injury.
Journal of Clinical Psychology,
29,
212–213.Google Scholar
Sugio, T.,
Inui, T.,
Matsuo, K.,
Matsuzawa, M.,
Glover, G.H., &
Nakai, T.
(1999).
The role of the posterior parietal cortex in human object
recognition: A functional magnetic resonance imaging study.
Neuroscience Letters,
276,
45–48.Google Scholar
Tagaris, G.A.,
Kim, S.G.,
Strupp, J.P.,
Andersen, P.,
Ugurbil, K., &
Georgopoulos, A.P.
(1996).
Quantitative relations between parietal activation and performance
in mental rotation.
Neuroreport,
7,
773–776.Google Scholar
Ungerleider, L.G. &
Haxby, J.V.
(1994).
‘What’ and ‘where’ in the human brain.
Current Opinion in Neurobiology,
4,
157–165.Google Scholar
Vannini, P.,
Almkvist, O.,
Franck, A.,
Jonsson, T.,
Volpe, U.,
Wiberg, M.K.,
Wahlund, L., &
Dierks, T.
(2004).
Task demand modulations of visuospatial processing measured with
functional magnetic resonance imaging.
Neuroimage,
21,
58–68.Google Scholar
Volz, H.P.,
Gaser, C.,
Hager, F.,
Rzanny, R.,
Mentzel, H.J.,
Kreitschmann-Andermahr, I.,
Kaiser, W.A., &
Sauer, H.
(1997).
Brain activation during cognitive stimulation with the Wisconsin
Card Sorting Test—A functional MRI study on healthy volunteers
and schizophrenics.
Psychiatry Research,
75,
145–157.Google Scholar
Wang, P.L.
(1977).
Visual organizational ability in brain-damaged adults.
Perceptual and Motor Skills,
45,
723–728.Google Scholar
Weiss, E.,
Siedentopf, C.M.,
Hofer, A.,
Deisenhammer, E.A.,
Hoptman, M.J.,
Kremser, C.,
Golaszewski, S.,
Felber, S.,
Fleischhacker, W.W., &
Delazer, M.
(2003).
Sex differences in brain activation pattern during a visuospatial
cognitive task: A functional magnetic resonance imaging study in
healthy volunteers.
Neuroscience Letters,
344,
169–172.Google Scholar
York, C.D. &
Cermak, S.A.
(1995).
Visual perception and praxis in adults after stroke.
American Journal of Occupational Therapy,
49,
543–550.Google Scholar
Zysset, S.,
Muller, K.,
Lohmann, G., &
von Cramon, D.Y.
(2001).
Color-word matching Stroop task: Separating interference and
response conflict.
Neuroimage,
13,
29–36.Google Scholar

Schematic of fMRI task timing and blocked-diagram reference function. The sequence was repeated for twenty-seven 10-s picture–word pairs presented during each VOT paradigm fMRI scan. Each picture presentation lasted 6 s, followed by a 4-s word presentation. During the word presentation, the subjects responded “yes” or “no” whether the word matched the preceding picture. The reference function for fMRI contrast was “on” for the first 3 s of each picture presentation and “off” during the remaining 7 s of the 10-s epoch.
Comparison of smoothed reference function (white trace) with fMRI averaged time courses (black trace) from four individual subject exemplars. Scan time is plotted on the horizontal axes, and signal intensity is plotted vertically. Individual subject time courses were derived by averaging the responses from suprathreshold voxels. Subjects A and B were male, C and D were female.
“Glass brain” 3-dimensional view of suprathreshold clusters normalized to a standard brain template. Group results displayed at FDR-corrected (false discovery rate) p < .005; height threshold T = 3.89; extent threshold = 5 voxels.

Suprathreshold cluster group results normalized and overlaid on a smoothed six-axis view structural brain surface rendering.

Suprathreshold cluster maxima coordinates and locations
 You have
Access
- 21
- Cited by