I. INTRODUCTION
Zirconia (ZrO2) can be partially or fully stabilized by incorporating various contents of yttria (Y2O3) or other aliovalent oxides. This incorporation is accompanied with the formation of oxygen vacancies to maintain local electroneutrality. A concentrated oxygen vacancy gives rise to high oxygen-ion mobility in the stabilized ZrO2 because of the rapid diffusion of oxygen ions by the vacancy mechanism. The fast oxygen ionic conduction with negligible electronic conductivity makes doped-ZrO2 one of the most useful electroceramics for many applications.Reference Minh1 Previous studies reported that the highest ionic conductivity is obtained with 8 mol% Y2O3-stabilized ZrO2, hereafter named 8Y-ZrO2.Reference Cheng, Chang and Hong2,Reference Ormerod3
The 8Y-ZrO2 is an electrolyte with adequate ionic conduction and stability at high temperatures. These attributes make this composition the primary electrolyte used by most SOFC developers and researchers. An SOFC is regarded as a primary electrochemical device for converting the chemical energy in fuels into electrical energy because of its high thermal efficiencies, fuel flexibility, low levels of pollution, and low cost compared with other energy conversion devices. The typical SOFC configuration uses a porous Ni/YSZ cermet as the anode and a porous lanthanum-strontium-manganite (LSM) as the cathode. Planar SOFCs are formed by combining the anode-electrolyte-cathode structure with the stainless steel interconnect that provides an electrical connection.Reference Zhu and Deevi4,Reference Antepara, Villarreal, Rodríguez-Martínez, Lecanda, Castro and Laresgoiti5 However, it is difficult to obtain a hermetic joint between 8Y-ZrO2 and the stainless steel connection because of mismatches in the coefficients of thermal expansion (CTE), volume changes (related to phase transformation), poor wetting (related to surface energy differences), and so forth.
A large mismatch in the CTEs leads to residual stress in the ceramic-metal joint after cooling from the working temperature,Reference Singh, Shpargel and Asthana6 which eventually reduces the strength and reliability of the joints and even creates cracks along the ceramic/metal interface. In general, ferritic steels are used as interconnects for SOFCs operating at a high temperature (800 °C) because they have similar CTEs to that of 8Y-ZrO2.
Despite high CTEs, austenitic steels have high room temperature ductility, creep resistance, and oxidation resistance and a reduced interaction of the interconnect with cathode and anode; therefore, they are potential interconnect materials for SOFCs operating at a relatively low temperature (600 °C). Molin et al. evaluated the potential application of porous stainless steel 316L as a SOFC stack.Reference Molin, Gazda, Kusz and Jasinski7 Niewolak et al. investigated the potential suitability of ferritic and austenitic steels as interconnect materials for SOFCs operating at 600 °C.Reference Niewolak, Wessel, Singheiser and Quadakkers8
The development of a method for fabricating stainless steel/8Y-ZrO2 joints that can withstand the SOFC operating temperatures is of great interest. In the last decade, various methods have been developed to make stainless steel/8Y-ZrO2 joints.Reference Singh, Shpargel and Asthana6,Reference Smeacetto, Salvo, Ferraris, Casalegno and Asinari9–Reference Singh, Shpargel and Asthana11 The methods involving liquid-phase formation, such as brazingReference Singh, Shpargel and Asthana11 and partial transient liquid-phase bonding (PTLPB),Reference Zheng, Lou, Fei and Li12–Reference Qiao, Wang, Gao and Jin15 have received the most attention. In brazing, active elements (Ti, Zr, Hf, etc.) are added to the braze filler to enhance the wettability and form a stable chemical bond. Active brazing with the Ag–Cu–Ti brazing alloy is frequently used to join ceramics and is considered the most effective method.Reference Smorygo, Kim, Kim and Eom16 However, the active elements in the filler increase the brittleness of the joints. These joints most likely remelt below the original bonding temperatures and soften at even lower temperatures, limiting their use in structural applications. In addition, brazing with noble-based metals, such as Au or Ag, significantly increases manufacturing costs.
Solid-state diffusion bonding can also be an effective technique to join metals and ceramics, if suitable interlacing foils are chosen. In this study, a set of Ti/Ni/Ti multilayers, not a commercial interlayer alloy, was used for joining 8Y-ZrO2 and stainless steel 316L below the eutectic temperatures of Ni–Ti and Fe–Ti. Two Ti foils were used as active media to form a chemical bond, whereas the Ni foil, a soft metal, acted as a buffer layer to relieve residual thermal stresses from the large CTE mismatch between ceramic and metal.
Previous studies primarily focused on observing the new phases formed at the interface using secondary electron microscopy (SEM) with a resolution of the micron and submicron scales. In this study, various interfacial microstructures were characterized using the transmission electron microscope with an attached energy dispersion spectrometer (TEM/EDS). An attempt was made to explore the formation mechanism of individual reaction layers, as well as their microstructural development, with the aid of binary phase diagrams.
II. EXPERIMENTAL PROCEDURE
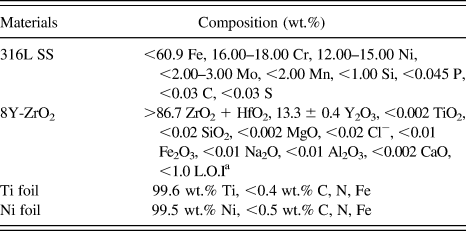
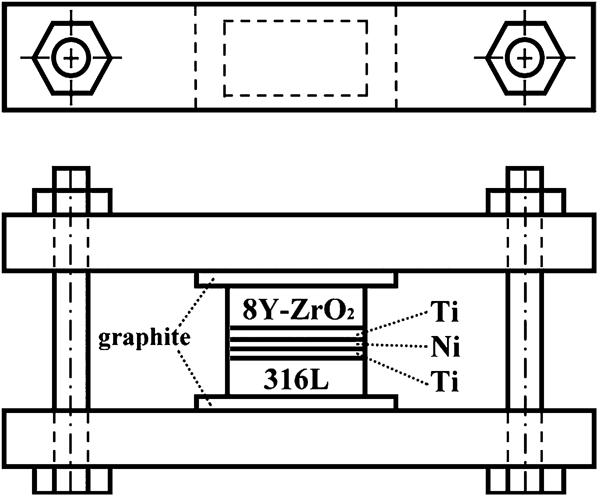
Hot-pressed 8Y-ZrO2 bulks (2 mm thick, CTE: 10.5 × 10⁻⁶/K (25–1000 °C), Chenbros Metal Co. Ltd., Kaohsiung, Taiwan) and stainless steel 316L sheets (5 mm thick, CTE: 16.5–19.5 × 10⁻⁶/K (25–1000 °C), Henan Billions Chemicals Co. Ltd., Calgary, Canada) simulated the electrolyte and the interconnect of an SOFC, respectively. The Ni foil (100 μm thick, CTE: 13.3–16.3 × 10⁻⁶/K (25–900 °C), 99.5 wt.% pure, annealed, Alfa Aesar, Ward Hill, MA) and the Ti foil (50 μm thick, CTE: 8.9–10.1 × 10⁻⁶/K (25–1000 °C), 99.6 wt.% pure, annealed, Alfa Aesar, Ward Hill, MA) were used as the core and outer layers, respectively. The specifications of these starting materials are listed in Table I. Stainless steel 316L and 8Y-ZrO2 specimens were thermally joined with the Ti/Ni/Ti interlayer at 900 °C for 1 h in a tube furnace (Model STF54434C, Lindberg/Blue, Thermo Elec. Inc., Houston, TX). Figure 1 displays the assembly of the specimen and fixture separated with two graphite foils. The specimen was hand tightened by screw and bolt. Prior to joining, the stainless steel 316L specimens were ground with SiC emery papers, and the 8Y-ZrO2 specimens were ground with a 15-μm diamond matted disc on a precision polishing machine (Model Minimet 1000, Buehler Ltd., Lake Bluff, IL). Then, the 8Y-ZrO2 specimens were polished to a 0.5 μm surface finish with a diamond paste using the precision polishing machine mentioned above. All specimens were ultrasonically cleaned in acetone and then air-dried.
Nominal compositions of starting materials.

a L.O.I = loss on ignition.
Experimental assembly.
To prevent the samples from being oxidized, the working chamber was pre-evacuated to 1 × 10⁻⁴ Pa and purged with Ar for at least four cycles. Thereafter, the tube furnace was refilled with an argon protective atmosphere at a slightly positive pressure. The heating rate and the cooling rate of the joint were 5°C/min and 3°C/min, respectively.
Cross-sectional SEM specimens were cut, ground, and polished using the standard procedures described previously.Reference Singh, Shpargel and Asthana11 TEM specimens were prepared using the FIB lift-out technique (FIB, Model Nova 200, FEI Co., Hillsboro, OR).Reference Wang, Kato, Sasaki, Hirayama and Saka17 The TEM specimens were less than 100 nm in thickness and were electron transparent. Prior to the FIB milling, a layer of Pt approximately 1 μm thick was deposited by ion beam chemical deposition using C9H16Pt as a precursor gas. The Pt layer served as a marker and prevented the outer surface of the sample from being directly exposed to the Ga+ ion beam implantation during subsequent ion milling operations. The FIB milling was performed with a Ga+ ion beam at 30 keV. After rough milling (7–1 nA), polishing (0.5–0.1 nA), and final polishing (50–10 pA), a thin foil (17 μm × 2 μm × 0.05 μm) was cut off and transferred to a TEM grid (Formvar/Carbon Coated-Copper 200 mesh) using a micromanipulator for subsequent TEM analyses.
The microstructures of various reaction zones were characterized using a scanning electron microscope (Model JSM 6500F, JEOL Ltd., Tokyo, Japan) and a TEM (Model JEM 2000 FX, JEOL Ltd., Tokyo, Japan), each with an attached energy dispersive spectrometer (Model ISIS 300, Oxford Instrument Inc., London, UK). The Cliff-Lorimer standardless techniqueReference Cliff and Lorimer18 was performed for TEM/EDS to analyze the compositions for the various phases. The crystal structures of various phases were obtained from the analyses of selected area diffraction patterns (SADPs) using computer-simulation software of crystallography (CaRIne Crystallography 3.1, Divergent S. A., Compiègne, France).
III. RESULTS AND DISCUSSION
A. SEM/EDS analyses
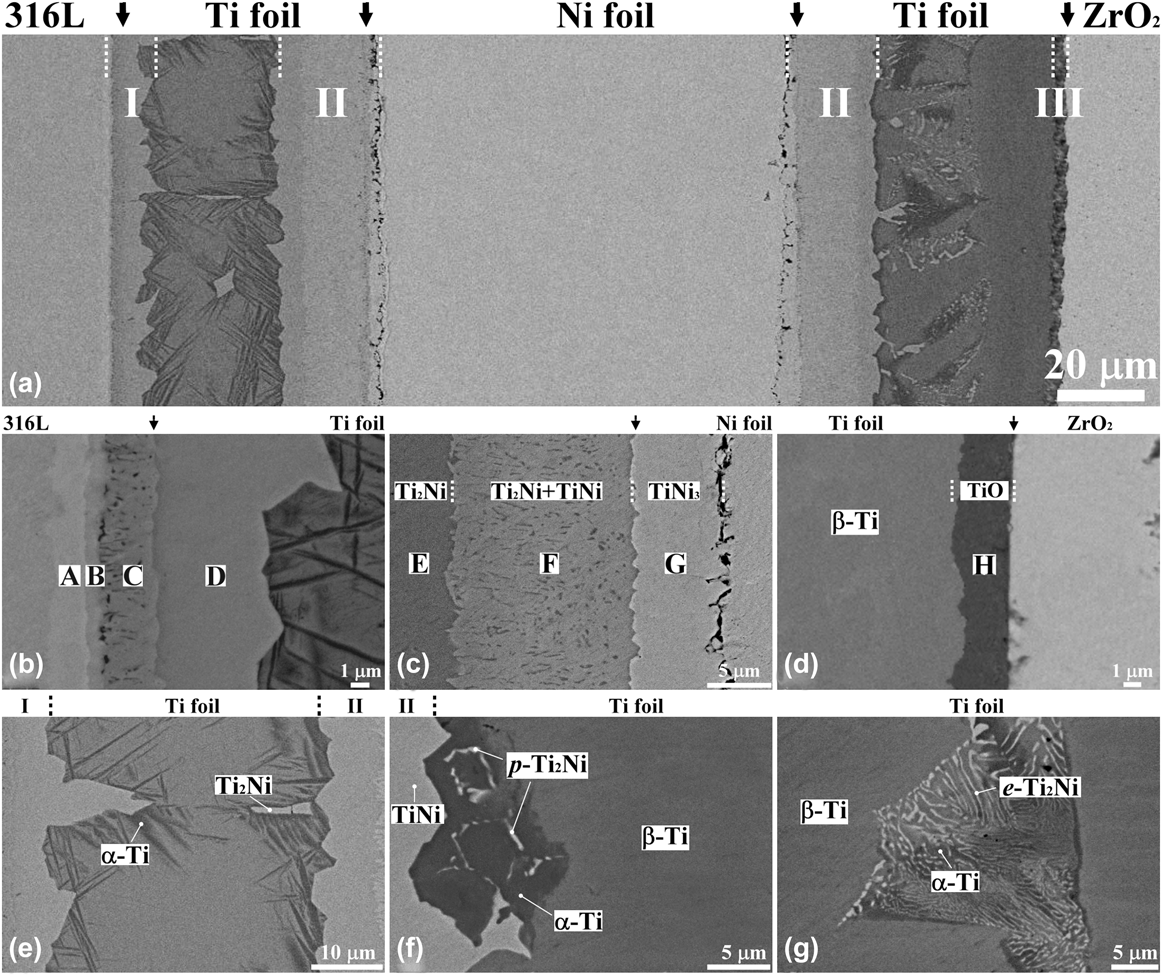
Figure 2(a) displays the backscattered electron image (BEI) of a cross-section of the stainless steel 316L/8Y-ZrO2 joint with a Ti/Ni/Ti multilayer filler after annealing at 900 °C for 1 h. Extended reactions occurred at the stainless steel 316L/Ti, Ti/Ni, and Ti/8Y-ZrO2 interfaces, designated as reaction zones I, II, and III, respectively. Each zone exhibited several further reaction layers, designated as A through G. Figure 2(b) shows the BEI of the stainless steel 316L/Ti interface (zone I), where there were four distinct reaction layers, designated as layers A, B, C, and D, because of the strong chemical affinity of Fe to Ti. Several Fe–Ti intermediate reaction layers formed with a densely dispersed β-Ti phase in layer C. The relative contrast of these layers reflected a decreasing Fe/Ti ratio from the left to right sides because of the atomic number effect of the BEI as shown in Fig. 2(b). Figure 2(c) shows that zone II consisted of three layers, designated as layers E, F, and G, at the Ti/Ni interface. A darker layer (layer E) abutting the Ti foil at the left side consisted of 64.3 at.% Ti and 35.7 at.% Ni, indicating the formation of the Ti2Ni intermediate phase. A bright thin layer (layer G) adjacent to the Ni foil at the right side was composed of 25.8 at.% Ti and 74.2 at.% Ni, corresponding to the TiNi3 intermetallic compound. A two-phase layer (TiNi + Ti2Ni) (layer F) was found between reaction layers E and G. The Ti2Ni formed in layer F most likely precipitated as the second phase in the TiNi matrix during cooling. Extended pores were found at the TiNi3/Ni interface. The Kirkendall effect caused the formation of pores because Ni diffused to the Ti side faster than Ti did to the Ni side.Reference Hinotani and Ohmori19Figure 2(d) displays that zone III was composed of a thin layer, designated as layer H, at the Ti/8Y-ZrO2 interface. This thin layer contained 44.6 at.% Ti, 54.3 at.% O, and 1.1 at.% Zr, indicating the formation of titanium oxide (TiO).Reference Chang and Lin20
(a) SEM BEI micrograph of the interfacial layers of the 316L/8Y-ZrO2 joint with a Ti/Ni/Ti interlayer after annealing at 900 °C for 1 h. In addition, the magnified micrographs of (b) the 316L/Ti interface (zone I), (c) the Ti/Ni interface (zone II), (d) the Ti/8Y-ZrO2 interface (zone III), (e) the residual Ti between 316L and Ni, (f and g) the residual Ti between Ni and 8Y-ZrO2 are shown. The vertical arrows in the upper side indicate the original interfaces. p-Ti2Ni and e-Ti2Ni represent proeutectoid Ti2Ni and eutectoid Ti2Ni, respectively.
Residual Ti and Ni foils were also observed because of their limited reactions at the interfaces of 316L/Ti, Ni/Ti, and Ti/8Y-ZrO2. The two residual Ti foils, which mainly remained as α-Ti and/or β-Ti, exhibited very different microstructures, whereas the residual Ni foil was a single phase with Ti in solid solution. As shown in Fig. 2(e), the residual Ti foil between zones I and II consisted of the mixed α + β Ti structure and Ti2Ni islands. Where a large Ti2Ni grain existed, the neighboring area was depleted of Ni, facilitating the formation of the needle-like α-Ti. The composition of the β-Ti was 94.3 at.% Ti, 3.7 at.% Fe, 1.1 at.% Cr, and 0.9 at.% Ni. The β-Ti retained after cooling from 900 °C existed because it was stabilized by the dissolution of Fe, Cr, and Ni.Reference Ghosh, Bhanumurthy, Kale, Krishnan and Chatterjee21Figures 2(f) and 2(g) show that the residual Ti foil between zones II and III contained three phases, including β-Ti (gray), Ti2Ni (bright), and α-Ti (dark). The retained β-Ti consisted of 88.6 at.% Ti, 10.9 at.% Ni, and 0.5 at.% O. As shown in Fig. 2(f), p-Ti2Ni nucleated and grew at the α-Ti grain boundaries. Figure 2(g) also shows a eutectoid colony with the (α-Ti and e-Ti2Ni) lamellar structure from the hypereutectoid reactions. Here, p-Ti2Ni and e-Ti2Ni represented pro-eutectoid Ti2Ni and eutectoid Ti2Ni, respectively.
IV. TEM/EDS ANALYSES
A. Microstructure of the stainless steel 316L/Ti interface
Figure 3(a) reveals a bright-field image (BFI) of reaction zone I with four reaction layers, i.e., reaction layers A, B, C, and D, adjacent to the stainless steel 316L. The corresponding reaction layer sequence is as follows: σ-phase, TiFe2, TiFe + β-Ti, and Ti2Fe from stainless steel 316L to Ti. As shown in Fig. 3(b), the SADP of reaction layer A indicates that it belonged to the SADP of a tetragonal crystallographic structure along the zone axis of  $\left[ {001} \right]$ with the calculated lattice parameters a = 0.91 nm and c =0.47 nm. Figure 3(c) shows the energy dispersive spectrum (EDS) of reaction layer A, consisting of 54.8 at.% Fe, 35.2 at.% Cr, 3.4 at.% Ti, 2.9 at.% Ni, 2.6 at.% Mo, and 1.1 at.% Cu. Thus, reaction layer A most likely corresponded to a σ-phase (for comparison, σ-FeCr: a = 0.87995 nm and c = 0.45442 nm in JCPDS #50708) with a homogeneity range from 50 to 57.5 at.% Fe, based on the Fe–Cr binary phase diagram. Previous studies indicated that the σ-phase was also found in both Ti/steel and Ti alloy/steel interfaces.Reference Ghosh, Bhanumurthy, Kale, Krishnan and Chatterjee21–Reference Orhan, Khan and Eroglu24
TEM results of the microstructure: (a) morphology of zone I with σ-phase, TiFe2, TiFe + β-Ti, and Ti2Fe layers at the 316L/Ni interface; (b) SADP of the σ-phase with  ${\rm{z}} = \left[ {001} \right]$; (c) EDS of the σ-phase; (d) SADP of TiFe2 with
 ${\rm{z}} = \left[ {2\bar 1\bar 10} \right]$; (e) EDS of TiFe2; (f) SADP of the TiFe with
 ${\rm{z}} = \left[ {111} \right]$; (g) EDS of TiFe; (h) SADP of Ti2Fe with
 ${\rm{z}} = \left[ {0\bar 1\bar 1} \right]$; (i) EDS of Ti2Fe.
Figure 3(d) shows the SADP of the reaction layer B, corresponding to a hexagonal crystallographic structure (MgZn2 type) with the calculated lattice parameters a = 0.50 and c = 0.85 nm. The EDS, as shown in Fig. 3(e), indicates that the phase in reaction layer B contained 51.7 at.% Fe, 32.3 at.% Ti, 10.9 at.% Cr, 2.1 at.% Mo, 1.5 at.% Ni, and 1.5 at.% Cu. From the Darken-Gurry (D-G) map (electronegativity versus metallic radius), high solubility in a specific solvent is predicted if the solute and solvent are close to each other in the periodic table.Reference Gschneidner and Verkade25 The D-G map indicated that the solubility of Cr or Ni in Fe was larger than that of Cr or Ni in Ti.Reference Qin, Hu, Li, Zhao, Liu and Chen26 As mentioned above, the phase in reaction layer B corresponded to the TiFe2 phase with Ti:(Fe + Cr + Ni) = 32:64 ≈ 1:2Reference Qin, Hu, Li, Zhao, Liu and Chen26 (for comparison, TiFe2: a = 0.4785 nm, c = 0.7799 nm in JCPDS #150336).
Reaction layer C was composed of two phases, TiFe and β-Ti. Figure 3(f) illustrates that the SADP of the TiFe phase along the zone axis of [111] corresponded to a simple cubic CsCl structure with the calculated lattice parameter a = 0.30 nm (for comparison, FeTi: a = 0.2975 nm in JCPDS #190636). Figure 3(g) shows that the TiFe phase in reaction layer C was composed of 51.9 at.% Ti, 36.9 at.% Fe, 4.7 at.% Cr, 3.5 at.% Ni, 1.7 at.% Cu, and 1.3 at.% Mo with Ti:(Fe + Cr + Ni) = 52:45 ≈ 1:1.Reference Qin, Hu, Li, Zhao, Liu and Chen26 The other phase (grain size <0.4 μm) found in reaction layer C was identified as β-Ti. The EDS result of the β-Ti in reaction layer C showed that it contained 2.2 at.% Cr, 1.4 at.% Cu, 0.5 at.% Fe, and 0.3 at.% Ni in solid solution. Grot and Spruiell indicated that TiFe decomposed into β-Ti and TiFe during cooling because the composition range of Ti narrowed with decreasing temperature.Reference Murray27
Figure 3(h) illustrates that the SADP of the phase found in reaction layer D represented a complex fcc crystallographic structure with the calculated lattice parameter a = 1.15 nm, which is consistent with the Ti2Ni type structure. Figure 3(i) shows the EDS result of the phase in reaction layer D, consisting of 65.9 at.% Ti, 19.3 at.% Fe, 11.4 at.% Ni, 2.1 at.% Cu, and 1.3 at.% Cr. The result corresponded to the Ti2Fe phase with Cr, Ni, and Mo in solutions [Ti:(Fe + Cr + Ni) = 66:31 ≈ 2:1].Reference Qin, Hu, Li, Zhao, Liu and Chen26 In interdiffusion experiments involving titanium alloy and stainless steel, He et al.Reference He, Zhang and Li28 reported that the formation of Ti2Fe and TiFe occurred adjacent to the titanium alloys, whereas the TiFe2 and the σ-phase occurred adjacent to the stainless steel.
B. Microstructure of the Ti/Ni interface
In Fig. 4(a), the BFI of a two-phase (Ti2Ni + TiNi) region within layer F shows the granular morphology of Ti2Ni, in between layers E and G, after annealing at 900 °C for 1 h. A lamellar morphology of Ti2Ni + TiNi existed adjacent to the Ti2Ni layer, as shown in Fig. 4(b). Figures 4(c) and 4(d) show the SADPs of the Ti2Ni phase along the zone axes of  $\left[ {001} \right]{\rm{ }}$ and
 $\left[ {{{\bar 112}}} \right]$, respectively, corresponding to an fcc crystallographic structure with the calculated lattice parameter a = 1.19 nm (for comparison, Ti2Ni: a = 1.131 nm in JCPDS #720442). From the EDS analyses shown in Fig. 4(e), the composition of the Ti2Ni phase was 66.1 at.% Ti, 30.3 at.% Ni, and 3.6 at.% Cu (Ti:Ni = 66:30 ≈ 2:1). Figures 4(f) and 4(g) show the SADPs of the TiNi phase along the zone axes of
 $\left[ {1{\rm{11}}} \right]$ and
 $\left[ {001} \right]$, respectively, indicating that the phase had a simple cubic structure of the CsCl type with the calculated lattice parameter a = 0.32 nm (for comparison, TiNi: a = 0.2998 nm in JCPDS #180899). Figure 4(h) shows that the TiNi phase consisted of 45.4 at.% Ti, 48.9 at.% Ni, and 5.7 at.% Cu (Ti:Ni = 45:49 ≈ 1:1). Hinotani and OhmoriReference Hinotani and Ohmori19 reported that the structure of TiNi can be cubic or monoclinic and is very sensitive to the compositions. A Ni concentration above 45 at.% results in a cubic TiNi phase, whereas a monoclinic TiNi phase forms below 45 at.% Ni. The granular Ti2Ni, shown in Fig. 4(a), precipitated in the TiNi matrix during cooling, resulting in the formation of the Ni-enriched TiNi matrix. It was inferred that the precipitation of Ti2Ni helped stabilize the cubic TiNi phase in reaction zone II.
TEM results of the microstructure: (a and b) morphology of zone II with the two-phase region of Ti2Ni + TiNi after cooling from 900 °C; (c and d) SADPs of the Ti2Ni phase with  ${\rm{z}} = \left[ {001} \right]\;{\rm{and}}\;\left[ {\bar 112} \right]$, respectively; (e) EDS of the Ti2Ni phase; (f and g) SADPs of the TiNi phase with
 ${\rm{z}} = \left[ {111} \right]\;{\rm{and}}\;\left[ {001} \right]$, respectively; (h) EDS of the TiNi phase.
C. Microstructure of the Ti/8Y-ZrO2 interface
Figure 5(a) shows the BFI of reaction zone III with the TiO phase at the interface adjacent to the ZrO2–x after annealing at 900 °C for 1 h. Figure 5(b) shows the SADP of TiO along the zone axis of  $\left[ {{\rm{011}}} \right]$, indicating that the TiO phase had the B1(NaCl) structure and its lattice parameter was calculated as a = 0.43 nm (for comparison, TiO: a = 0.4185 nm in JCPDS #772170). Figure 5(c) indicates that TiO was composed of 46.0 at.% Ti, 46.1 at.% O, 3.6 at.% Cu, 3.1 at.% Zr, and 1.2 at.% Ga. The peak of Ga was detected because of pollution by the focused ion beam. The c-ZrO2–x was identified by the SADP acquired along the zone axis of
 $\left[ {110} \right]$ as shown in Fig. 5(d). Reflections of the type odd, odd, and even were not allowed for c-ZrO2–x. However, the
 $\left\{ {{\rm{112}}} \right\}$ type reflections appeared in the SADP of c-ZrO2–x because a large concentration of oxygen vacancies changed its structure factor.Reference Lin and Lin29Figure 5(e) shows that the c-ZrO2–x consisted of 56.7 at.% Zr, 31.7 at.% O, 4.6 at.% Ti, 2.4 at.% Cu, and 4.6 at.% Y. The yttrium (the stabilizer of ZrO2) was insoluble in TiO (Fig. 5(c)) and retained in cubic zirconia [Fig. 5(e)]. Zirconia remained as a cubic phase because it dissolved Y2O3 as a stabilizer, leading to the formation of excess oxygen vacancies.Reference Lin and Lin30,Reference Lin, Chang, Lin and Lin31 The TiO, Ti3O, and Ti6O layers formed at the joint interface between the (Cu-18Ga)-Ti melt and ZrO2, whereas the TiO and Ti2O reaction layers appeared at the YSZ/Ag-In-Ti alloy interface at temperatures ranging from 873 to 1150 K.Reference Perevertailo, Loginova and Bagno32,Reference Xue, Wang and Sui33 The existence of the TiO and ZrO2−x indicated that redox occurred between Ti and ZrO2.
TEM results of the microstructure: (a) morphology of the zone III with TiO and c-ZrO2–x at the Ni/8Y-ZrO2 interface; (b) SADP of the TiO with  ${\rm{z}} = \left[ {011} \right]$; (c) EDS of TiO; (d) SADP of c-ZrO2–x with
 ${\rm{z}} = \left[ {110} \right]$; (e) EDS of c-ZrO2–x.
D. Microstructure of residual Ti foils
Figure 6(a) displays a BFI of the needle-like α-Ti in the β-Ti matrix within the residual Ti foil between stainless steel 316L and Ni after annealing at 900 °C for 1 h. The β-Ti, which was stable at 900 °C, could be transformed into α-Ti during cooling. The needle-like α-Ti and the β-Ti were identified as hcp and bcc crystal structures, respectively, from the superimposed SADPs, as shown in Fig. 6(b). The orientation relationship between α-Ti and β-Ti were thus identified as follows:  ${\left[ {0001} \right]_{{\rm{\alpha - Ti}}}}//{\left[ {01\bar 1} \right]_{{\rm{\beta - Ti}}}}$ and
 ${\left( {02\bar 20} \right)_{{\rm{\alpha - Ti}}}}//{\left( {211} \right)_{{\rm{\beta - Ti}}}}$. At a higher magnification, Fig. 6(c) shows fine precipitates of the ω-phase in the β-Ti within the residual Ti between stainless steel 316L and Ni. Figure 6(d) shows the SADPs of the β + ω two-phase region. In addition to the strong bcc reflections of β-Ti, weak sharp spots corresponded to the two variants of the ω-phase (designated as ω1 and ω2). The SADPs were schematically redrawn in Fig. 6(e), with the diffraction spots being indexed, indicating that the orientation relations between the bcc β-Ti matrix and the hcp ω-phase were as follows:
 ${\left[ {1\bar 10} \right]_{{\rm{\beta - Ti}}}}//{\left[ {1\bar 210} \right]_{\rm{\omega }}}$ and
 ${\left( {111} \right)_{{\rm{\beta - Ti}}}}//{\left( {0001} \right)_{\rm{\omega }}}$. From the EDS analyses shown in Fig. 6(f), the β-Ti matrix contained 6.3 at.% β-Ti stabilizers (4.0 at.% Fe, 1.2 at.% Cr, and 1.1 at.% Ni) such that the β-Ti was retained at room temperature.Reference Ghosh, Bhanumurthy, Kale, Krishnan and Chatterjee21 In contrast, the Fe, Cr, and Ni atoms were nearly insoluble in α-Ti. Furthermore, the retained β-Ti with Fe, Cr, and Ni in solid solution resulted in the phase transformation of β → β + ω during cooling, as detailed elsewhere.Reference Hickman34
TEM results of the residual Ti between 316L and Ni after annealing at 900 °C for 1 h: (a) morphology of the acicular α in the β-matrix; (b) SADPs of α-Ti and β-Ti, showing the orientation relationship of  ${\left[ {{\rm{0001}}} \right]_{{\rm{\alpha - Ti}}}}{\rm{//}}{\left[ {{{01\bar 1}}} \right]_{{\rm{ \beta - Ti}}}}$ and
 ${\left( {{{02\bar 20}}} \right)_{{\rm{\alpha - Ti}}}}{\rm{//}}{\left( {{\rm{211}}} \right)_{{\rm{\beta - Ti}}}}$; (c) morphology of the ω precipitates in the β-Ti along with α-Ti; (d and e) SADPs of the β-Ti and ω phase and their schematic diagrams (O, β-Ti; ●, ω1; Δ, ω2) with zone axes of
 ${\left[ {1\bar 10} \right]_{{\rm{\beta - Ti}}}}//{\left[ {1\bar 210} \right]_\omega }$ (A:
 ${\left( {10\bar 10} \right)_{{\rm{\omega }}1}}$, A′:
 ${\left( {000\bar 1} \right)_{{\rm{\omega }}1}}$; B:
 ${\left( {\bar 1010} \right)_{{\rm{\omega }}2}}$, B′:
 ${\left( {000\bar 1} \right)_{{\rm{\omega }}2}}$); (f) EDS of α- and β-Ti in (a).
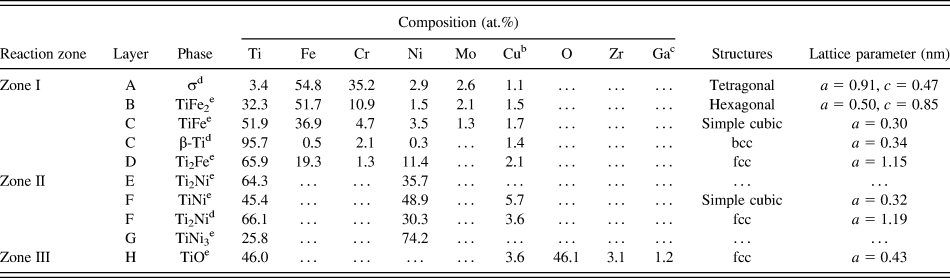
In brief, there were eight distinct reaction layers (A, B, C, etc.) in four distinct reaction zones (I, II, II, and III) of the stainless steel 316L/8Y-ZrO2 joint with the Ti/Ni/Ti interlayer after annealing at 900 °C for 1 h. The compositions, the crystal structures, and the calculated lattice parameters corresponding to various layers are summarized in Table II. At the stainless steel 316L/Ti interface, Fe, Ni and Cr diffused from the stainless steel 316L into the Ti foil to a large extent, whereas a redox reaction occurred at the Ti/8Y-ZrO2 interface. The interfacial reactions led to the formation of various Ti–Fe intermetallic layers and a TiO reaction layer, respectively. In Fig. 2, arrows indicate various original interfaces between different materials. In reaction zone I, it was believed that the original stainless steel 316L/Ti interface was located in the two-phase layer (TiFe + β-Ti, labeled as C) because Mo was nearly insoluble in the Ti foil. In reaction zone II, the original Ni/Ti interface was likely located at the interface of reaction layers F and G because the Kirkendall pores were observed in Ni. In reaction zone III, Y (the stabilizer of ZrO2) was not detected in TiO, indicating the original Ti/8Y-ZrO2 interface abutted a TiO layer (labeled H).
Compositionsa and crystal structures of phases formed at various zones after annealing at 900 °C for 1 h.
a Ti2Ni (E) and TiNi3 (G) were analyzed using SEM/EDS, whereas other results were attained using TEM/EDS.
b Cu was caused by the pollution of the copper ring of TEM specimens.
c Ga was caused by the pollution of the focused ion beam during the preparation of TEM specimens.
d Formed during cooling.
e Formed during brazing.
V. MICROSTRUCTURAL DEVELOPMENT AND PHASE FORMATION MECHANISM
The formation mechanism of individual reaction zones and residual Ti foils, as well as their microstructural development, at the interface of stainless steel 316L and 8Y-ZrO2 are described below.
A. Reaction zone I
Figure 7(a) schematically presents the atomic movement of various species at the stainless steel 316L/Ti/Ni interfaces. Ti diffused into the stainless steel 316L and the Ni foil, whereas Fe, Ni, and Cr diffused into the Ti foil. Because the open structure of β-Ti formed at temperatures exceeding 882 °C, Fe, Ni and Cr atoms (from stainless steel 316L) and Ni atoms (from the Ni foil) traveled a longer distance in the Ti foil than Ti atoms did in the stainless steel 316L or the Ni foil. Figures 7(b) and 7(c) illustrate the correlation between microstructural evolutions and the Fe–Ti binary phase diagramReference Kornilov and Boriskina35 at the stainless steel 316L/Ti interface on annealing. It was assumed that all the compositions at various cross sections along the longitudinal direction perpendicular to the interface could be determined by a horizontal solid-line (a tie line) at a specific temperature. The tie line crossed the fields of α-Fe, α-Fe + TiFe2, TiFe2, TiFe2 + TiFe, TiFe, TiFe + Ti2Fe, Ti2Fe, Ti2Fe + β-Ti, and β-Ti at 900 °C. These regions of α-Fe + TiFe2, TiFe2 + TiFe, TiFe + Ti2Fe, and Ti2Fe + β-Ti on the figure corresponded to the interfaces between α-Fe and TiFe2, between TiFe2 and TiFe, between TiFe and Ti2Fe, and between Ti2Fe and β-Ti, respectively (drawn by dashed lines). The binary phase diagram predicted the formation of the one-phase layer, whereas every two-phase region corresponded to the interface. As a result, the layers of α-Fe, TiFe2, TiFe, Ti2Fe, and β-Ti existed in sequence from stainless steel 316L to Ti in the stainless steel 316L/Ti/Ni joint at 900 °C, as shown in Fig. 7(c). The Ti2Fe compound developed through a peritectoid reaction (TiFe + β-Ti → Ti2Fe) near 1000 °C. Because the austenitic stainless steel 316L (γ-Fe) had 16–18 wt.% Cr, some residual ferrite (α-Fe) existed and facilitated the transformation to the σ-phase during cooling below 820 °C based on the Fr–Cr binary phase diagram.Reference Itkin and Okamoto36 Grot and SpruiellReference Grot and Spruiell37 mentioned that Ti and Mo in solid solutions favored the formation of the σ-phase because of the participation of these elements in the “equivalent Cr content” proposed by Hull.Reference Hull38 Therefore, the σ-phase did not decompose into α-Fe and α-Cr. Moreover, a two-phase layer of TiFe + β-Ti formed at the TiFe2/Ti2Fe interface during cooling because the solubility of Ti in TiFe decreased with decreasing temperature. The precipitation of β-Ti can be expressed by the following reaction:
 $${\rm{T}}{{\rm{i}}_{1 + x}}{\rm{Fe}} \to {\rm{T}}{{\rm{i}}_{1 + y}}{\rm{Fe}} + \left( {x - y} \right){\rm{\beta - Ti}}\quad .$$
Microstructural evolution of the 316L/Ti/Ni/Ti/8Y-ZrO2 joint after annealing at 900 °C for 1 h. (a) An illustration of atomic diffusions at the 316L/Ni interfaces; (b) a tie line drawn in the Ti–Fe phase diagram at 900 °C; (c) the microstructures of 316L/Ti/Ni joint at 900 °C; (d) the 316L/Ti/Ni joint after cooling; (e) an illustration of atomic diffusions at Ni/8Y-ZrO2 interfaces; (f) a tie line drawn in the Ti–Ni phase diagram at 900 °C; (g) the microstructures of Ni/Ti/8Y-ZrO2 joint at 900 °C, and (h) the Ni/Ti/8Y-ZrO2 joint after cooling.
The final microstructure of reaction zone I, formed after cooling from 900 °C, is displayed in Fig. 7(d).
B. Reaction zones II and III
Figure 7(e) schematically illustrates the diffusion of O and Ni atoms toward the Ti foil leading to the formation of various reaction layers at the Ni/Ti and Ti/8Y-ZrO2 interfaces. The Ti–Ni phase diagram was used to explain the microstructure evolution at the Ni/Ti interface as shown in Fig. 7(f). The tie line (solid line) on the Ti–Ni phase diagram crossed the fields of Ni, Ni + TiNi3, TiNi3, TiNi3 + TiNi, TiNi, TiNi + Ti2Ni, Ti2Ni, Ti2Ni + β-Ti, and β-Ti at 900 °C. The interfaces of various reaction layers are represented by the regions Ni + TiNi3, TiNi3 + TiNi, TiNi + Ti2Ni, and Ti2Ni + β-Ti. As shown in Fig. 7(g), the reaction layers of TiNi3, TiNi, Ti2Ni, and β-Ti formed at the Ni/Ti interface adjacent to 8Y-ZrO2 on annealing at 900 °C. Because of the Kirkendall effect, some pores appeared at the interface between Ni and TiNi3.Reference Hinotani and Ohmori19 Because the composition range of TiNi narrowed with decreasing temperature, the Ti2Ni was precipitated so that the two-phase TiNi + Ti2Ni layer (reaction layer F) was observed after cooling. According to the Ni–Ti phase diagram, the precipitation of Ti2Ni or TiNi3 can take place in the TiNi phase because of the decreasing solid solubility of Ni or Ti in the TiNi phase with decreasing temperature.Reference Bastin and Rieck39 However, no TiNi3 precipitates were found in the TiNi matrix because the cooling rate curve did not intersect with the TTT curve. A previous study indicated that TiNi3 occurs as the equilibrium phase at higher aging temperatures and longer aging time.Reference Nishida, Wayman and Honma40 On annealing at 900 °C, the Ni atoms of TiNi (layer F) diffused outwards into the residual Ti, leading to the growth of reaction layer Ti2Ni (layer E). Reaction layer F thus had a columnar TiNi structure, parallel to the direction of Ni diffusion, in reaction zone II. The formation of the columnar TiNi is expressed as follows:
 $${\rm{3TiNi}}_{(\rm{homogeneous})} \to {\rm{TiNi}}_{(\rm{columnar})}\,{\rm{ +\,\, Ti}}_2{\rm{Ni}}_{(\rm{columnar})} + {\rm{Ni}}_{(\rm{diffused\; into\; layer\; E})}\quad .$$
Furthermore, on annealing at 900 °C, the oxidation and reduction reactions led to the formation of TiO and ZrO2–x, respectively. Because Ti had an affinity for O, the reduction of ZrO2 led to the formation of the TiO layer as well as oxygen-deficient zirconia (ZrO2–x), even though the Ellingham diagram indicated that ZrO2 was more thermodynamically stable than TiO2. It was inferred that ZrO2 was not completely reduced to the metallic Zr, and Ti was not oxidized to TiO2, in the partial reduction process mentioned above. Chang et al. reported that the existence of the TiO reaction layer in the diffusion couples of Ti and CaO/ZrO2 composites after reaction at 1550 °C for 6 h dramatically inhibited the diffusion of Zr out of ZrO2–x.Reference Chang and Lin20 The final microstructure of reaction zones II and III after cooling from 900 °C is schematically shown in Fig. 7(h).
C. Two residual Ti foils
On annealing at 900 °C, Fe, Cr, and Ni diffused into the residual Ti foil, which was located between zones I and II. Because Fe, Cr, and Ni were stabilizers for β-Ti, β-Ti was the major phase, as expected. β-Ti was partially transformed into acicular α-Ti on cooling, and the ω-phase precipitated from the retained β-Ti at lower temperatures, based on the following reactions:
 $${\rm{\beta {\hbox-} Ti}} \to {\rm{retained}}\;{\rm{\beta {\hbox-} Ti}} + {\rm{\alpha {\hbox-} Ti}}\;(882^\circ {\rm{C}})\quad ,$$
 $${\rm{\beta {\hbox-} Ti}} \to {\rm{\beta {\hbox-} Ti}} + {\rm{\omega {\hbox-} phase}}\;(450^\circ {\rm{C}})\quad .$$
In addition, the Ti2Ni islands were surrounded by acicular α-Ti in the β-Ti matrix because most of the Ni atoms diffused out of β-Ti grains. For comparison, the β-phase was completely retained in alloys with the critical solute concentrations such as Ti–Ni (7–7.5 at.%), Ti–Fe (7 at.%), and Ti–Cr (12 at.%).Reference Hare and Polonis41 The precipitation of the ω-phase in the residual Ti between the stainless steel 316L and Ni could be attributed to the following factors. First, the diffusion of Fe, Cr, and Ni into the residual Ti foil on annealing made the ω-phase formation thermodynamically favorable. Second, the slow cooling rate (3°C/min) created a favorable kinetic condition for ω-phase formation. Moffat and Larbalestier reported that a higher cooling rate favored the formation of α martensite, but a slower cooling rate favored the formation of the ω-phase in Ti–Nb alloys.Reference Moffat and Larbalestier42 In this study, approximately 5.7 at.% of Fe, Cr, and Ni was dissolved in β-Ti at high temperatures, resulting in the direct transformation of β → β + ω during cooling. The final microstructure of the residual Ti foil between zones I and II after cooling is schematically represented in Fig. 7(g).
The phase transformation of the residual Ti foil between reaction zones II and III is described as follows. The residual Ti foil transformed into the β-phase on annealing at 900 °C with the diffusing O and Ni atoms as solid solutions. The β-phase partially decomposed into a eutectoid structure of α-Ti + Ti2Ni during the subsequent cooling. Based on the Ni–Ti phase diagram, a hypereutectoid reaction is expressed by the following two steps:
 $${\rm{\beta {\hbox-} Ti}} \to {\rm{\beta {\hbox-} Ti}} + p{\rm{ {\hbox-} T}}{{\rm{i}}_2}{\rm{Ni}}\;\left( {{\rm{proeutectoid}}\;{\rm{T}}{{\rm{i}}_2}{\rm{Ni}}} \right)\quad ,$$
 $${\rm{\beta {\hbox-} Ti}} \to {\rm{\alpha {\hbox-} Ti}} + e{\rm{ {\hbox-} T}}{{\rm{i}}_2}{\rm{Ni}}\;\left( {{\rm{eutectoid}}\;{\rm{T}}{{\rm{i}}_2}{\rm{Ni}}} \right)\quad .$$
No ω-phase was found in the residual Ti between Ni and 8Y-ZrO2 because of two factors: (1) Sufficient β-stabilizer (Ni ∼ 10.9 at.%) completely stabilized β-TiReference Hare and Polonis41 and (2) the O addition reduced the volume fraction, the upper temperature limit of formation, and the stability time of the ω-phase.Reference Williams, Hickamn and Leslie43 This result is consistent with the absence of a transitional ω-phase detected in the Ti–Ni alloy.Reference Polonis44 The final microstructure of the residual Ti foil between zones II and III after cooling is schematically shown in Fig. 7(h). The two foils had distinct differences in microstructures.
VI. SUMMARY AND CONCLUSIONS
A Ti/Ni/Ti multilayer was successfully used to bond a stainless steel 316L/8Y-ZrO2 joint after annealing at 900 °C for 1 h in Ar. The microstructures of the various interfaces and the residual Ti were characterized using analytical electron microscopy. Four distinct layers of σ-phase, TiFe2, TiFe + β-Ti, and Ti2Fe were observed at the stainless steel 316L/Ti interface, and three reaction layers of Ti2Ni, TiNi + Ti2Ni, and TiNi3 were observed at the Ti/Ni interface during cooling. The high chemical affinity of Ti for O led to the formation of TiO as well as c-ZrO2–x at the Ti/8Y-ZrO2 interface. A two-phase structure of ω-phase and β-Ti as well as acicular α-Ti was found in the residual Ti between the stainless steel 316L and Ni, where the metastable retained β-Ti contained approximately 5.7 at.% β-stabilizers (Fe, Cr, and Ni). The ω-phase formation mechanism was the outward diffusion of Fe and Cr from the stainless steel into the Ti foil. The ω precipitates nucleated and grew in the β-matrix with the following two variants:  ${\left\langle {1\bar 10} \right\rangle _{{\rm{\beta {\hbox-} Ti}}}}//{\left\langle {1\bar 210} \right\rangle _{\rm{\omega }}}$ and
 ${\left\{ {111} \right\}_{{\rm{\beta {\hbox-} Ti}}}}//{\left\{ {0001} \right\}_{\rm{\omega }}}$. However, no ω precipitate was observed in the other residual Ti between Ni and 8Y-ZrO2, where β-Ti (Ni, O) was retained with some exceptions. A lamellar eutectoid structure (α-Ti and e-Ti2Ni) was also found in the retained β-Ti.
ACKNOWLEDGMENT
This research was supported by the National Science Council (Taiwan) under Contract No. NSC98-2221-E-009-039-MY2.