Implications
Efforts are being made to improve ruminal foods, such as meat and milk, to make them more beneficial for human health. Fat content, with regard to saturated and unsaturated fats, has received a lot of attention. In the present study, the effects of red and white clover silages on fatty acid metabolism in the cow rumen were studied in vitro. Both types of clover silages were found to have similar effects on the fatty acid metabolism, which could potentially be used to determine feed types that could increase concentrations of unsaturated fatty acids in milk.
Introduction
Efforts are being made to improve the properties of ruminal foods products such as meat and milk to obtain a more beneficial fatty acid composition for human health, that is, increased levels of polyunsaturated fatty acids including conjugated linoleic acid (c9,t11-18:2). Conjugated linoleic acid can end up in milk either directly from the rumen or from vaccenic acid (t11-C18:1) through delta 9-desaturase activity in the mammary gland (Wahle et al., Reference Wahle, Heys and Rotondo2004; Or-Rashid et al., Reference Or-Rashid, Wright and McBride2009). Both of these fatty acids exist in the rumen as a result of extensive microbial hydrogenation and isomerization of dietary fatty acids, mainly alpha-linolenic acid (c9,c12,c15-C18:3) and linoleic acid (c9,c12-18:2; Boeckaert et al., Reference Boeckaert, Morgavi, Jouany, Maignien, Boon and Fievez2009; Or-Rashid et al., Reference Or-Rashid, Al-Zahal and McBride2011). Ruminal biohydrogenation pathways of unsaturated C18 fatty acids include several different isomers of unsaturated C18 fatty acids, with reduction in stearic acid (C18:0) being the terminal step (Destaillats et al., Reference Destaillats, Trottier, Galvez and Angers2005). Ruminal biohydrogenation can be influenced by type of feed given to the animal, which in turn may increase or decrease certain fatty acids in the milk produced, altering the contents and composition (Wahle et al., Reference Wahle, Heys and Rotondo2004; Or-Rashid et al., Reference Or-Rashid, Wright and McBride2009). Experiments with dairy cows have shown that red and white clover silages increased concentrations of polyunsaturated fatty acids in milk (Dewhurst et al., Reference Dewhurst, Fisher, Tweed and Wilkins2003). The exact mechanics involved in the effect of different forages on rumen biohydrogenation are not fully understood; however, several modes of action have been suggested including the presence of plant metabolites (Dewhurst et al., Reference Dewhurst, Shingfield, Lee and Scollan2006). The enzyme polyphenol oxidase, present in red clover, has been attributed to reduce lipolysis in the rumen when present, and by doing so reducing hydrogenation as well (Lee et al., Reference Lee, Tweed, Scollan and Sullivan2008; Cabiddu et al., Reference Cabiddu, Salis, Tweed, Molle, Decandia and Lee2010). In addition, condensed tannins may reduce proteolysis, alter the distribution between individual volatile fatty acids produced in the rumen (Burggraaf et al., Reference Burggraaf, Waghorn, Woodward and Thom2008) and inhibit the terminal step of hydrogenation, resulting in an accumulation of vaccenic acid (Khiaosa-Ard et al., Reference Khiaosa-Ard, Bryner, Scheeder, Wettstein, Leiber, Kreuzer and Soliva2009). Tannins can be found at varied levels in legumes such as red and white clover (Patra and Saxena, Reference Patra and Saxena2011). Several models have been suggested for the calculation of in vitro ruminal biohydrogenation and are often simplified, not taking all intermediates into account, as some are difficult to detect and quantify (Jenkins et al., Reference Jenkins, Wallace, Moate and Mosley2008). Estimates of the rate of disappearance, calculated using values only for the one fatty acid observed, found under ruminal in vitro conditions exist for linolenic and linoleic acid in timothy (Boufaied et al., Reference Boufaied, Chouinard, Tremblay, Petit, Michaud and Belanger2003), commercially available fat supplements (Carriquiry et al., Reference Carriquiry, Weber, Baumgard and Crooker2008) and pure fatty acids and linseed oil (Jouany et al., Reference Jouany, Lassalas, Doreau and Glasser2007). The objective of the present study was to study the rate of ruminal biohydrogenation of unsaturated C18 fatty acids in ryegrass and red and white clover silages under in vitro conditions, calculated using a dynamic mechanistic model.
Material and methods
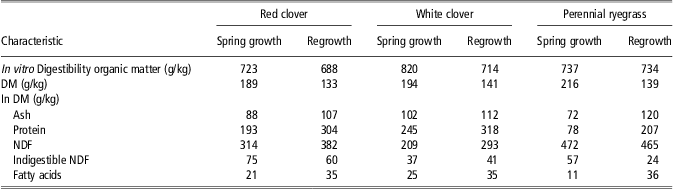
Six different samples of silage were investigated. Silages were produced from either spring growth or third regrowth of red clover (Trifolium pratense, cv Amos), white clover (Trifolium repens, cv Riesling) or perennial ryegrass (Lolium perenne, cv Polim). Forages were sown in plots on a fine Cambisol soil (pH 6.8) at Bredeløkke, Denmark (55°20′N, 12°23′E) on September 4, 2007 and harvested in 2008. Plots were fertilized at seed sowing with 250 kg/ha (21 : 3 : 10 : 4 N/P2O5/K2O/SO3). During the spring and early summer of 2008, the ryegrass was fertilized using 500, 400 and 350 kg/ha of the above fertilizer, and once with 160 kg/ha K2SO4, equalling a total N treatment of 315 kg/ha per year, whereas legumes were fertilized with 315 kg N/ha per year. Spring growth was cut on June 2, and third regrowth was cut on September 3, at 6 cm above ground level. Time from second to third regrowth cut was 36 days. Samples were then ensiled in laboratory scale as described by Nielsen et al. (Reference Nielsen, Kristensen and Weisbjerg2007). Every type of grass weighing 1 kg each, dried at 30°C in an air-dry oven to obtain a dry matter of 25%, was placed in a vacuum bag and stored for 91 days at 19°C in a dark room. Ensiled samples were then stored at −20°C until use. Characteristics of the different forages and cuts before ensiling are shown in Table 1. Dry matter and pH of the different forages and cuts after ensiling are shown in Table 2. Dry matter was determined by drying plant samples at 60°C for 48 h in an air-dry oven. Dried samples were ground through a 1.5 mm mesh for analysis of indigestible NDF (iNDF), and through a 1.0 mm mesh for analysis of ash, NDF, protein and in vitro digestibility. iNDF was determined in situ as the NDF residue after 288 h of rumen incubation in 12 μm Dacron bags. Ash was analysed after heating to 525°C (AOAC, 2000). NDF was analysed as ash free, with addition of heat-stable amylase and sodium sulphite using a Fibertec according to the method of Mertens (Reference Mertens2002). CP was calculated based on the analysis of total N, according to the Dumas principle (Hansen, Reference Hansen1989). In vitro digestibility of organic matter was analysed using the two-step rumen fluid method described by Tilley and Terry (Reference Tilley and Terry1963). Fatty acids were analysed as detailed for in vitro samples, with the difference that samples were cut in a blender and air-dried, rather than freeze-dried, and that all fatty acid methyl ester peaks were added together. All silage samples used for in vitro hydrogenation were freeze-dried and ground through a 0.5 mm mesh for easier handling.
Characteristics of harvested plants before ensiling
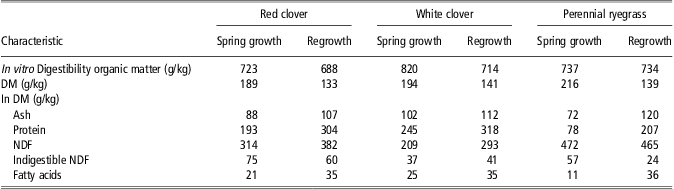
DM = dry matter.
Characteristics of harvested plants after ensiling

DM = dry matter.
In vitro incubation
The in vitro method used was a modified version of the one described by Tilley and Terry (Reference Tilley and Terry1963). Rumen fluid was obtained from two dry Holstein cows with rumen fistulas on a continuous diet of 23% barley straw, 46% grass hay and 31% concentrate mixture (10% soy bean meal, 40% barley, 40% oat, 3% rape seed meal, 3% sugar beet molasses and 4% minerals). Rumen fluid was filtered through two layers of cheese cloth, and in equal parts from each animal, mixed with a physiological buffer (pH 6.8 to 6.9, 0.036 mol/l Na2HPO4 2H2O, 0.012 mol/l NaHCO3, 0.008 mol/l NaCl, 0.008 mol/l KCl, 0.0006 mol/l MgCl2 6H2O, 0.0004 mol/l CaCl2 2H2O) at a 1 : 5 ratio. The mixture was purged with nitrogen gas before use. For each sample unit, 10 ml of rumen–buffer mixture was used and mixed with 0.1 g freeze-dried silage. The sample units were 20 ml glass containers that were purged with nitrogen gas, followed by the addition of silage samples and rumen–buffer mixture in a batch culture approach. The sample units were then sealed and gently stirred. Sample units were incubated at 39°C for 0, 2, 4, 6, 8 and 24 h. After incubation, sample units were placed on ice to stop fermentation and were frozen. The entire sample containing silages, buffer and rumen fluid was subsequently freeze-dried and stored at −20°C until analysis. In vitro runs were performed in triplicates, with at least 5 days between each run. For each run, a control sample was run containing only buffer and rumen fluid.
Fatty acid analysis
For analysis of fatty acids, freeze-dried samples were mixed with 1 ml heptane with C12:1 triglyceride as internal standard. Methylation was carried out using 1.5 ml of 10% methanolic HCl at 90°C for 2 h (Palmquist and Jenkins, Reference Palmquist and Jenkins2003). Separation and identification of methyl esters were performed using an HP 6890 gas chromatograph (Agilent Technologies, Santa Clara, CA, USA), coupled with a flame ionization detector. The column used was a Restek-fused silica capillary (Rt-2560, df 0.20 μm, length 100 m, i.d. 0.25 mm, Restek corporation, Bellefonte, PA, USA). Helium was used as a carrier gas at a constant flow of 1 ml/min, detector and injector temperatures were 250°C, and the split ratio was 40 : 1. Oven temperature was 140°C for 2 min, increased by 8°C/min to 170°C, held for 9 min, increased by 6°C/min to 200, held for 16 min, increased by 6°C/min to 240 and held for 15 min. Peak identification was performed using two external standard mixtures of pure methyl esters (Supelco™ 37 Component FAME Mix No. 18919-1 AMP, Supelco Inc., Bellefonte, PA, USA and GLC reference standard 469, NU-CHEK PREP Inc, Elysian, MN, USA). The mass of the different fatty acid methyl esters in each sample was determined by comparing the response factor for the individual fatty acid methyl ester peaks, corrected for using the internal standard peak, with a standard curve on the basis of the response factor for four different concentrations of the external standard.
Dynamic modelling and parameter estimation
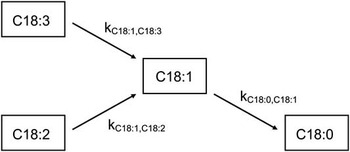
To estimate the rate of hydrogenation of C18 fatty acid isomers under rumen conditions in vitro, longitudinal data from each in vitro run (n = 18) were fitted to a dynamic simulation model. Results from all three in vitro runs were used. The model was based on a set of dynamic differential equations coded in Advanced Continuous Simulation Language Extreme (AcslX; Aegis Technologies Group Int., Huntsville, AL, USA). The model included pools of alpha-linolenic acid (C18:3), linoleic acid (C18:2), a composite pool of several C18:1 fatty acids (mainly vaccenic acid) and finally stearic acid (C18:0), giving four primary state variables (Figure 1). The pools, fluxes and initial rate constants of the model were chosen on the basis of hydrogenation and isomerization pathways presented by Harfoot and Hazelwood (Reference Harfoot and Hazlewood1997), Destaillats et al. (Reference Destaillats, Trottier, Galvez and Angers2005) and Ribeiro et al. (Reference Ribeiro, Eastridge, Firkins, St-Pierre and Palmquist2007). The following abbreviations and units were used in the model: mass of fatty acid methyl esters (Q, mg/g of added silage), hydrogenation rate constants (k, h) and fluxes (F, mg/h). The nomenclature followed the system Hij, where H describes the variable (Q, k and F), and ij describes the products and substrates involved (C18:0, C18:1, C18:2 and C18:3), that is, F C18:0,C18:1 represents the flux of fatty acids from the pool Q C18:1 to the pool Q C18:0. The differential equations describing the changes in the pools Q C18:0, Q C18:1, Q C18:2 and Q C18:3 over time were represented as follows:
 $$\frac{{d{{Q}_{{\rm{C18:3}}}}}}{{dt}}\, = \, {\rm{ - }} \,{{F}_{{\rm{C18:1,C18:3}}}}$$
 $$\frac{{d{{Q}_{{\rm{C18:2}}}}}}{{dt}}\, = \,{\rm{ - }}\,{{F}_{{\rm{C18:1,C18:2}}}}$$
 $$\frac{{d{{Q}_{{\rm{C18:1}}}}}}{{dt}}\, = \,{\rm{ - }}\,{{F}_{{\rm{C18:1,C18:3}}}}\, + \,{{F}_{{\rm{C18:1,C18:2}}}}\,{\rm{ - }}\,{{F}_{{\rm{C18:0,C18:1}}}}$$
 $$\frac{{d{{Q}_{{\rm{C18:0}}}}}}{{dt}}\, = \,{\rm{ - }}\,{{F}_{{\rm{C18:0,C18:1}}}}$$
Model of in vitro hydrogenation of C18 fatty acids in the rumen with three rates of hydrogenation, k (h), between four pools. C18:3 (linolenic acid), C18:2 (linoleic acid), C18:1 (mainly vaccenic acid) and C18:0 (stearic acid).

The fluxes were assumed to be mass action-driven as follows:
 $${{F}_{{\rm{C18:1,C18:3}}}}\, = \,{{k}_{{\rm{C18:1,C18:3}}}}\,\times \,{{Q}_{{\rm{C18:3}}}}$$
 $${{F}_{{\rm{C18:1,C18:2}}}}\, = \,{{k}_{{\rm{C18:1,C18:2}}}}\,\times \,{{Q}_{{\rm{C18:2}}}}$$
 $${{F}_{{\rm{C18:0,C18:1}}}}\, = \,{{k}_{{\rm{C18:0,C18:1}}}}\,\times \,{{Q}_{{\rm{C18:1}}}}$$
The pools of fatty acids were derived from numerical integration of the differential equations starting with the initial (i) pool size of fatty acids (iQ C18:0, iQ C18:1, iQ C18:2 and iQ C18:3) as follows:
 $${{Q}_{{\rm{C18:3}}}}\, = \,{\int}_{\!\!\!\!0}^{t} {d{{Q}_{C18:3}}} \, + \,i{{Q}_{{\rm{C18:3}}}}$$
 $${{Q}_{{\rm{C18:2}}}}\, = \,{\int}_{\!\!\!\!0}^{t} {d{{Q}_{{\rm{C18:2}}}}\, + \,i{{Q}_{{\rm{C18:2}}}}} $$
 $${{Q}_{{\rm{C18:1}}}}\, = \,{\int}_{\!\!\!\!0}^{t} {d{{Q}_{{\rm{C18:1}}}}} \, + \,i{{Q}_{{\rm{C18:1}}}}$$
 $${{Q}_{{\rm{C18:1}}}}\, = \,{\int}_{\!\!\!\!0}^{t} {d{{Q}_{{\rm{C18:1}}}}} \, + \,i{{Q}_{{\rm{C18:1}}}}$$
A fourth-order, Runge–Kutta fixed-step integration algorithm was used with a step size of 0.10 h. The hydrogenation rate constants k C18:1,C18:3, k C18:1,C18:2 and k C18:0,C18:1 were estimated by fitting observed longitudinal data for each in vitro run (n = 18) to the model using the Nelder–Mead optimization algorithm in AsclX, while maximizing the likelihood function. Data included the mass of each fatty acid methyl ester at different time points during the in vitro fermentation; input data were the initial mass of the four fatty acid methyl esters. The best fit was evaluated from residual plots (residual v. predicted) and root mean square prediction error, and the partition of error into mean bias, slope bias and random dispersion elements (Bibby and Toutenberg, Reference Bibby and Toutenburg1977).
Non-linear modelling and parameter estimation
To complement the results of the dynamic model approach, rates of fatty acid disappearance were estimated for linolenic acid and linoleic acid (k C18:3 and k C18:2, respectively) using a first-order kinetic model. Observed longitudinal data of C18:3 and C18:2 from each in vitro run were fitted with the PROC NLIN procedure of SAS (SAS Institute, 2010) to the following equation for C18:3 and C18:2:
 $${{Q}_t}\, = \,{{Q}_0}\,\times \,({\rm{1}}\,{\rm{ - }}\,{{e}^{{\rm{ - }}k\times t}} )$$
where Q 0 is the initial amount (mg/g added silage) of fatty acid methyl ester at time 0, Qt the amount (mg/g added silage) of fatty acid methyl ester at time t (h) and k the rate of fatty acid disappearance (k C18:3, k C18:2, h).
Statistical analysis
Data from both models, hydrogenation rate constants (k C18:1,C18:3, k C18:1,C18:2 and k C18:0,C18:1) from the dynamic model and disappearance rate (k C18:3 and k C18:2), were subjected to statistical analysis using the general linear model procedure of SAS. The model included fixed effect of growth, plant and the two-way interaction between main effects. Significance was declared at P < 0.05 and tendencies considered at 0.05 < P < 0.10. Data are presented as means ± standard errors of the mean.
Results
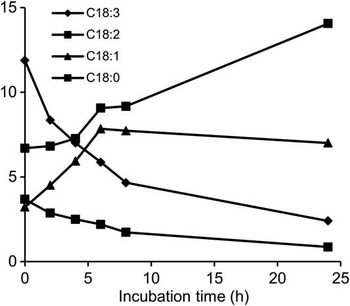
Initial fatty acid methyl ester amounts for in vitro samples are presented in Table 3. Initial fatty acid content varied between type of plant and growth. Notably, C18:3 amounts were higher in spring growth than in regrowth for both red and white clover, whereas the opposite was observed for perennial ryegrass. Figure 2 displays the changes in fatty acid methyl esters over time for red clover spring growth. Similar trends over time were observed for all types of silages. The values displayed in Table 3 and Figure 2 are the total fatty acid methyl ester contents of the sample tubes and do not differentiate between free fatty acids and those in bound lipid form. This is true for all values obtained from the in vitro units. Therefore, the hydrogenation values calculated describe net hydrogenation, a combination of lipolysis, isomerization and hydrogenation (Jenkins et al., Reference Jenkins, Wallace, Moate and Mosley2008). The C18:1 values displayed in Table 3 and Figure 2 are the total sum of several C18:1 isomers, with vaccenic acid (t11) being the most abundant.
Initial fatty acid methyl ester content for in vitro samples (average of three measurements ± s.e.m.) for C18:0, C18:1Footnote a, C18:2Footnote b and C18:3Footnote c isomers

a Including t9 + 10 + 11, c9 + 10, t6 + 7 + 8 methyl ester peaks.
b Including c9c12 methyl ester peak.
c Including c9c12c15 methyl ester peak.
Example (red clover spring growth) of changes in methyl esters of C18:3 (linolenic acid methyl ester), C18:2 (linoleic acid methyl ester), C18:1 (mainly vaccenic acid methyl ester) and C18:0 (stearic acid methyl ester) amounts over incubation time.

Rate-constant calculations
The rate of hydrogenation k values (h) obtained from the dynamic model is displayed in Table 4. Type of plant significantly affected k C18:1,C18:2 (P < 0.05) and showed tendencies to affect k C18:1,C18:3 (P < 0.10), but not k C18:0,C18:1 (P > 0.10). The growth, spring or regrowth did not affect any of the k values (P > 0.10). For k C18:1,C18:3 and k C18:1,C18:2, values were higher for ryegrass than for the two types of clover, whereas for k C18:0,C18:1 all types of plants displayed similar values. Rate of disappearance (h) for C18:3 and C18:2 are displayed in Table 5. Type of plant significantly affected k C18:3 and k C18:2. The growth, spring or regrowth did not affect any of the k values (P > 0.10). Similar to the rate of hydrogenation ryegrass displayed higher values than the two types of clover.
Rate of hydrogenation of C18 fatty acids for silage on the basis of three different types of silages, estimated using a dynamic simulation model

ABDifferent letters within a row indicate differences P < 0.10.
abDifferent letters within a row indicate differences P < 0.05.
Rate of disappearance of C18 fatty acids for silage on the basis of three different types of silages, estimated using a first-order kinetic model

abDifferent letters within a row indicate differences P < 0.05.
Discussion
Hydrogenation results
Hydrogenation rates were calculated on the basis of total fatty acid methyl ester content in the in vitro units. Hydrogenation occurred even in control samples, with polyunsaturated C18 fatty acids being turned into monounsaturated and saturated ones, although at very low levels. This means that as incubation time increases, control samples may no longer be representative for samples containing silages. Therefore, fatty acid methyl ester amounts in control samples were not deducted from the amounts in the samples containing silages. Similar to other in vitro studies on forage (Boufaied et al., Reference Boufaied, Chouinard, Tremblay, Petit, Michaud and Belanger2003; Ribeiro et al., Reference Ribeiro, Eastridge, Firkins, St-Pierre and Palmquist2007), no lag time was observed for hydrogenation of linolenic and linoleic acid. This suggests that the fatty acids in the forage were readily available for hydrogenation.
Modelling and parameter estimation
The biohydrogenation pathways of C18 fatty acids in the rumen include several different isomers and intermediates (Destaillats et al., Reference Destaillats, Trottier, Galvez and Angers2005; Jouany et al., Reference Jouany, Lassalas, Doreau and Glasser2007). However, when constructing the model that was used to calculate the rate of hydrogenation, only those C18 fatty acids that could be detected in quantifiable amounts in the incubated samples were taken into account. This leads to some intermediates of ruminal biohydrogenation not being included in the model. The monosaturated pool in the model included three detectable C18 peaks on the chromatogram. The largest contributor (>60% of total C18:1 amount) was the t9 +10 + 11 peak, which was assumed to be made up mainly of vaccenic acid (t11), as this is the most abundant C18:1 fatty acid in the rumen (Mosley et al., Reference Mosley, Powell, Riley and Jenkins2002). The second largest (10% to 35%) contributor was the c9 + 10 peak, and the smallest contributor (<4%) was the t6 + 7 + 8 peak. Specific pathways for flow between the fatty acid pools were chosen on the basis of the models of ruminal hydrogenation pathways described by others (Harfoot and Hazelwood, Reference Harfoot and Hazlewood1997; Destaillats et al., Reference Destaillats, Trottier, Galvez and Angers2005; Ribeiro et al., Reference Ribeiro, Eastridge, Firkins, St-Pierre and Palmquist2007). It is widely accepted that both linolenic and linoleic acid are hydrogenated into vaccenic acid and that vaccenic acid is hydrogenated into saturated stearic acid (Harfoot and Hazelwood, Reference Harfoot and Hazlewood1997), and the presence of linoleic acid leads to increased levels of the t6 + 7 + 8 fatty acids (Jouany et al., Reference Jouany, Lassalas, Doreau and Glasser2007). As for c9, it has been shown that it can both be isomerized into several other C18:1 fatty acids, including t6, t7 and t11, as well as hydrogenated into stearic acid (Mosley et al., Reference Mosley, Powell, Riley and Jenkins2002). However, it was not possible to find references describing a hydrogenation pathway that explained the initial increase of the c9 + 10 peak observed in the present study. These isomers were therefore included in the C18:1 pool to allow for its increase without adding additional pools to the model for which no data existed. The model used represents a simplification of the highly complex process of ruminal biohydrogenation to accommodate the data obtained in the in vitro study. However, the developed model was more complex than the rate of disappearance estimation of linolenic and linoleic acid commonly used in hydrogenation studies, as it takes into account the increase of C18:1 fatty acids and the final step of hydrogenation into stearic acid. In addition, the passage rate of fatty acids is not taken into account, which, together with the simplifications of the model, means that caution should be exercised when applying the results obtained to in vivo conditions.
Model results
Estimating the rate of hydrogenation revealed that the terminal step, from monosaturated isomers to stearic acid, had similar values for all three types of silages, with no significant effect of either plant or growth. However, for the other two rates, from polyunsaturated to monounsaturated, clover silages showed similar values that were lower than those for ryegrass silages. This indicates that the hydrogenation process for linolenic acid and linoleic acid was slower in clover silages than in ryegrass silages, as types of plant had a significant effect on k C18:1,C18:2, and a tendency to affect k C18:1,C18:3. The higher P value for k C18:1,C18:3 may be partly because of the simplification of the model, assuming that all linolenic acids proceed to the C18:1 pool, when in reality it may take a different pathway towards stearic acid. However, the results clearly showed that the effect on hydrogenation persists for the different growths of the plant. The rate of disappearance for linolenic and linoleic acid was estimated as well, using only the amounts of these two fatty acids as the basis for the estimation. These values are higher than those for rate of hydrogenation above, but with similar trends. Red and white clover displayed values that were closer together and lower than those for ryegrass, with the rate of disappearance being lower for linoleic acid than for linolenic acid. This is consistent with other in vitro studies that calculated the rate of disappearance (Boufaied et al., Reference Boufaied, Chouinard, Tremblay, Petit, Michaud and Belanger2003; Jouany et al., Reference Jouany, Lassalas, Doreau and Glasser2007). Similar to the rate of hydrogenation, the type of plant had a significant effect on the estimated value, whereas growth did not. The differences between rate of hydrogenation and rate of disappearance can most likely be explained by unidentified intermediates. The hydrogenation model was based on both disappearance of substrate as well as increase of product, whereas the disappearance model was solely based on disappearance of substrate. However, both results supported the conclusion that the differences in hydrogenation are a result of type of plant, with growth having no significant effect. The fact that the growth had no effect also means that the large variations in fatty acid compositions between the growths neither increased nor decreased the rate of hydrogenation. Instead, the plant effect on hydrogenation could be because of the presence of plant secondary metabolites, such as condensed tannins that have been shown to inhibit the terminal step of ruminal hydrogenation (Khiaosa-Ard et al., Reference Khiaosa-Ard, Bryner, Scheeder, Wettstein, Leiber, Kreuzer and Soliva2009), and can be found in white clover in high-enough amounts to have an effect on rumen metabolism (Burggraaf et al., Reference Burggraaf, Waghorn, Woodward and Thom2008). However, in the present study, the rate of hydrogenation from monounsaturated fatty acids to stearic acid was similar for all types of silages, suggesting that these metabolites may not be present in sufficient amounts to exert any effect on the hydrogenation process. Polyphenol oxidase, mainly present in red clover, is another plant metabolite that influences rumen metabolism through reduction of lipolysis (Lee et al., Reference Lee, Tweed, Scollan and Sullivan2008). Lipolysis is required before hydrogenation can begin (Jenkins et al., Reference Jenkins, Wallace, Moate and Mosley2008). It is possible that the reduced level of hydrogenation for linolenic and linoleic acid found in this study results from reduced rate of lipolysis, which in turn reduces the initial step of hydrogenation, as both of these fatty acids are bound into the structure of the silage samples. This would also be consistent with findings that clover silages resulted in larger amounts of polyunsaturated fatty acids in milk than ryegrass silages (Dewhurst et al., Reference Dewhurst, Fisher, Tweed and Wilkins2003), as reducing the hydrogenation of linolenic and linoleic acid increases the likelihood of these fatty acids passing unaltered through the rumen. However, as polyphenol oxidase can be found primarily in red clover, this does not explain the similarities in the two types of clover. In conclusion, in vitro ruminal biohydrogenation of polyunsaturated C18 fatty acids was considerably lower in red and white clover than in perennial ryegrass. Ruminal biohydrogenation was similar for the two types of clover, but was not affected by growth confounded with fatty acid concentration. Biohydrogenation of monounsaturated fatty acids did not differ between clover and grass.
Acknowledgements
The authors acknowledge the financial support from The Danish Ministry of Food, Agriculture and Fisheries and the Sund of velsmagende mælk consortium, consisting of Arla Foods, DLF Trifolium and Aarhus University.