
Introduction
The search for new high-performance thermoelectric materials has been extensively performed because such materials are very useful in practical energy conversion applications [Reference Tritt and Subramanian1]. The efficiency of thermoelectric materials and devices can be characterized by a dimensionless quantity ZT, defined as [Reference Ioffe2, Reference Goldsmid3]  $ZT = {{{S^2}\sigma T} \over k}$, where the quantities S, σ, k = k e + k l and T, stand for Seebeck coefficient, electrical conductivity, thermal conductivity (sum of the electronic and lattice contribution) and temperature, respectively. Generally, semiconductors have high Seebeck coefficient and low thermal conductivity. Antiperovskite materials, such as Sr3SbN is a semiconductor with a band gap value of ∼1.15 eV and predicted to have high Seebeck coefficient and power factor (PF) [Reference Saifullah, Shafiq, Khan, Aliabad, Asadabadi, Ahmad and Ahmad4, Reference Gäbler, Kirchner, Schnelle, Schwarz, Schmitt, Rosner and Niewa5]. Some other antiperovskites have small band gap (0–1) [Reference Bouhemadou, Khenata and Djabi6–Reference Miao, Xu, Bristowe, Bilc, Verstraete and Ghosez10]. Most of the high performance thermoelectric materials have a band gap around 0.5–1.5 eV [Reference Tritt and Subramanian1, Reference Zhao, Lo, Zhang, Sun, Tan, Uher, Wolverton, Dravid and Kanatzidis11, Reference Heremans, Jovovic, Toberer, Saramat, Kurosaki, Charoenphakdee, Yamanaka and Snyder12, Reference Mahan13]. Therefore, the isotypic compound of Sr3SbN may have band gap within this range and hence, they may show high thermoelectric conversion efficiency.
Sr3AsN, an isotypic compound of Sr3SbN, was predicted by Beznosikov, from the analysis of chemical bonding and admissible atomic radius [Reference Beznosikov14]. Recently, some authors have reported the elastic, electronic and optical properties of Sr3AsN, without considering its energetic and dynamic stability [Reference Hichour, Khenata, Rached, Hachemaoui, Bouhemadou, Reshak and Semari15, Reference Haddadi, Bouhemadou, Louail, Rahal and Maabed16, Reference Ullah, Murtaza, Khenata, Mahmood, Muzzamil, Amin and Saleh17]. The dynamical stability is an essential criterion for a compound to be synthesized successfully in the laboratory [Reference Grimvall, Magyari-Köpe, Ozolicnš and Persson18]. Some compounds could not be synthesized due to their dynamical instability [Reference Grimvall, Magyari-Köpe, Ozolicnš and Persson18, Reference Wallace19]. The electronic properties of Sr3AsN have been reported in most of the studies by using PBE functional [Reference Hichour, Khenata, Rached, Hachemaoui, Bouhemadou, Reshak and Semari15, Reference Haddadi, Bouhemadou, Louail, Rahal and Maabed16]. It is well known that PBE functional underestimates the band gap by 50% of experimental value [Reference Chan and Ceder20, Reference Koller, Tran and Blaha21]. So, the reported band gap for Sr3AsN using PBE functional is ∼0.5–0.8 eV [Reference Hichour, Khenata, Rached, Hachemaoui, Bouhemadou, Reshak and Semari15, Reference Haddadi, Bouhemadou, Louail, Rahal and Maabed16]. The points discussed above impressed us to study the structural stability, precise electronic structure and transport properties of Sr3AsN.
In the present work, we study the structural stability from the lattice dynamics, energetic stability from the calculation of enthalpy of formation, precise electronic structure using PBE and different version of Becke-Johnson (BJ) potential [Reference Becke and Johnson22], and electron and phonon transport properties. Our results reveal that the compound studied is mechanically, energetically, and dynamically stable with a calculated band gap value of 1.2 eV. Although the lattice thermal conductivity of Sr3AsN is comparatively low, the electronic thermal conductivity is very high, resulting in the suppression of thermoelectric performance.
Results and discussions
The antiperovskite Sr3AsN crystallizes in a cubic structure of space group  $Pm\bar{3}m$ (#221). The three Sr-atoms occupy 3c (0, 1/2, 1/2), one As and one N-atom occupy 1a (0, 0, 0), and 1b (1/2, 1/2, 1/2) Wyckoff positions, respectively. The three Sr-atoms are bonded with N, while no bonds exist between Sr and As atoms.
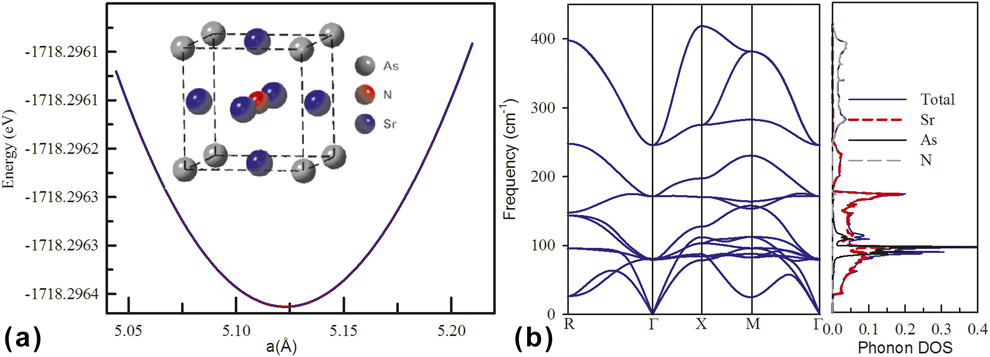
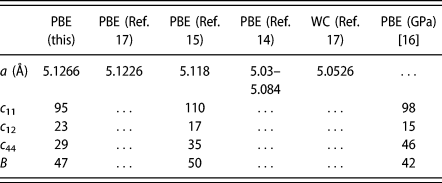
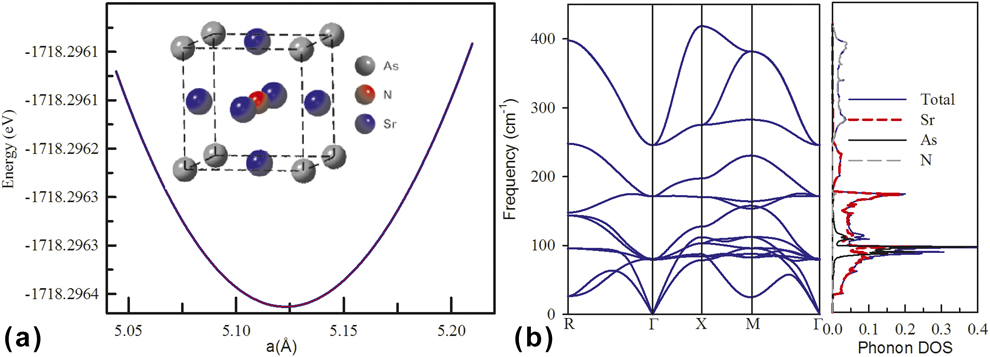
The equilibrium crystal structure and the ground state energy of Sr3AsN as a function of lattice parameters are shown in Fig. 1(a). From the energy minimization [solving the equation of state (EOS)], the calculated lattice parameter is listed in Table I, with other available theoretical data.
(a) Total energy (in eV unit) of Sr3AsN as a function of lattice parameter. (b) Phonon dispersion relations of Sr3AsN along high symmetry k-point (left panel). The inset figure shows the ground state structure of the studied compound. The right panel shows the total and atom projected phonon density of states.
Calculated lattice parameter, elastic constants (in GPa), and bulk modulus (B in GPa) of Sr3AsN, with other theoretical available data.

We find that our calculated lattice parameter is in good agreement with the available data. We will use this optimized lattice parameter in subsequent calculations.
Structural stability
It is better to check the thermodynamic stability for any hypothetical compound, before the authors explain the main results. Moreover, materials used in the thermoelectric device must be thermodynamically and mechanically stable at the imposed temperature. First, we will study the energetic stability of Sr3AsN. This criterion can be checked by calculating formation energy of the compound. The formation energy of a compound can be calculated by taking the energy difference between the total energy of the compound and sum of the total energy of individual constituents in their stable structure. Our calculated formation energy of Sr3AsN is −1.51 eV/Sr.
The negative formation energy indicates that the studied compound is probable to form energetically. Another way, we can check elastic stability from the calculated elastic constants. Our calculated elastic constants of Sr3AsN fairly agree with the available theoretical values listed in Table I. The slight deviation is due to the different structural relaxation and functional used in their calculations. The necessary and sufficient conditions for a cubic crystal to be elastically stable are [Reference Mouhat and Coudert23]:
 $${C_{11}} - {C_{12}} > 0;\;{C_{11}} + 2{C_{12}} > 0;\;{C_{44}} > 0\quad .$$
The calculated elastic constants of Sr3AsN fulfill these criteria and hence, the studied compound is elastically stable. Dynamic stability is the most important criterion for a compound to be synthesized in the laboratory. Phonons, called the normal mode of quantum vibrations, characterize the dynamical stability of a compound. A dynamically stable compound must have real phonon frequency, i.e., the structure must not have any unstable phonon branch [Reference Elliott, Triantafyllidis and Shaw24, Reference Togo and Tanaka25]. The calculated phonon dispersion and phonon density of states of Sr3AsN are presented in Fig. 1(b). Acoustic modes of phonons mainly arise from Sr-atoms, and a peak around 100 cm−1 arises from As-atom. N-atom induces all of the optical modes. Sr3AsN in the cubic phase does not have any unstable phonon modes [as shown in Fig. 1(b)], and hence, this phase is dynamically stable. From the above points of view, we predict that Sr3AsN in the cubic phase is highly probable to form in the compound synthesized in the laboratory. Since Sr3AsN fulfills all the stability criteria, we can proceed to the next section to study its transport properties and find its potential applications.
Transport properties
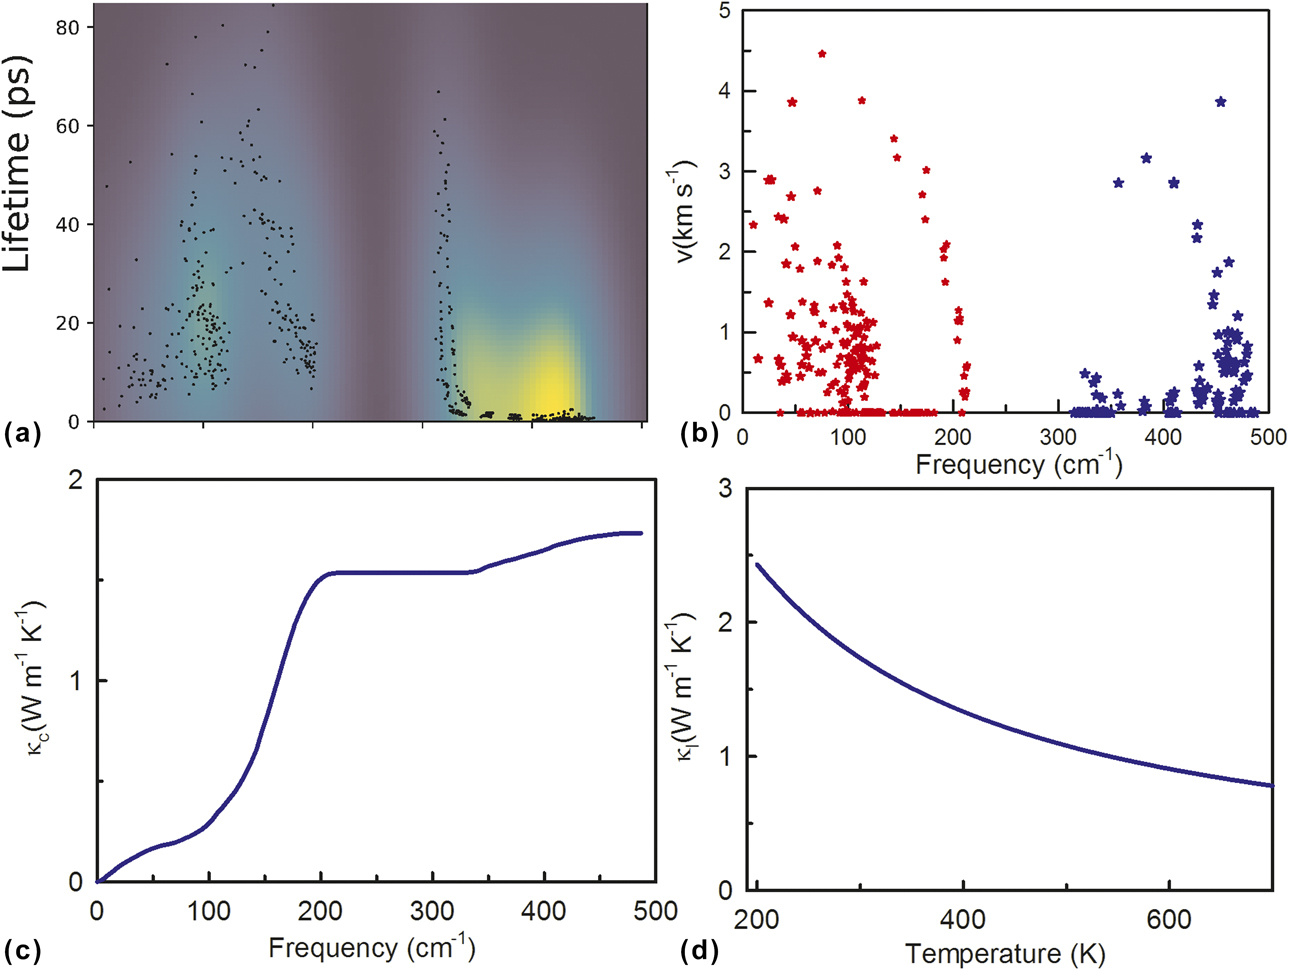
Since the figure of merit (ZT) is inversely proportional to the thermal conductivity, i.e., the sum of the electronic and lattice thermal conductivity, materials with low lattice thermal conductivity may have high thermoelectric figure of merit. First, we will give insight into the phonon scattering mechanism in Sr3AsN. To describe this, we calculate phonon lifetime and group velocity and present them in Figs. 2(a) and 2(b).
Calculated: (a–c) Phonon lifetime (at 0 K), group velocity, and cumulative lattice thermal conductivity as a function of frequency, and (d) lattice thermal conductivity as a function of temperature.
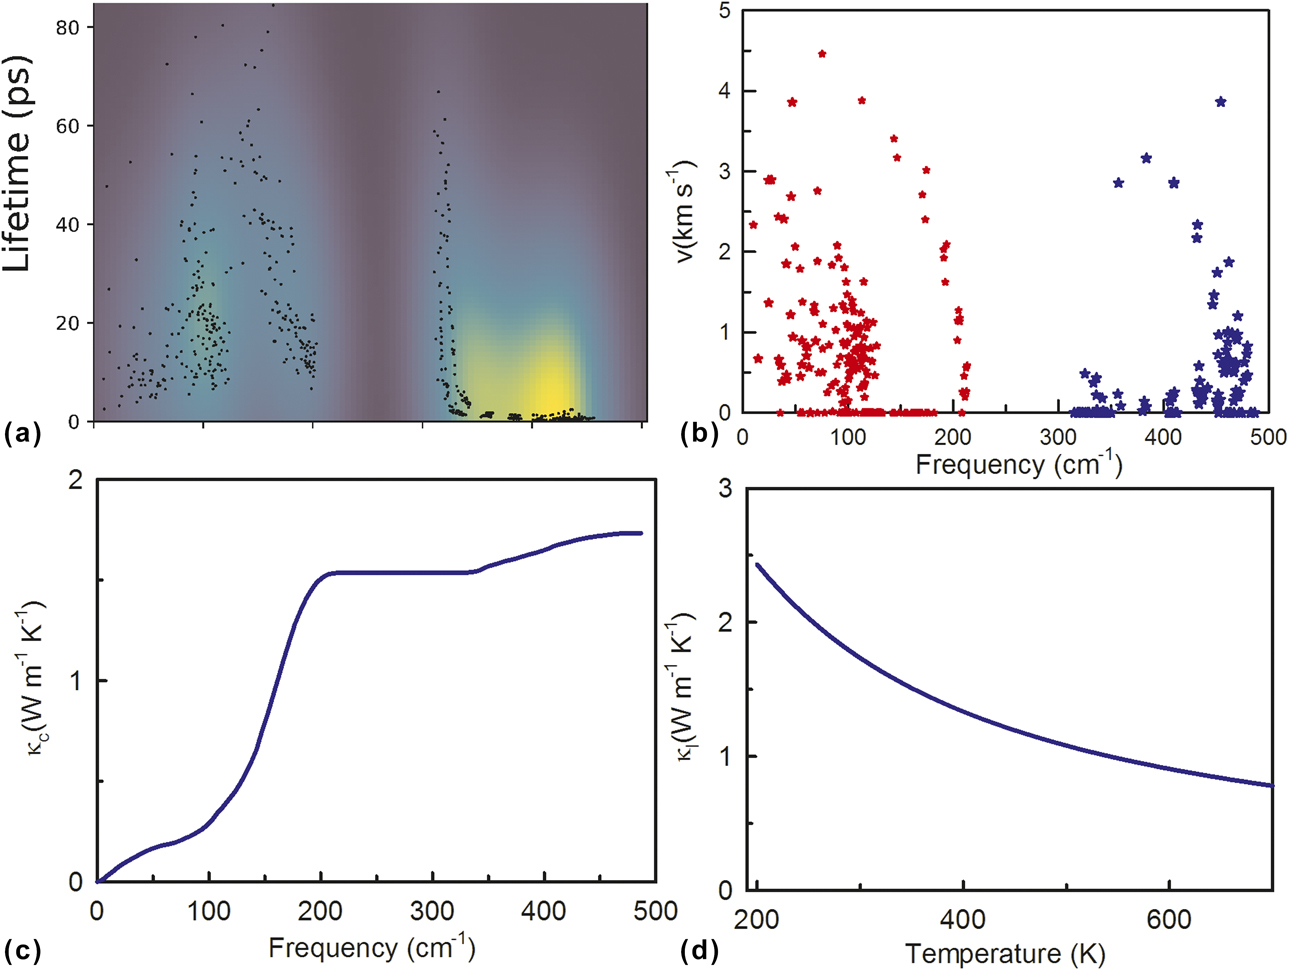
In the figure of group velocity, acoustic and optical modes of phonons are indicated by the red star and blue circle, respectively. The calculated maximum group velocity is around 4.5 km/s. An intense phonon scattering induces short phonon lifetime. The frequency dependent cumulative lattice thermal conductivity at 300 K is presented in Fig. 2(c). We observe that most of the heat is transported by acoustic phonons, up to 200 cm−1. The heat transport due to the optical phonons is very small. From this point of view, we may reduce the lattice thermal conductivity further through the increase of scattering channels between the acoustic and optical phonons by doping/co-doping of suitable elements or nanostructuring. However, we are not interested to study this mechanism in the present paper. The lattice thermal conductivity of Sr3AsN as a function of temperature is shown in Fig. 2(d). The lattice thermal conductivity is decreased with temperature as the temperature increases the phonon scattering. Our calculated lattice thermal conductivity at 300 K is 1.73 W/(m K), which is much smaller than that of typical thermoelectric material CoSb3 [11.5 W/(m K)] [Reference Li and Mingo26]. The considerable mass difference between Sr, As, and N gives rise to an intense phonon scattering inducing such low lattice thermal conductivity. The intrinsic phonon scattering between acoustic modes of Sr and optical modes of As/N leads to low heat transport (see the calculated atom projected phonon density of states).
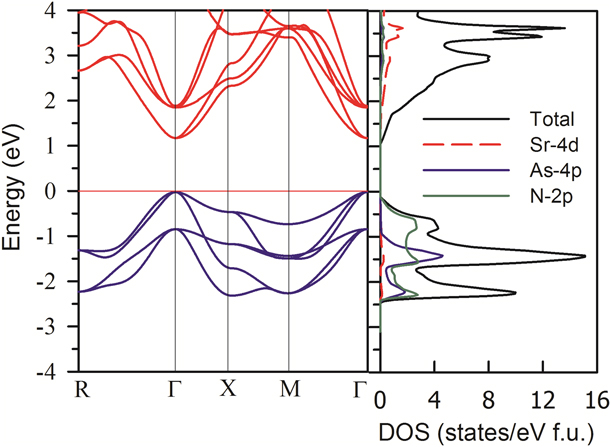
Now we are interested to describe the electron transport in Sr3AsN. Electron transport properties are directly related to electronic structure of a material (i.e., electronic states near the Fermi level); we will briefly review electronic structure of Sr3AsN. The calculated electronic band structure of Sr3AsN by using the most accurate TB-mBJ potential is presented in the left panel of Fig. 3. The right panel shows the calculated total and projected density of states. We see that CBM and VBM are at the Γ-point, with an energy gap of 1.2 eV.
Calculated electronic band structure by using TB-mBJ potential (left panel), total and atom projected density of states (right panel). The horizontal line at zero energy represents the Fermi level.
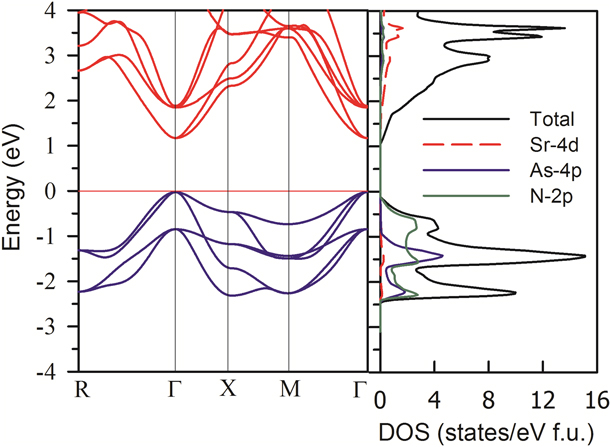
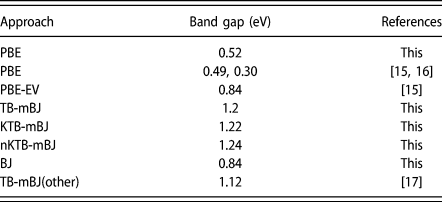
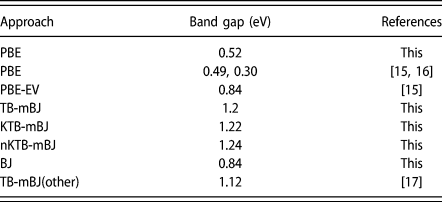
Therefore, Sr3AsN is a direct band gap semiconductor. The CBs are highly dispersive, while valence bands are less dispersive compared to CB. We have also calculated energy band gap by using PBE functional and different versions of BJ potential [Reference Becke and Johnson22]: Tran and Blaha-modified BJ potential (TB-mBJ) [Reference Tran and Blaha27]; new Koller, Tran, and Blaha-modified BJ potential (nKTB-mBJ) [Reference Koller, Tran and Blaha28]; and Koller, Tran, and Blaha-modified BJ potential (KTB-mBJ) [Reference Koller, Tran and Blaha28]. The obtained values of the band gap of Sr3AsN are listed in Table II. As usual, PBE functional underestimates the TB-mBJ value by 56%. The band gap calculated by using PBE is in good agreement with the available PBE based data. It is interesting that BJ potential and Engel–Vosko GGA functional [Reference Engel and Vosko29] give the same result. TB-mBJ and its other two modified versions also give the almost same values of the band gap. The obtained value of band gap by TB-mBJ in the present calculations is slightly larger than that of reported in Ref. Reference Ullah, Murtaza, Khenata, Mahmood, Muzzamil, Amin and Saleh17 due to different structural relaxation and convergence criteria used in the calculation.
Calculated energy band gap of Sr3AsN by using different functional and others available theoretical data.
Since TB-mBJ usually produces an accurate band gap value than by other approaches, we have used it in electron transport properties calculations. The projected density of states (shown in the right panel of Fig. 3) indicates that Sr-4d and N-2p orbitals have dominant contributions to the formation of the direct band gap. Sr-4d orbitals give rise of the CBs while As-4p and N-2p orbitals almost equally contribute to valence bands. The valence bands disperse along R–Г direction but along Γ–Γ direction, they are less dispersive, i.e., slightly flat bands. Such flat bands favor for high Seebeck coefficient, according to Mott relation [Reference Heremans, Jovovic, Toberer, Saramat, Kurosaki, Charoenphakdee, Yamanaka and Snyder12].
A good thermoelectric material usually has high Seebeck coefficient and hence, high PF. Another important fact that it must have a low thermal conductivity. The lattice thermal conductivity of the studied compound is comparatively low and hence, it is interesting to study the thermoelectric figure of merit (ZT) resulting from such low value of the lattice thermal conductivity. The calculated transport parameters of p-type Sr3AsN as a function of carrier concentration are presented in Fig. S1 of Supplementary material. The Seebeck coefficient sharply decreases with the increase of carrier concentration, but it increases with temperature. The increase of carrier density shifts the Fermi level to higher energy and hence, reduces the band gap.
The absolute value of the calculated Seebeck coefficient at 300 K can approach ∼298 µV/K at a carrier density of 1.249 × 1019 cm−3. This value of the Seebeck coefficient is higher than that of the practical thermoelectric material SnSe (S ∼ 200 µV/K at ∼1019 cm−3) reported in Ref. Reference Guo, Wang, Kuang and Huang30. It becomes even higher when temperature is increased further. Such high Seebeck coefficient originates from slightly flat nature of valence bands described before. The electrical conductivity (σ/τ) and electronic part of the thermal conductivity (κe/τ) within constant relaxation time approximation are increased with the carrier density, as usually. Since electrical conductivity increases with carrier density more compared to the decrease of Seebeck coefficient, the PF also increases with it (at 300 K, PF increases with the carrier density up to 1020 cm−3). At 300 K and a carrier concentration of 1.249 × 1019 cm−3, the calculated value of PF can reach 5.19 × 10¹⁰ W/(m K s) within unknown constant relaxation time. To assess which type of material is more favorable for thermoelectric energy conversion, the calculated transport parameters of n-type Sr3AsN are also presented in Fig. S2 of Supplementary material. All parameters show the same trend with carrier concentration.
However, the Seebeck coefficient is much smaller than that for p-type, though the electrical conductivity and electronic part of the thermal conductivity are higher than that of p-type. The PF of p-type Sr3AsN is higher than that of n-type. Therefore, p-type Sr3AsN is more favorable for thermoelectric energy conversion. For further description of the thermoelectric properties of Sr3AsN, we will consider only the transport properties of holes (p-type).
As above, we have described the electrical conductivity and electronic part of thermal conductivity within the constant relaxation time approximation. To extract real values of them, we need to calculate carrier relaxation time. For this, we need to consider that only the acoustic phonons scatter the conducting holes, other type of scatterings are negligibly small. Deformation potential theory provides an approach to calculate the relaxation time based on the equation [Reference Bardeen and Shockley31]
 $${\tau _{{\rm{acps}}}} = {\left( {{2 \over {{m^*}{k_{\rm{B}}}T}}} \right)^{3{\rm{/}}2}}{{{\pi ^{1/2}}{\hbar ^4}{c_{ii}}} \over {3D_{{\rm{ac}}}^2}}\quad ,$$
where cii represents the symbol of the direction-dependent elastic constant and D ac, the deformation potential constant defined as  ${D_{{\rm{ac}}}} = {a_0}{{\partial E} \over {\partial a}}$. We can calculate the deformation potential constant by using the finite difference method and calculating the change of band energy (E) with respect to the change of lattice parameters (a) due to the applied strain. The band energy (E) has been calculated as change of CBM energy and VBM energy due to the applied strain. Readers are suggested to read these references for more detailed descriptions [Reference Hamaguchi and Hamaguchi32, Reference Xi, Long, Tang, Wang and Shuai33, Reference Haque and Hossain34]. The calculation of direction dependent elastic constants is well-described in Ref. Reference Bardeen and Shockley31.
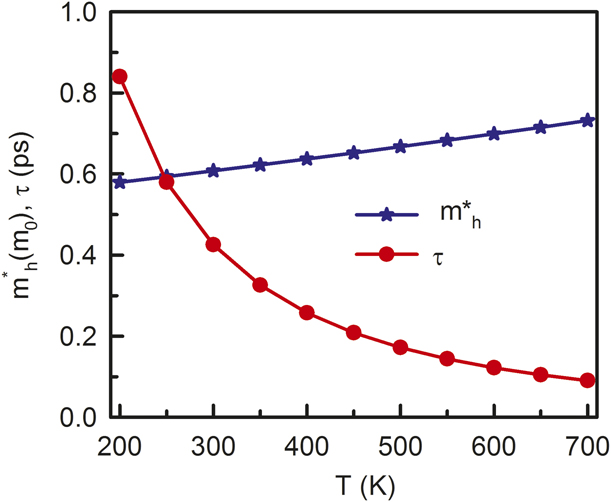
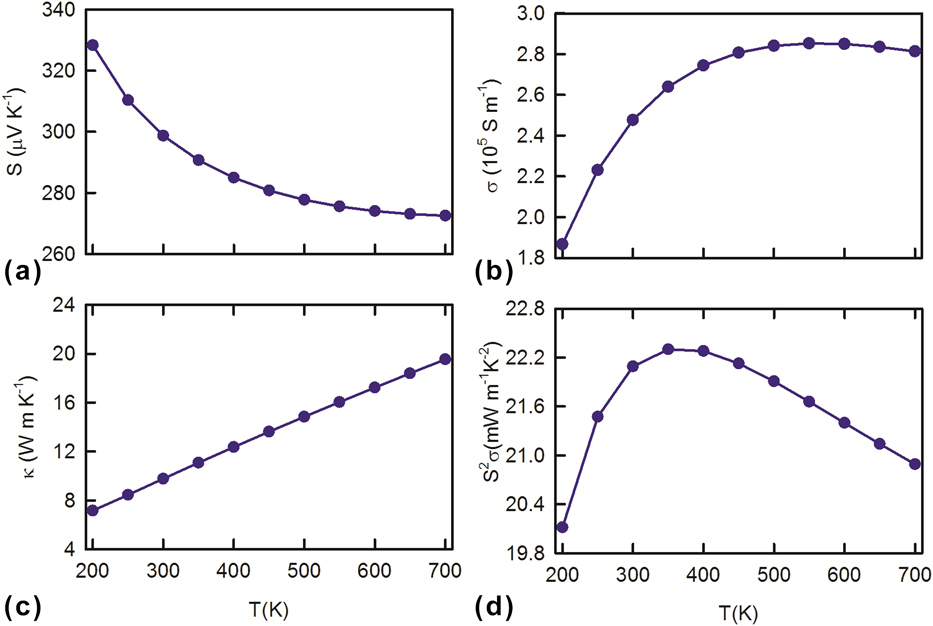
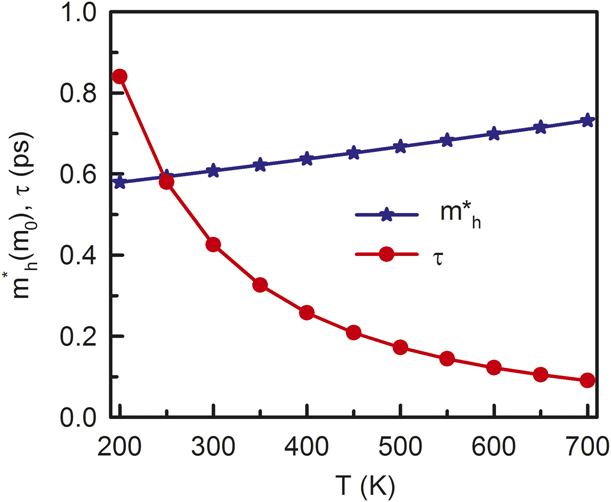
In this calculation, we will use the elastic constant in the direction of the pure longitudinal wave (100). The calculated deformation potential constant is 7.91 eV. Another parameter, namely, effective mass (m*) is required for the calculation of relaxation time. For this, we have calculated transport effective mass (calculated using the conductivity tensor of Boltztrap output with the aid of transM code [Reference Xing, Sun, Li, Fan, Zheng and Singh35]) as a function of temperature, as shown in Fig. 4. The effective mass increases with temperature due to the increase in density of states. The reader should be able to differentiate the usual effective mass (second derivative of energy with respect to momentum) and transport effective mass (only related to the density of states mass). By using these parameters, our calculated carrier relaxation time at different temperature is presented in Fig. 4. The carrier relaxation time is comparatively large, which indicates small holes scattering in Sr3AsN. They decrease with temperature as the scattering increases. Now, we can calculate the electrical conductivity and electronic part of the thermal conductivity by multiplying the above relaxation time of the corresponding temperature. Since we have calculated temperature-dependent carrier relaxation time, we can only calculate these quantities at these temperatures. For the present purpose, we consider transport parameters at a carrier concentration of 1.249 × 1019 cm−3, which corresponds to the chemical potential of 0 K Fermi energy. The temperature dependent Seebeck coefficient, electrical conductivity, total thermal conductivity, and PF are shown in Fig. 5.
Transport effective mass and carrier relaxation time of Sr3AsN as a function of temperature.
Temperature-dependent thermoelectric parameters: (a) Seebeck coefficient, (b) electrical conductivity, (c) total thermal conductivity, and (d) PF.
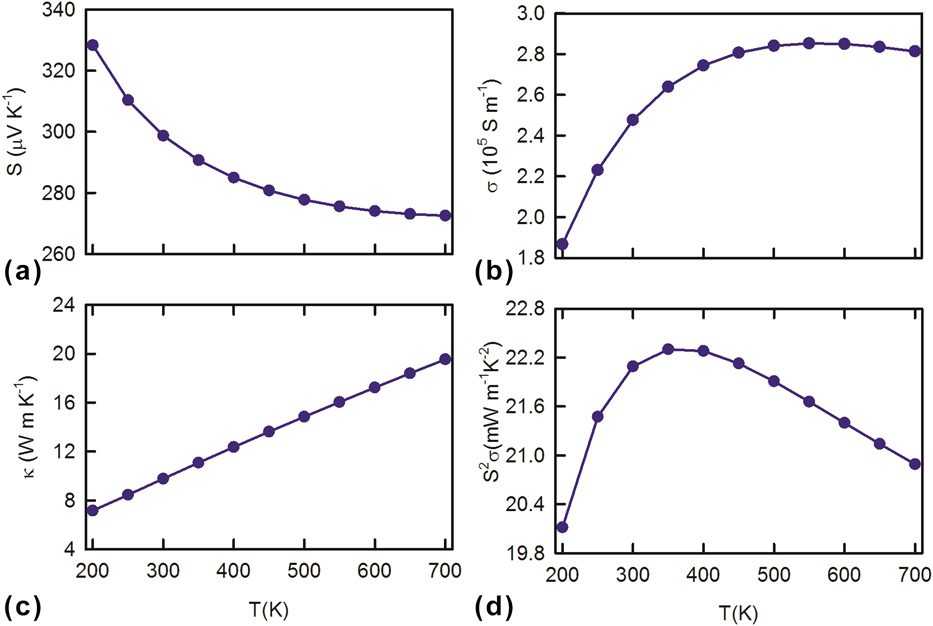
The low-temperature Seebeck coefficient is very high and it decreases with temperature. Since the temperature reduces the band gap shifting of the Fermi level at the middle of the band gap, the intrinsic activation energy increases with temperature up to the band gap energy. The electrical conductivity and total thermal conductivity increase with temperature due to the excited carriers. This demonstrates the semiconducting nature of the compound studied. Above 600 K, the electrical conductivity decreases with temperature indicating that Sr3AsN may become metallic above 600 K, as shown in Fig. 5(b).
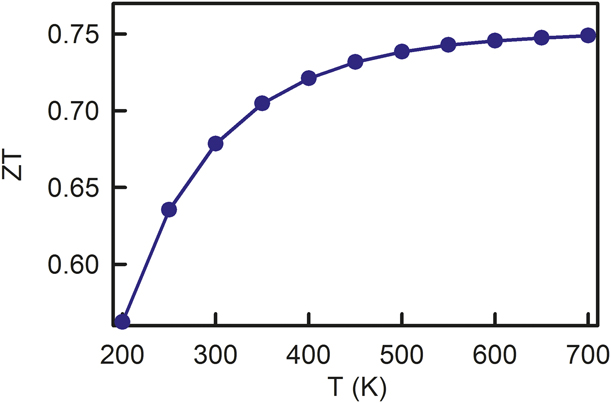
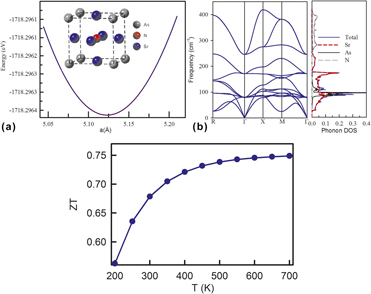
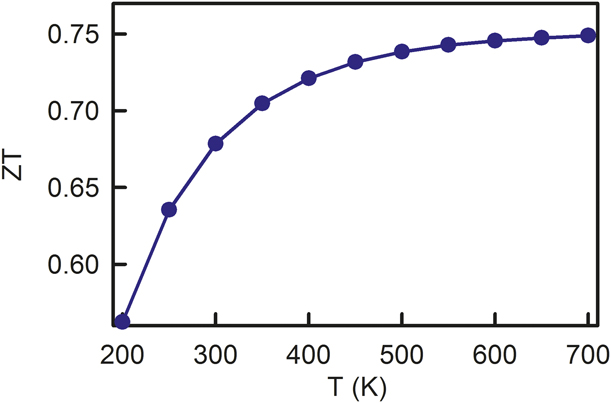
We obtain a maximum PF of 12.2 mW/(m K2) at 350 K. This value of PF is also higher than that of SnSe (∼10 mW/m along b-axis) [Reference Zhao, Lo, Zhang, Sun, Tan, Uher, Wolverton, Dravid and Kanatzidis11]. But the thermal conductivity is about 15 times larger than that of SnSe. Therefore, it will hinder us to get high-value of ZT. However, alloying/co-doping/nanostructuring may efficiently reduce the thermal conductivity and improve ZT. To reveal its applicability in thermoelectric devices, we have calculated temperature-dependent figure of merit  $\left( {ZT = {{{S^2}\sigma T} \over k}} \right)$, as shown in Fig. 6. The calculated ZT increases with temperature up to the studied temperature range. We obtain a maximum ZT value of 0.75 at 700 K. The calculated ZT value is in well-agreement with the value ∼0.71 [assuming constant relaxation time and lattice thermal conductivity to be 10−14 s and 2 W/(m K), respectively] at 700 K reported in Ref. Reference Ochi and Kuroki36. The high value of the thermal conductivity results in such low value of ZT as mentioned before. Therefore, Sr3AsN is a potential thermoelectric material and will be suitable for thermoelectric device applications if we can increase ZT further by alloying or nanostructuring mechanism. Because these mechanisms can reduce thermal conductivity drastically improving the scattering of electrons and phonons. Although this value of ZT is smaller than that required for practical applications, we hope that our study will inspire experimentalists to synthesize Sr3AnN and to improve thermoelectric performance by alloying with a suitable element or nanostructuring.
Thermoelectric figure of merit of Sr3AsN as a function of temperature.
Conclusions
In summary, we have predicted the structural stability of Sr3AsN to reveal the synthesis possibility and transport properties to disclose its applicability in thermoelectric devices, from first-principles calculations. Our calculated equilibrium lattice parameters are in good agreement with the available data. The analysis on structural stability reveals that Sr3AsN is mechanically, energetically, and dynamically stable at ambient condition. Electronic structure calculations predict that it is a direct band gap (1.2 eV) semiconductor and Sr-4d and N-2p orbitals mainly formulate this direct band gap. The calculated Seebeck coefficient is high (∼298 µV/K at 300 K). Although its lattice thermal conductivity is comparatively low, electronic thermal conductivity is very high. The calculated maximum TE figure of merit (ZT) is 0.75 at 700 K, indicating that it is a potential material for thermoelectric applications. Although this value of ZT is smaller than that required for practical applications, we hope that further study under consideration of alloying with a suitable element or nanostructuring may improve ZT and it could be practically applicable TE material.
Computational methodology
The structural optimization was performed by using a full potential linearized augmented plane wave (FP-LAPW) with generalized gradient approximation of Perdew–Burke–Ernzerhof (GGA-PBE) [Reference Perdew, Burke and Ernzerhof37, Reference Perdew, Ruzsinszky, Csonka, Vydrov, Scuseria, Constantin, Zhou and Burke38], as implemented in WIEN2k [Reference Blaha, Schwarz, Madsen, Kvasnicka and Luitz39]. We used 10 × 10 × 10 k-point and kinetic energy cutoff of RKmax = 7.0 [this determines the convergence criteria (matrix size), where R is the smallest atomic sphere radii in the unit cell and K max is the magnitude of maximum momentum vector in the basis (plane wave cutoff)]. We modeled the muffin tin sphere with radii 2.37, 2.5, 2.26 Bohr for Sr, As, and N, respectively. By using the optimized structure, we performed the elastic and optical properties calculations in WIEN2k. For the electronic structure calculation, we used 21 × 21 × 21 k-point mesh and different versions of BJ potential. We performed the self-consistent field calculation (SCF) again by using a finer 54 × 54 × 54 k-point mesh to generate the necessary inputs (energy eigenvalues, Fermi energy, etc.) to solve the Boltzmann transport equation, as implemented in Boltztrap [Reference Madsen and Singh40]. The lattice thermal conductivity was calculated by using the finite displacement approach [Reference Esfarjani and Stokes41, Reference Parlinski, Li and Kawazoe42], displacing each atom (in 2 × 2 × 2 supercell) by 0.06 Å simultaneously, which is implemented in Phono3py [Reference Togo, Chaput and Tanaka43]. We have used a mesh of 4 × 4 × 4 k-point to calculate the required harmonic (second-order force) and anharmonic (third order forces) force calculation in Quantum espresso package [Reference Giannozzi, Baroni, Bonini, Calandra, Car, Cavazzoni, Ceresoli, Chiarotti, Cococcioni, Dabo, Dal Corso, de Gironcoli, Fabris, Fratesi, Gebauer, Gerstmann, Gougoussis, Kokalj, Lazzeri, Martin-Samos, Marzari, Mauri, Mazzarello, Paolini, Pasquarello, Paulatto, Sbraccia, Scandolo, Sclauzero, Seitsonen, Smogunov, Umari and Wentzcovitch44] using GGA-PBE functional, and ultrasoft pesudopotential. The BZ integration in the q-space was performed with a 21 × 21 × 21 q-point mesh and the lattice thermal conductivity was calculated by using the equation 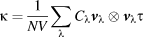 $\kappa = {1 \over {NV}}\sum\limits_\lambda {{C_\lambda }{{\bi{v}}_\lambda } \otimes {{\bi{v}}_\lambda }\tau }$, where V stands for the volume of the unit cell, v for the group velocity, τ for the SMRT for the phonon mode λ, and C λ for mode dependent phonon heat capacity. The Phono3py program has been found to be successful in the prediction of the lattice thermal conductivity of some materials [Reference Garrity45, Reference Guo46, Reference Seko, Togo, Hayashi, Tsuda, Chaput and Tanaka47, Reference Joshi, Rai, Deligoz, Ozisik and Thapa48, Reference Whalley, Skelton, Frost and Walsh49].
Supplementary material
To view supplementary material for this article, please visit https://doi.org/10.1557/jmr.2019.146.