Implications
Beef cattle are a source of enteric methane (CH4) that contributes to atmospheric greenhouse gas concentrations. The study evaluated accuracy of beef cattle enteric CH4 prediction equations using high-forage and high-grain data sets that represent diets used globally in beef cattle production. Study results enable beef farmers and advisers to choose appropriate equations to estimate enteric CH4 emissions from beef cattle under various dietary conditions. The accurate prediction of enteric CH4 emission is critical for the beef industry to develop suitable policies and adopt feeding strategies to decrease the quantity of enteric CH4 released to the atmosphere.
Introduction
Global Carbon Project (2013) estimated that from 2000 to 2009 total global emission of CH4 was 0.678 Gt/year from natural (51.2%) and anthropogenic (48.8%) sources. Enteric CH4 produced by cattle during ruminal fermentation contributes to anthropogenic sources; Gerber et al. (Reference Gerber, Steinfeld, Henderson, Mottet, Opio, Dijkman, Falcucci and Tempio2013) estimated that about half of anthropogenic sources are from cattle (0.166 Gt CH4/year) with beef production contributing 54% of total cattle CH4 emissions (0.089 Gt CH4/year).
Intergovernmental Panel on Climate Change (IPCC) (Reference Eggleston, Buendia, Miwa, Ngara and Tanabe2006) Tier 1 and Tier 2 methodologies use fixed emission factors to estimate CH4 production from cattle. These methodologies are used by most countries for national inventory of greenhouse gas emissions. Ellis et al. (Reference Ellis, Bannink, France, Kebreab and Dijkstra2010) showed that accuracy using IPCC (Reference Eggleston, Buendia, Miwa, Ngara and Tanabe2006) Tier 2 methodology is low and consequently when used at farm scale this approach could lead to imprecise estimation of CH4 released. Use of validated prediction equations (Tier 3 approach) could improve accuracy of estimating CH4 emissions. Various prediction equations have been developed specifically for beef cattle (e.g. Ellis et al., Reference Ellis, Kebreab, Odongo, Beauchemin, McGinn, Nkrumah, Moore, Christopherson, Murdoch, McBride, Okine and France2009; Ricci et al., Reference Ricci, Rooke, Nevison and Waterhouse2013; Moraes et al., Reference Moraes, Strathe, Fadel, Casper and Kebreab2014), but the accuracy of these equations over a range of diet compositions has not been determined using an independent data set.
Diet has a large effect on the ruminal microbial population, fermentation pattern and volatile fatty acid proportions, consequently these variables vary greatly between cattle fed high-forage and high-grain diets (Fernando et al., Reference Fernando, Purvis, Najar, Sukharnikov, Krehbiel, Nagaraja, Roe and Desilva2010; McCann et al., Reference McCann, Wickersham and Loor2014). Cattle fed forage diets produce a greater proportion of total volatile fatty acid as acetate, and thus more hydrogen is available for methanogenesis (Janssen, Reference Janssen2010), whereas cattle fed high-grain diets produce greater propionate proportion and thus less hydrogen is available for CH4 production. Prediction equations derived by regression methods are typically not diet specific and these are limited in their ability to consider the complex interactions between dietary composition and ruminal metabolism. Moreover, most CH4 prediction equations are not specific for beef cattle fed high-forage diets or high-grain diets.
We hypothesized that performance of current models used to predict CH4 production of beef cattle would be different for diets that vary in proportion of forage. The aims of this study were to (1) construct a database of CH4 emissions for beef cattle fed forage- and grain-based diets using published literature, and (2) identify the most precise and accurate extant CH4 prediction models for beef cattle fed diets varying in forage content.
Material and methods
Database description
The database was constructed using scientific papers published between 2000 and 2015. The Web of Science (Thomson Reuters, New York, NY, USA) and Papers© v2.8.1 (Mekentosj B.V., Dordrecht, The Netherlands) were used to search for peer-reviewed publications that reported effects of diet on CH4 production in beef cattle. Published papers were included in the database if they provided a description of the diets and results for CH4 production (g/day). The database considered 53 studies representing 207 treatments means (records) for CH4 production. Details of the studies are provided in Supplementary Table S1. Criteria for selecting data to include in the database were as follows: CH4 production, dry matter intake (DMI), dietary ingredients and chemical composition. Data used to develop the extant equations were included in the database, but to avoid bias due to the same data being used between studies to develop a particular equation, common data were excluded from the evaluation of that equation. This comprised 9.2% of the records for Ellis et al. (Reference Ellis, Kebreab, Odongo, McBride, Okine and France2007) and 17.8% for Ricci et al. (Reference Ricci, Rooke, Nevison and Waterhouse2013). Data used by Ellis et al. (Reference Ellis, Kebreab, Odongo, Beauchemin, McGinn, Nkrumah, Moore, Christopherson, Murdoch, McBride, Okine and France2009), Yan et al. (Reference Yan, Porter and Mayne2009), Ricci et al. (2013) were from local experiments that were not published in peer-reviewed literature.
Missing data on diet composition from publications were estimated from feed tables, by diet formulation software (CPM-Dairy® and Rumnut©) or by calculations from data provided within the paper. Variables in the database were as follows: BW (kg) and proportions (g/kg dry matter (DM)) of CP, NDF, ADF, non-fiber carbohydrates (NFC), hemicellulose (HC), cellulose (CEL), fat, sugar, starch, ADL and their respective intakes (kg/day). Gross energy (GE, MJ/kg DM), metabolizable energy (ME, MJ/kg DM), gross energy intake (GEI, MJ/day) and metabolizable energy intake (MEI, MJ/day) were also included. The response variable was production of CH4 (g/day). Measurements of CH4 other than as grams per day were converted.
High dietary forage concentration generally represents diets fed to growing cattle and breeding stock compared with feedlot finishing cattle. Thus, the criterion of dietary forage (g/kg DM) was used to divide the database into two data sets. One data set comprised treatments with ⩾400 g/kg DM dietary forage, the other comprised treatments with ⩽200 g/kg DM dietary forage.
Gross energy equations
Equations that included GE were evaluated twice; first, with observed GE values when reported in the papers (44 studies; records=176) and second, with GE values calculated (SIM) as suggested by National Research Council (2001) for all papers, omitting the observed values.
Extant prediction equations
In all, 54 extant equations to estimate CH4 production in beef cattle from five studies and IPCC (Reference Eggleston, Buendia, Miwa, Ngara and Tanabe2006) Tier 2 were evaluated (listed in Supplementary Table S2; references given in Supplementary Material S1). For IPCC (Reference Eggleston, Buendia, Miwa, Ngara and Tanabe2006), the CH4 conversion factor (Ym) was 3.0% for diets containing ⩾900 g/kg DM concentrate or 6.5% for diets containing <900 g/kg DM concentrates. Ellis et al. (Reference Ellis, Kebreab, Odongo, McBride, Okine and France2007 and Reference Ellis, Kebreab, Odongo, Beauchemin, McGinn, Nkrumah, Moore, Christopherson, Murdoch, McBride, Okine and France2009) developed equations that consider diet composition variables. Yan et al. (Reference Yan, Porter and Mayne2009) equations are based on contents of energy and DMI. Ricci et al. (Reference Ricci, Rooke, Nevison and Waterhouse2013) equations consider GEI (MJ/day) and DMI (kg/kg DM), as well as feed type (1 or 0 according to level of concentrate > or ⩽500 g/kg DM diet) and state variables (0=non-lactating cows; 1=lactating cows). Moraes et al. (Reference Moraes, Strathe, Fadel, Casper and Kebreab2014) presented separate equations for heifers (H) and steers (S) with hierarchical levels based on GEI (gross energy level (GEL), MJ/day), dietary level (DL), which included GEI (MJ/day) and NDF (g/kg DM), and animal level (AL) based on BW (kg), GEI (MJ/day) and NDF (g/kg DM). For steers, equations for GEL and DL were the same (S-GEL=S-DL). Models reported by Bratzler and Forbes (Reference Bratzler and Forbes1940), Blaxter and Clapperton (Reference Blaxter and Clapperton1965), Jentsch et al. (Reference Jentsch, Schweigel, Weissbach, Scholze, Pitroff and Dernol2007), Kebreab et al. (Reference Kebreab, Clark and Wagner-Riddle2009), Alemu et al. (Reference Alemu, Dijkstra, Bannink, France and Kebreab2011), Bannink et al. (Reference Bannink, van Schijndel and Dijkstra2011), Ramin and Huhtanen (Reference Ramin and Huhtanen2013) were not evaluated because the information needed for these equations was not provided in most of the papers.
Using both data sets, each equation was evaluated within the range of dietary forage proportion used in its development (Table 1). Moraes et al. (Reference Moraes, Strathe, Fadel, Casper and Kebreab2014) did not report the range of dietary forage used to develop their equations, therefore the range of NDF proportion of the diets was used instead. Conditional arguments were used to determine appropriate variable values in the Ricci et al. (Reference Ricci, Rooke, Nevison and Waterhouse2013) and Moraes et al. (Reference Moraes, Strathe, Fadel, Casper and Kebreab2014) equations that consider categorical variables.
Description of published databases used to develop equations to predict CH4 in beef cattle

DM=dry matter.
Evaluation of methane equations
Exploratory analyses and overlay plots of the database were performed to reveal the variable distributions. Outliers were identified and excluded by Mahalanobis distance using BW, daily intakes of DMI, NDF, NFC, ADF, fat, starch, GE and CH4 production. Mahalanobis distance takes into account the correlation structure of the data and the individual scale to compare with reference line. From each point to the center of the multivariate normal distribution Mahalanobis calculates a distance and compares the value with a reference line called upper control limit. If the distances of each point exceed the upper control limit, the point is outside of the correlation structure and it is considered to be an outlier (Kleinbaum et al., Reference Kleinbaum, Kupper, Muller and Nizam1998; SAS, 2015). Various statistics were used to evaluate goodness of fit of predictions from each equation. Precision and accuracy were evaluated using concordance correlation coefficient (r c ) (Lin, Reference Lin1989). Evaluation of the prediction error was made by computing the root mean square prediction error (RMSPE), overall bias (ECT), error due to deviation of the regression slope from unity (ER) and random error (ED) as suggested by Bibby and Toutenburg (Reference Bibby and Toutenburg1977). Model efficiency (MEF) was computed as suggested by Tedeschi (Reference Tedeschi2006).
Residuals were plotted against predicted values for the individual equations. The independent variable of predicted CH4 production was centered around the mean predicted value before the residuals were regressed on the predicted value (St-Pierre, Reference St-Pierre2003).
Combined index
Use of numerous statistics to evaluate goodness of fit makes it difficult to rank the performance of equations, because the ranking differs depending on the method used. Thus, a combined index (CI) was developed by applying principal component analysis to the matrix formed by all statistical (e.g. adjusted R 2, r c , RMSPE (g/day), mean square prediction error, ECT%, ER%, ED% and MEF) values used to assess goodness of fit for each equation. More important principal components (⩾1) were selected and rotated by Varimax method to obtain final communalities for each statistic. The relationships between statistics must be orthogonal to elude overestimation, thus only one statistic was chosen per quadrant (r c , RMSPE (g/day), ED% and MEF) to create the CI. It is desirable that predictions from each model are accurate and precise (Tedeschi, Reference Tedeschi2006). Consequently, each model must predict values close to the observed value (higher r c ), with low prediction error (lower RMSPE), large random non-systematic error (higher ED) compared with other error sources, and also the model must be efficient (MEF⩽1). For each equation the value for each of the four statistics were adjusted by multiplying by its value of final communality obtained from rotation of components, and then the equations were ranked according to these values from 1 to 54 (from best to worst values) for each statistic, obtaining four rankings. The rankings for the four statistics were summed to obtain a CI for each equation. Thus, the lowest CI indicates the best performance, and consequently the best equation. The five best-fit equations from the analysis of 54 equations using high-forage and high-grain data sets, along with the IPCC (Reference Eggleston, Buendia, Miwa, Ngara and Tanabe2006) Tier 2 as a reference, are reported herein. Ranking of the best 30 equations for each data set are provided in the Supplementary Tables S3 (high-forage diets) and S4 (high-grain diets).
Results
Data sets
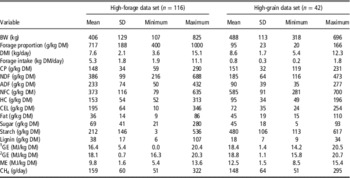
The complete database (n=207) was divided into two data sets, high-forage (⩾400 g/kg dietary forage DM content, n=151) and high-grain (⩽200 g/kg dietary forage DM content, n=50) content. The mean, SD, minimum and maximum values for the variables are shown in Table 2. Six treatment means were excluded because they were considered to represent transition diets (210 to 390 g/kg of dietary forage content DM basis). In all, 21 treatments means were excluded because they were from studies where animals were fed restrictively or additives for CH4 mitigation were fed. Moreover, 22 treatment means (19 from high-forage data set and three from high-grain data set) were excluded because they were identified as outliers by Mahalanobis distance.
Summary of nutrient profiles and CH4 emissions for the high-forage and high-grain data sets used to evaluate the models

DM=dry matter; DMI=dry matter intake; NFC=non-fiber carbohydrate; HC=hemicellulose; CEL=cellulose; GE=gross energy; ME=metabolizable energy.
1 GE values from the original studies.
2 GE simulated values using National Research Council (2001) formula for GE.
The high-forage data set had an average BW of 406 kg and 717 g/kg dietary forage DM content compared with a BW of 488 kg and 95 g/kg DM from forage for the high-grain data set (Table 2). The DMI in the high-forage data set was lower than in the high-grain data set (7.6 v. 8.6 kg/day, respectively), and as expected forage intake was greater for the high-forage than high-grain data set (5.3 v. 0.8 kg DM/day, respectively). Mean NDF and ADF contents for the high-forage data set were 386 and 233 g/kg DM, respectively, compared with 185 and 90 g/kg DM, respectively, for the high-grain data set. Fat and starch contents for the high-forage data set were 36 and 212 g/kg DM, respectively, and lower than for the high-grain data set with 45 and 480 g/kg DM, respectively. The CH4 production was greater for the high-forage compared with the high-grain data set (159 v. 148 g/day, respectively).
Equations evaluated with a high-forage data set
The five best-fit equations for the high-forage data set ranked using the CI are shown in Table 3. IPCC (Reference Eggleston, Buendia, Miwa, Ngara and Tanabe2006) Tier 2 ranked first (CI=24). Three equations from Moraes et al. (Reference Moraes, Strathe, Fadel, Casper and Kebreab2014) outperformed the other equations; equation S-AL ranked second (CI=39; Moraes et al., Reference Moraes, Strathe, Fadel, Casper and Kebreab2014), SIM S-AL ranked third (CI=44; Moraes et al., Reference Moraes, Strathe, Fadel, Casper and Kebreab2014), S-GEL ranked fourth (CI=53; Moraes et al., Reference Moraes, Strathe, Fadel, Casper and Kebreab2014) and N ranked fifth (CI=56; Ellis et al., Reference Ellis, Kebreab, Odongo, Beauchemin, McGinn, Nkrumah, Moore, Christopherson, Murdoch, McBride, Okine and France2009).
Summary of the five best-fit CH4 prediction equations using the high-forage data set ranked by combined index (CI)

N=ordinal number assigned to each equation (Supplementary Table S2); R 2adj=adjusted coefficient of determination; r c =concordance correlation coefficient; C b =bias factor; RMSPE=root mean square prediction error; ECT%=error due to overall bias of prediction as percentage of mean square prediction error (MSPE); ER%=error due to deviation of the regression slope from unity as percentage of MSPE; ED%=random or disturbance error as percentage of MSPE; MEF=model efficiency; S=steers; AL=animal level; SIM S-AL=calculated gross energy for animal level equations; GEL=gross energy level.
Values for r c were >0.7 for equations IPCC (0.715) and S-AL (0.725) with slightly lower values obtained for equations SIM S-AL (0.646), S-GEL (0.678) and N (0.601). Lower RMSPE (g/day) was obtained for equations N (35.6) and IPCC (39.8). Equations S-AL, SIM S-AL and S-GEL obtained RMSPE values >40 (g/day). Moreover, RMSPE (%) was lower for equations N (23.9) and IPCC (25.0). Random error for all five equations was the principal source of error. The ED computed for equation IPCC (98.7%) was slightly greater than that obtained for SIM S-AL (94.5%), and notably greater than that obtained for S-AL (87.2%), S-GEL (81.8%) and N (76.4%). With the exception of IPCC and SIM S-AL, the error from overall bias of prediction (ECT%) was low (<2.0%) for the best-fit equations.
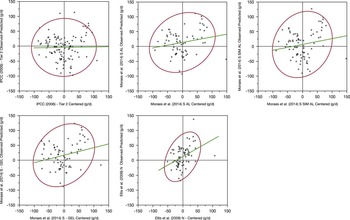
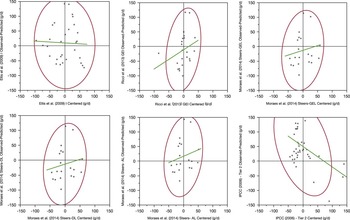
Values of MEF obtained for the best-fit equations were <1, with relatively similar values for all five equations (0.56, 0.59, 0.52, 0.53 and 0.47 for IPCC, S-AL, SIM S-AL, S-GEL and N, respectively). Mean biases were significant for equations S-AL, S-GEL and N (P<0.01; Table 4). Equations with significant linear bias were S-GEL (P<0.05) and N (P<0.01) with a maximum bias of −2.1, 40.5, 35.4, 47.9 and 72.7 g CH4/day at the maximum predicted value of 326.3, 304.8, 302.5, 277.2 and 245.9 g CH4/day, respectively, and a minimum bias of −5.7, −4.1, −11.1, −2.1 and −23.7 (g CH4/day) at the minimum predicted value of 77.8, 64.3, 65.5, 78.7 and 75.6 g CH4/day, respectively. Plots of the regression residuals on centered predicted values of CH4 with density shadowing at 95% for each equation is shown in Figure 1, where intercept equal to 0 and slope equal to 1 indicate absence of bias.
Plots of observed minus predicted methane (CH4) production (g/day) v. centered CH4 production for various CH4 prediction equations using the high-forage data set. The ellipse indicates the shadow density at 95%, the solid line indicates the regression and absence of bias occurred when intercept was equal to 0. SIM=calculated gross energy; AL=animal level; S=steers; GEL=gross energy level.

Evaluation of bias for the best-fit CH4 prediction equations using the high-forage data set

N=ordinal number assigned to each equation (Supplementary Table S2); S=steers; AL=animal level; SIM S-AL=calculated gross energy for animal level equations; GEL=gross energy level.
*P<0.05, **P<0.01.
Equations evaluated with a high-grain data set
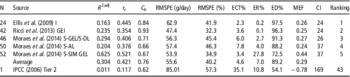
The ranking of best-fit equations (Table 5) using the high-grain data set differed substantially from the ranking of equations for the high-forage data set (Table 4). Equations IPCC (Reference Eggleston, Buendia, Miwa, Ngara and Tanabe2006) Tier 2, S-AL, SIM S-AL, S-GEL (Moraes et al., Reference Moraes, Strathe, Fadel, Casper and Kebreab2014) and N (Ellis et al., Reference Ellis, Kebreab, Odongo, Beauchemin, McGinn, Nkrumah, Moore, Christopherson, Murdoch, McBride, Okine and France2009) that ranked high for the high-forage data set lost accuracy and precision when they were used with the high-grain data set. Best-fit equations for the high-grain diets were I (CI=24; Ellis et al., Reference Ellis, Kebreab, Odongo, Beauchemin, McGinn, Nkrumah, Moore, Christopherson, Murdoch, McBride, Okine and France2009), GEI (CI=24; Ricci et al., Reference Ricci, Rooke, Nevison and Waterhouse2013), S-GEL/S-DL (CI=26; Moraes et al., Reference Moraes, Strathe, Fadel, Casper and Kebreab2014), S-AL (CI=37; Moraes et al., Reference Moraes, Strathe, Fadel, Casper and Kebreab2014) and S-SIM GEL (CI=37; Moraes et al., Reference Moraes, Strathe, Fadel, Casper and Kebreab2014). On average, these equations had smaller r c (0.421), greater ED (89.2%), smaller MEF (0.29) and greater RMSPE (55.6 g/d) values than those for the high-forage data set. The r c values were intermediate for equations I (0.445), S-GEL/S-DL (0.406) and S-SIM GEL (0.521), and lower for GEI (0.354) and S-AL (0.376) equations.
Summary of the five best-fit CH4 prediction equations using the high-grain data set ranked by combined index (CI)

N=ordinal number assigned to each equation (Supplementary Table S2); R 2adj=adjusted coefficient of determination; r c =concordance coefficient correlation; C b =bias factor; RMSPE=root mean square prediction error; ECT%=error due to overall bias of prediction as percentage of mean square prediction error (MSPE); ER%=error due to deviation of the regression slope from unity as percentage of MSPE; ED%=random or disturbance error as percentage of MSPE; MEF=model efficiency; GEI=gross energy intake; S=steers; GEL=gross energy level; DL=dietary level; AL=animal level.
The principal source of error for the best-fit equations tested with the high-grain data set was ED, as was observed for high-forage diets, but the proportion of error attributed to ED was similar (mean, 87.7% v. 89.2%, respectively), error attributable to ECT was decreased by −2.2%, and conversely, ER error was increased by 1.6%. The average MEF of the best-fit equations was 0.29, which was lower than the MEF value computed for the best-fit equations for the high-forage (0.53) data set.
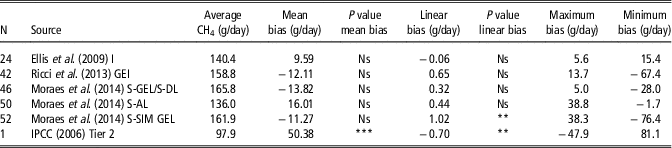
The IPCC Tier 2 equation was ranked 43th with low r c (0.117), high RMSPE (85.01%), inappropriate MEF (−0.78) and high proportion of ECT (35.1%) instead of random sources (54.1%), but mean biases were not observed (Table 6). Significant linear bias was observed only for equation S-SIM GEL (P<0.05).
Evaluation of bias for the best-fit CH4 prediction equations using the high-grain data set

N=ordinal number assigned to each equation (Supplementary Table S2); GEI=gross energy intake; S=steers; GEL=gross energy level; DL=dietary level; AL=animal level.
**P<0.01, ***P<0.001.
Plots of the regression of residuals on centered predicted values of CH4 and the shadow density at 95% for each equation are shown in Figure 2. Absence of bias occurred when intercept was equal to 0.
Plots of observed minus predicted methane (CH4) production (g/day) v. centered CH4 production for various CH4 prediction equations using the high-grain data set. The ellipse indicates the shadow density at 95%, the solid line indicates the regression and absence of bias occurred when intercept was equal to 0. GEL=gross energy level; GEI=gross energy intake; AL=animal level; DL=dietary level.

Discussion
The 54 extant equations evaluated were from a relatively small number (i.e. five) of studies. Although the studies used different databases, potential correlation within and among studies may have occurred because the diets used in equation development were similar in nutritional dietary contents and intakes. However, only databases used by Ellis et al. (Reference Ellis, Kebreab, Odongo, McBride, Okine and France2007) and Ricci et al. (Reference Ricci, Rooke, Nevison and Waterhouse2013) shared common data (n=90, 20 studies), and although the Ricci et al. (Reference Ricci, Rooke, Nevison and Waterhouse2013) database was larger than that of Ellis et al. (Reference Ellis, Kebreab, Odongo, Beauchemin, McGinn, Nkrumah, Moore, Christopherson, Murdoch, McBride, Okine and France2009), the common data represented 46.4% of its total data. Despite commonality of data, the prediction equations from those two studies used different approaches and generally did not share common variables. Ellis et al. (Reference Ellis, Kebreab, Odongo, Beauchemin, McGinn, Nkrumah, Moore, Christopherson, Murdoch, McBride, Okine and France2009), Yan et al. (Reference Yan, Porter and Mayne2009), Moraes et al. (Reference Moraes, Strathe, Fadel, Casper and Kebreab2014) developed equations from independent databases. There were similarities in dietary characteristics and intakes among the databases used by Ellis et al. (Reference Ellis, Kebreab, Odongo, McBride, Okine and France2007 and Reference Ellis, Kebreab, Odongo, Beauchemin, McGinn, Nkrumah, Moore, Christopherson, Murdoch, McBride, Okine and France2009), Yan et al. (Reference Yan, Porter and Mayne2009), Ricci et al. (Reference Ricci, Rooke, Nevison and Waterhouse2013), Moraes et al. (Reference Moraes, Strathe, Fadel, Casper and Kebreab2014, heifers and steers) and our high-forage data set, as indicated by the ranges for the variables. The SD for daily nutrient intakes (DMI, NDF, ADF, starch and fat) indicate that ranges overlapped among the databases used in the various studies even though the means were not the same across the databases. For instance, mean NDF intake (kg/day) in the database used by Ellis et al. (Reference Ellis, Kebreab, Odongo, Beauchemin, McGinn, Nkrumah, Moore, Christopherson, Murdoch, McBride, Okine and France2009) was smaller than that for our high-forage data set (2.22 v. 2.82 kg/day, respectively) but the range of ±1 SD indicates that the high-forage data set included the range used in Ellis et al. (Reference Ellis, Kebreab, Odongo, Beauchemin, McGinn, Nkrumah, Moore, Christopherson, Murdoch, McBride, Okine and France2009) (1.84 to 3.78 v. 1.51 v. 2.93 kg/day, respectively). Similarity in range of nutrient intakes among the various studies indicates that the high-forage data set was appropriate for evaluating these equations. In addition, any common data between the high-forage data set and the data used to develop the extant equations were excluded to eliminate bias in evaluating these equations.
The exclusion of treatment means from studies that used feed additives to mitigate CH4 and/or restrictive feeding was necessary because the effects of additives are not accounted for by extant prediction equations and CH4 production is affected by restriction of DMI.
As expected, mean dietary NDF content and intake were lower for the high-grain (185 g/kg DM, 1.59 kg/day) v. high-forage data set (386 g/kg DM, 2.93 kg/day). Furthermore, mean NDF content (g/kg DM) of the high-grain data set was less than that for the other databases (470, Ellis et al., Reference Ellis, Kebreab, Odongo, McBride, Okine and France2007; 326, Ellis et al., Reference Ellis, Kebreab, Odongo, Beauchemin, McGinn, Nkrumah, Moore, Christopherson, Murdoch, McBride, Okine and France2009; 491, Yan et al., Reference Yan, Porter and Mayne2009; 444, Ricci et al., Reference Ricci, Rooke, Nevison and Waterhouse2013; 358, Moraes et al., Reference Moraes, Strathe, Fadel, Casper and Kebreab2014 for steers; and 412, Moraes et al., Reference Moraes, Strathe, Fadel, Casper and Kebreab2014 for heifers). Similarly, dietary ADF content (g/kg DM) was less for the high-grain data set (90) than that for other studies (312 and 184, Ellis et al., Reference Ellis, Kebreab, Odongo, McBride, Okine and France2007 and Reference Ellis, Kebreab, Odongo, Beauchemin, McGinn, Nkrumah, Moore, Christopherson, Murdoch, McBride, Okine and France2009; 288, Yan et al., Reference Yan, Porter and Mayne2009; 270, Ricci et al., Reference Ricci, Rooke, Nevison and Waterhouse2013; 216, Moraes et al., Reference Moraes, Strathe, Fadel, Casper and Kebreab2014 for steers; and 246, Moraes et al., Reference Moraes, Strathe, Fadel, Casper and Kebreab2014 for heifers).
As intended, the high-grain data set was characterized by greater mean dietary content and intake of NFC (585 and 5.03 v. 373 g/kg DM and 2.83 kg/day, respectively) and starch (480 and 4.13 v. 212 g/kg DM and 1.61 kg/day, respectively) compared with the high-forage data set. These differences in dietary contents can influence CH4 production. Indeed, the high-grain data set was characterized by lower production of CH4 (148 g/day) than was the high-forage data set (159 g/day). As CH4 production is affected by intake and nutrient content of the diet, the performance of the various prediction equations differed according to the data set used.
Performance of equations evaluated with a high-forage data set
Performance of CH4 prediction equations was evaluated specifically for diets containing ⩾400 g/kg dietary forage content because high-forage diets have greater proportion of fiber and lower proportion of NFC promoting acetate production in the rumen, which favors methanogenesis (Kebreab et al., Reference Kebreab, Dijkstra, Bannink and France2006).
The best-fit equations for the high-forage data set had on average greater r c and MEF, and lower RMSPE than the remaining equations indicating appropriate accuracy and precision when equations were applied to the high-forage data set. The greater r c value for IPCC Tier 2 and S-AL (0.715 and 0.725) indicated these equations were more sensitive to predicting CH4 than the other equations. However, Moraes et al. (Reference Moraes, Strathe, Fadel, Casper and Kebreab2014) reported an RMSPE for equation S-AL (15.1%), which was lower than the RMSPE computed for that equation with real (observed) and simulated values of GEI in the present study (26.5% and 28.6%). This greater prediction error is likely because the high-forage data set used in the present study represented a wide range of experiments from diverse countries accentuating the variability of each variable.
DMI is generally positively associated with CH4 (Beauchemin et al., Reference Beauchemin, McAllister and McGinn2009; Shibata and Terada, Reference Shibata and Terada2010), but by itself is not necessarily associated with ruminal acetate fermentation and thus may fail to accurately predict CH4 production, especially when diets contain highly digestible carbohydrates. DMI is only considered by equation IPCC (Reference Eggleston, Buendia, Miwa, Ngara and Tanabe2006). The variables BW and GEI were considered in equation S-AL and SIM S-AL and only GEI was considered in equation S-GEL (Moraes et al., Reference Moraes, Strathe, Fadel, Casper and Kebreab2014); however, IPCC (Reference Eggleston, Buendia, Miwa, Ngara and Tanabe2006) indirectly uses GEI, because it multiplies GE content (18.5 MJ/kg DM) by DMI. Dietary fiber associated with acetate production and starch associated with propionate production was considered by equation N (Ellis et al., Reference Ellis, Kebreab, Odongo, Beauchemin, McGinn, Nkrumah, Moore, Christopherson, Murdoch, McBride, Okine and France2009) as starch/NDF (kg/day). This parameter value is <1 and thus has less impact on estimating CH4 than NDF alone. In addition, this factor adjusts the other components of equation N based on DMI. The r c computed for N (0.601) was greater than originally reported (0.598). Conversely, RMSPE of 23.9% for equation N (Ellis et al., Reference Ellis, Kebreab, Odongo, Beauchemin, McGinn, Nkrumah, Moore, Christopherson, Murdoch, McBride, Okine and France2009) obtained in our study was smaller than originally reported (30.8%). Better performance of N in our study is attributed to the positive relationship between NDF and DMI on CH4. The ED computed for equation N was lower than obtained by Ellis et al. (Reference Ellis, Kebreab, Odongo, Beauchemin, McGinn, Nkrumah, Moore, Christopherson, Murdoch, McBride, Okine and France2009) (76.4% v. 95.8%, respectively). Fat content of diets, which is associated with lower CH4 production (Martin et al., Reference Martin, Morgavi and Doreau2009), was not considered by any of the best-fit equations but may be indirectly considered by equations that include GEI, when GE content is measured directly rather than assumed to be constant.
Performance of equations evaluated with a high-grain data set
Given that feedlot cattle in North America are fed high-grain diets, the performance of extant equations was evaluated using a high-grain data set. High-grain diets promote fermentation of non-structural carbohydrates and propionate production that provides a competitive pathway for hydrogen use in the rumen, thereby decreasing CH4 production (Johnson and Johnson, Reference Johnson and Johnson1995; Beauchemin et al., Reference Beauchemin, McAllister and McGinn2009).
The best-fit equations for the high-grain data set had on average lower r c (0.421) and MEF (0.29) and greater RMSPE (40.2%) than the best-fit equations tested with the high-forage data set, indicating less accuracy and precision of equations applied to the high-grain data set. This reduced equation performance likely originates from the difference in range of dietary forage content originally used to develop the equations (i.e. high-forage diets) compared with the high-grain data set with which they were tested. Also, the best-fit equations using the high-grain data set were different than those using the high-forage data set, indicating that variables used by equations to predict CH4 in high-grain diets are different than variables used by equations to predict CH4 in high-forage diets.
Ricci et al. (Reference Ricci, Rooke, Nevison and Waterhouse2013), using physiological stage and levels of concentrate (> or ⩽500 g/kg DM) as correction factors, showed that precision of CH4 predictions was improved when GEI was included as a principal predictor of CH4. However, using the high-grain data set showed that DMI and energy content of feed (GE or ME) were not associated with increased CH4 production for high-grain diets. High-grain diets have high energy content because fiber components are replaced by starch and fat (Table 2), which both cause changes in ruminal fermentation and a reduction in CH4 production (Beauchemin et al., Reference Beauchemin, McAllister and McGinn2009; Cottle et al., Reference Cottle, Nolan and Wiedemann2011). Equation I does not consider GEI as a predictor, but instead considers MEI (MJ/day). In addition, equation I includes CEL as a positive predictor, with HC and fat as a negative predictors; consequently, the accuracy and precision of this equation was greater than the other equations that consider GEI, NDF, forage proportion and BW. Jentsch et al. (Reference Jentsch, Schweigel, Weissbach, Scholze, Pitroff and Dernol2007) reported that the fiber components HC and CEL have a positive impact on CH4 production. However, this effect was not completely observed in equation I because it considers only MEI and CEL as positive predictors of CH4 with HC and fat as suppressors of CH4 production.
Performance of IPCC (Reference Eggleston, Buendia, Miwa, Ngara and Tanabe2006) Tier 2 equation
The IPCC was established by the United Nations Environmental Programme and the World Meteorological Organization in 1988 to assess information relevant for the understanding of human-induced climate change, its potential impacts, and options for mitigation and adaptation. In 2006, IPCC released a Tier (1, 2 and 3) methodology for calculating national CH4 inventories from livestock. Specifically, Tier 2 assumes that 6.5%±1% of GEI is converted to CH4 for cattle fed forage-based diets and 3%±1% of GEI for feedlot cattle fed diets containing ⩾900 g/kg DM concentrates. Because of wide adoption of the IPCC (Reference Eggleston, Buendia, Miwa, Ngara and Tanabe2006) approach, the performance and relative ranking of the Tier 2 equation was presented as a reference.
Despite its relative simplicity, the performance of the IPCC Tier 2 equation ranked first for the high-forage diets. It had similar r c (0.715), RMSPE (25.0%) and MEF (0.56), but greater ED (98.7%) when compared with other more complex equations that consider dietary composition. The relatively strong performance of the IPCC (Reference Eggleston, Buendia, Miwa, Ngara and Tanabe2006) equation for high-forage diets may reflect that the Ym used (6.5%) originated from a wide range of diets with a large proportion of forage. In contrast, for high-grain diets, the IPCC Tier 2 equation ranked 43th indicating that the Ym used by the IPCC Tier 2 model may not be appropriate for diets with a low proportion of forage. It should be acknowledged that because of the limited availability of data for feedlot cattle fed diets containing ⩾900 g/kg concentrate DM, the high-grain data set included diets containing ⩾800 g/kg concentrate DM. It is likely that the CH4 conversion factor for diets with intermediate forage content is overestimated by IPCC (Reference Eggleston, Buendia, Miwa, Ngara and Tanabe2006; i.e. >3 but <6.5). Our results are consistent with Ricci et al. (Reference Ricci, Rooke, Nevison and Waterhouse2013), who reported that the IPCC (Reference Eggleston, Buendia, Miwa, Ngara and Tanabe2006) equation predicted 26% more CH4 than equations they developed using a database of diets containing >500 g/kg dietary concentrate DM.
Conclusions
Current models may give inaccurate values of CH4 production when used for beef cattle fed diets ranging in proportion of forage, particularly for high-grain diets. Thus, choice of equation used to estimate CH4 production for beef cattle must consider type of diet. Use of equations selected based on their performance for either high-forage or high-grain diets can help improve accuracy of prediction. Use of an inappropriate model may introduce substantial error into CH4 emission prediction and hence lead to incorrect computation of greenhouse gas inventories or inappropriate mitigation recommendations. In addition to using the appropriate model, primary data for feed intake and diet composition are needed to generate accurate estimates of CH4 production. The limited availability of CH4 production data for cattle fed high-grain diets restricts the development and assessment of accurate CH4 prediction models for feedlot operations.
Acknowledgments
This project was supported by Agriculture and Agri-Food Canada. The authors wish to thank T. Entz of the Lethbridge Research and Development Centre for providing statistical advice and L. Tedeschi of Texas A&M University for providing input into early discussions of the work. P. E.-B. is supported by scholarships from Becas Chile – CONICYT – Chile.
Supplementary material
For supplementary material/s referred to in this article, please visit http://dx.doi.org/10.1017/S175173111600121X