By the end of the Great Depression, young women were more likely to have left their Southern farm homes for the city than men. The early twentieth-century exodus of rural youth from U.S. farms—an economic sector rooted in traditional gender roles with a long history of racial segregation and discrimination—is a case study in how migrant destination choice and selection can look very different by both race and gender. At the time, social scientists and government officials speculated about the causes of this rural exodus, especially that of women who previously had not been such a large share of the U.S.’s rural-to-urban migrant population (Hatcher Reference Hatcher1930; Kneeland Reference Kneeland1928; Ward Reference Ward1920). For example, a 1920 Literary Digest article titled “Why Young Women are Leaving Our Farms” emphasized the backbreaking, but often under-valued, work required of a farm wife both in the field and in the home and stated: “Becoming a trifled bored with this unexciting round of toil, the farmer’s daughter casts an understanding eye at the neighboring farmer’s son who had been hanging around her ivy-clad porch, reflects on what he has to offer, and catches the next train to Squedunk or New York” (The Literary Digest 1920, p. 56).
In this paper, I study the selection and sorting characteristics of young, never-married rural farm-to-city migrants from and within the U.S. South from 1900–1940. I argue that the specific racial and gendered aspects of Southern farming—gendered division of labor and paternalism in farming, a system of sharecropping in which racial discrimination and violence were embedded, and the declining “marriageability” of young men on farms—amplified women’s motivations for migration. The first half of the twentieth century was a period of intense change for U.S. farmers, including the farm crisis of the 1920s and 1930s, when many farms faced foreclosure and farm tenure mobility fell, and the Great Depression. Importantly, this time period also aligns with the first wave of the Great Migration from 1910 to 1940, when more than 1.5 million Black men and women left the South for the urban North. I examine the ways in which gender and race conditioned the migration decision, not just off-farm but also off-farm out of the South.
Questions about how migrants’ characteristics compare to those who stayed behind and to where migrants move have formed the basis of a large number of studies in the context of migration to and within the United States during the first half of the twentieth century.Footnote 1 Measuring migrant selection and sorting is essential for understanding the consequences of migration on the sending and receiving communities, as well as on the migrants themselves. Unfortunately, due to challenges in linking women before and after their migration, most studies on historical migration flows have focused exclusively on men.
My main source of data is the new Census Tree Database (Buckles et al. Reference Buckles, Haws, Price and Wilbert2023; Price et al. Reference Price, Buckles, Leeuwen and Riley2021; Price et al. Reference Price, Buckles, Haws and Wilbert2023), which links both women and men across decennial censuses by leveraging user-generated links made on the genealogy website FamilySearch.org. I examine over 800,000 never-married women and men aged 5 to 30 at the start of each decade, linked across the years 1900–1910, 1910–1920, 1920–1930, and 1930–1940. I begin by establishing some key facts about off-farm migration by gender. I show that while women were less likely to migrate off-farm than men from 1900 to 1920, women’s propensity for off-farm migration began to rise significantly after 1920. By the 1930–1940 period, White women were 2.5 percentage points more likely to migrate off-farm to an urban area than White men, and Black women were 3.1 percentage points more likely to migrate off-farm to an urban area than Black men. These differences persist after the inclusion of both individual sociodemographic and county-level controls, as well as after comparing brothers and sisters within households.
Women’s growing likelihood of migration compared to men during the 1920s and 1930s, I argue, reflects ongoing structural inequalities in farming that limited women’s access to their own land, control over their own earnings, and a better life, which were amplified by the farm crisis during those years. I expand on this idea by showing how women were more responsive than men to declines in farm tenure mobility—a key measure of men’s “marriageability” on farm. Among counties with lower levels of mobility up the tenure ladder from farm wage worker to tenant, women were significantly more likely to leave the farm than men.
I next look at migrant sorting and selection, focusing first on how far migrants moved and to what extent migrant networks were important in predicting migration. I show that across all decades, women migrated shorter distances than men. Large networks were especially important for out-of-South moves compared to within-South and reflected the greater costs associated with a longer move. To measure selection across these two destinations, I compare the characteristics of young female migrants to those who stayed on farm. For White women, traditional measures of migrant “skill” such as literacy and school attendance were important predictors of both types of migration. For Black women, literacy, school attendance, and being from a family-owned farm were all significant predictors of migration out of the South compared to non-migrants. However, for those who stayed within the South, only literacy significantly predicted off-farm migration, and farm ownership is instead negatively associated with migration. These differences reflect how racial discrimination varied between regions, as Black women were constrained to a smaller number of jobs than their White counterparts, particularly in the South, as well as the importance of family resources in making the longer moves out of the South, where networks were more important in facilitating migration. These patterns also add nuance to how we understand the Great Migration, as many may have had to begin their journeys by making shorter moves to a Southern urban area before continuing on to the North.
To better understand the mechanisms behind my quantitative results, I draw on archival material that explains women’s attitudes toward farm work and farm marriage, and why urban living offered them more in terms of independence and social and economic mobility than their male counterparts. This material also offers glimpses into the consequences of the farm crisis and Great Depression for women. These sources include surveys from the time period, personal accounts of women in the form of autobiographies and oral histories of those who took part in this migration, and the observations of social scientists concerned about the exodus of rural youth.Footnote 2
This paper builds upon several literatures. The first is that of migrant selection and sorting in the Great Migration (Collins Reference Collins2021). Studies of the first wave of the migration have demonstrated that Black male migrants were more likely to have more years of education, to be literate, and have higher occupation and income scores from 1910 to 1930 (Collins and Wanamaker Reference Collins and Wanamaker2014, Reference Collins and Wanamaker2015; Margo Reference Margo1988), but that overall the degree of positive selection was quite small (Collins and Wanamaker Reference Collins and Wanamaker2015). Many, including Vigdor (Reference Vigdor2002) and Boustan (Reference Boustan2017), emphasize how the traditional Roy model of migration, which would predict that Black male migrants from the South would have fewer years of education than those who stayed, is better revised to highlight the role of the social and political freedoms outside of the Jim Crow South as a major motivating factor. In this paper, I examine the Great Migration in the context of a larger rural-to-urban transition, exploring the ways in which, in addition to an individual’s education and literacy status, community networks and a family’s farm characteristics, such as ownership and family size, enabled or hindered migration. This also allows me to address how the Great Depression, which increased uncertainty about employment in urban areas, functioned in the migration decision.
This paper also aligns with studies of the U.S. farm crisis and with feminist migration scholarship. The causes of farm distress (Alston Reference Alston1983; Rajan and Ramcharan Reference Rajan and Ramcharan2015), effects on fertility (Kitchens and Rodgers Reference Kitchens and Rodgers2023), and the labor and migration effects of federal recovery policies (Fishback, Horrace, and Kantor Reference Fishback, Horrace and Kantor2006; Whatley Reference Whatley1983) have been well studied. However, the effects of this period of crisis on women’s migration have been overlooked. I add to this literature by explicitly considering the roles of resources and gendered expectations within the family, building on the work of feminist migration scholars. I include questions about how motivations, costs, and benefits differed for women, and to what extent power dynamics within the household affected selection into migration (Pessar Reference Pessar, Hirschman, Kasinitz and Dewind1999). Scholars of female migration have emphasized migration that was specifically for marriage (Diner Reference Diner1983; Fan and Huang 1998; Friedman-Kasaba Reference Friedman-Kasaba1996). I follow this literature by exploring evidence in my archival sources of migration of migration not only for work, but for better marriage opportunities, in addition to measuring gendered responses to men’s declining tenure mobility.
HISTORICAL AND THEORETICAL BACKGROUND
The Farm Crisis and Other Push and Pull Factors
The period from 1900 to 1940 encompassed an important period of change for the farm family: agricultural mechanization, environmental challenges such as the boll weevil and Dust Bowl, the farm crisis of the 1920s and 1930s, the Great Depression, growing wage work opportunities in cities for U.S.-born men and women due to increasing immigration restrictions, and the first wave of the Great Migration. In this paper, I emphasize the roles of the farm crisis, the Great Migration, and the Great Depression in conditioning selection and sorting over each decade, especially as they related to women’s decision to marry and stay on farm.
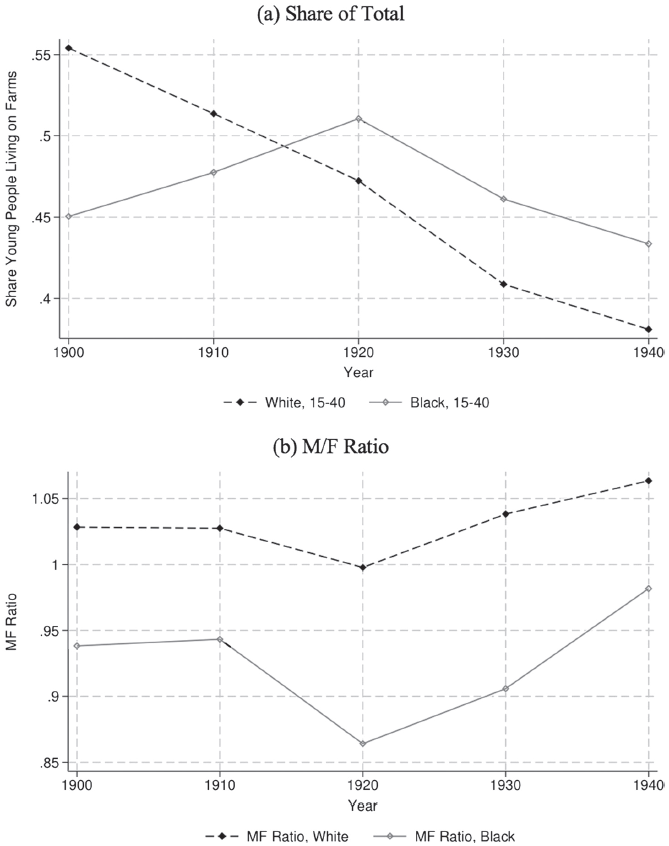
The farm crisis of the 1920s and 1930s altered many aspects of farm family formation, as farmers experienced steep drops in farm commodity prices, increased rates of farm foreclosures, and a decline of farm tenure mobility as fewer rose through the ranks from wage worker to tenant to owner (Alston Reference Alston1983; Alston and Ferrie Reference Alston and Ferrie2005). Declines in farm profitability and rising farm debt taken on during the boom period in the 1910s also made the establishment of new farm families more difficult. The distress caused by this boom-and-bust period, however, was just one of many challenges facing the farm sector. A falling farm population and rapid mechanization were further accelerated by federal efforts to stabilize farm prices during the 1930s with legislation such as the Agricultural Adjustment Act of 1933 (AAA), which paid farmers to remove land from production and led to out-migration (Fishback, Horrace, and Kantor Reference Fishback, Horrace and Kantor2006). Throughout the 1920s and 1930s, the U.S. farm population fell by an average of 521,000 people each year (Olmstead and Rhode Reference Olmstead, Rhode, Carter, Gartner, Haines, Olmstead, Sutch and Wright2006). Figure 1 shows the change in the share of never-married young people aged 15 to 40 who were living on farms and the male-to-female ratio of this group in each decade in the South. Panel (a) shows a steady decline of young White men and women on farms from 1900–1940, accelerating during the early farm crisis years. Among Black men and women, the farm crisis reversed decades of increasing farm population. Panel (b) highlights the increasing male-to-female ratio on farms during the farm crisis.
SINGLE MEN AND WOMEN AGE 15–40 ON SOUTHERN FARMS, 1900–1940
Notes: Panel (a) shows the share of Southern never-married men and women aged 15 to 40 who were living on a farm in each decade. Panel (b) shows the male-to-female ratio of these men and women who were living on a farm.
Source: 1900–1940 complete count Decennial Censuses.

Figure 1 Long description
The image contains two line graphs. The first graph, labeled (a) Share of Total, shows the share of young people aged 15 to 40 living on farms from 1900 to 1940. The x-axis represents the years, and the y-axis represents the percentage of young people living on farms. Two lines are plotted: one for White individuals and one for Black individuals. The second graph, labeled (b) M/F Ratio, shows the male-to-female ratio of these individuals living on farms over the same period. The x-axis represents the years, and the y-axis represents the M/F ratio. Two lines are plotted: one for White individuals and one for Black individuals. The graphs illustrate trends in off-farm migration by gender and race over the specified decades.
Whether a woman marries or enters and stays in the labor market can depend on the supply of “marriageable” men, meaning a supply of potential male partners who are high earners with stable employment. Poor White and Black women, however, could not depend on marriage to enable them to leave the labor market. Black couples faced racial discrimination in both hiring and wages, and had to have both partners working. Jones (Reference Jones1985, p. 150) describes how this was often the reality for Black women: “Marriage intensified the differences between Black and White working-class women. Although many young working girls might have indulged in romantic fantasies about marriage, few Black women could count on a wedding to end their days of sustained wage earning.”
The U.S. farm at this time was most often a family enterprise characterized by early marriage and high fertility. Even prior to the farm crisis, marriage on the farm did not conform to the “idealized” version of marriage where the husband specialized in market (or, in this case, farm) work and the wife in non-market work (Becker Reference Becker1981). When and if a woman became a farm wife, she did not cease working. Economist Hildegard Kneeland (Reference Kneeland1928) estimated that farm women worked on average 63 hours a week. Folbre and Wagman (Reference Folbre and Wagman1993), who measured the household production of farm women between 1800 and 1860, argue that farm productivity is likely overstated as it relies heavily on the “hidden” market work done by women and children on farms. Particularly during this period, a wife being able to stay home and not participate in field work or any work outside of the home was a social achievement.
For women who were weighing their option of marrying, becoming a farm wife, and staying in their farming community, their decision was just as much influenced by their potential husbands’ earning opportunities as by their own. As many women stated in their personal accounts of their decisions to leave farming, the drudgery, as well as back-breaking work that came with being a farm wife, seemed less desirable as avenues toward farm ownership decreased and more independent earning opportunities off-farm increased (Hatcher Reference Hatcher1930; Jones Reference Jones1985; Kneeland Reference Kneeland1928). Migration may also increase women’s marriage opportunities through access to a larger number of “acceptable” men to marry (Diner Reference Diner1983; Fan and Huang 1998; Friedman-Kasaba Reference Friedman-Kasaba1996; Pedraza Reference Pedraza1991). The farm crisis of the 1920s and 1930s can be thought of not just as an adverse shock to the supply of marriageable men in farm communities, but also to a particular type of marriageable men that would allow women to realize society’s ideal of wives who only specialized in work within the home, rather than the field as well.Footnote 3
The Great Migration and Migrant Selection
The period under study also falls during the Great Migration from 1910 to 1970, when more than six million Black men and women migrated out of the South. White men and women moved in smaller but not insignificant numbers as well. During the first wave from 1910 to 1940, White and Black out-migration from the South exceeded in-migration, though the Great Depression slowed these migrations as unemployment rose in Northern cities, especially for Black individuals (Berry Reference Berry2000; Boustan Reference Boustan2017; Fligstein Reference Fligstein1981). A significant amount of research across disciplines has been done on this mass movement of Black Americans, in addition to a smaller body of work on White South-to-non-South migrants.Footnote 4 This paper alters the frame through which the Great Migration is viewed. For many Black men and women who left the South, there was often an initial move to a Southern city, which would pave the way in terms of experience in urban jobs and knowledge of migration routes. Those migrants may look fundamentally different from the ones who made direct routes North (Gottlieb Reference Gottlieb1987). I also place the Great Migration in the context of off-farm migration, both within and out of the South, focusing on how migration patterns can change in the context of macroeconomic shocks to the farm and how gender and race influenced the migration decision over time.
This paper compares the migrants who left the farm to those who stayed behind and expands upon the framework of the Roy model (Borjas Reference Borjas1987; Roy Reference Roy1951). Often, studies focus on whether there will be “positive” or “negative” selection, meaning more or less “skilled” (usually defined as more years of education or job experience) individuals relative to the base population migrate based on who could expect to gain higher wage returns away from their home community. These decisions can be further influenced by expected wages and unemployment levels, particularly in rural-to-urban moves (Harris and Todaro Reference Harris and Todaro1970). Micro-level theories of migration tend to characterize the migration decision as taking place on an individual or household level, with the family collectively acting to maximize expected income while minimizing risks (Massey Reference Massey, Hirschman, Kasinitz and Dewind1999). In these theories, the individual is most often thought of as a genderless or male migrant, and the household decision is seen as occurring without conflict. A feminist approach asks how the scale of female and male migration might differ, whether receiving-area reactions to migrants are gendered, and the ways in which migration influences and reflects gendered constraints on who moves, where, and for what purpose (Green Reference Green2012; Pessar Reference Pessar, Hirschman, Kasinitz and Dewind1999). Gender-segmented employment opportunities can also create differential incentives between men and women, and limit the degree to which information is easily shared across networks (Pessar Reference Pessar, Hirschman, Kasinitz and Dewind1999).
These theories provide some predictions about migrant selection and sorting that I can test in both my quantitative and qualitative data. First, feminist migration scholarship’s emphasis on migration not just for work, but for marriage, is especially salient in the context of farm-to-city migration and gender differences in migration propensity during the farm crisis. As men’s farm tenure mobility and, thus, marriageability fell during the crisis, were women more likely to respond via migration off-farm to urban areas than men? Second, how did gender norms in terms of where it was appropriate for women to migrate, including reliance on family and community networks and resources, influence gender differences in migration distances? Finally, in the context of the Roy model, was there positive selection among female migrants as they weighed the few independent wage opportunities in rural farm areas over more abundant opportunities in urban areas, particularly those that rewarded women’s education? Did gender and racial discrimination in job opportunities or differences in available migration networks in region of destination (South or non-South) attenuate any of this positive selection? The difficulty of compiling a linked sample of women has meant that questions such as these have so far been limited to cross-sectional analysis (Curtis White et al. Reference Curtis White, Crowder, Tolnay and Adelman2005; Curtis White Reference Curtis White2005). By seeing women before and after their migration took place, I can examine characteristics pre-migration and highlight important racial differences between them.
DATA SOURCES
Census Tree Linked Data
My main source of data for this paper comes from the Census Tree Database (Buckles et al. Reference Buckles, Haws, Price and Wilbert2023; Price et al. Reference Price, Buckles, Leeuwen and Riley2021; Price et al. Reference Price, Buckles, Haws and Wilbert2023), which links individuals across decennial census years. The Census Tree uses user-generated information from FamilySearch.org to attach individuals to their historical records over time, supplemented with additional links using a machine learning algorithm, as well as with links from other projects such as the Census Linking Project (Abramitzky et al. Reference Abramitzky, Boustan, Pérez and Rashid2020) and the Integrated Public Use Microdata Series (IPUMS) Multigenerational Longitudinal Panel (Helgertz et al. Reference Helgertz, Price, Wellington, Thompson, Ruggles and Fitch2022).
Women changing their last names after marriage has been one of the major challenges to linking women over time.Footnote 5 The Census Tree Database provides a larger sample of women than can be achieved via name linking alone (including a larger sample of never-married to married women), and the links are of higher quality as family members building their family trees have more information on individual life circumstances with which to make an accurate link. This is especially important as false links are more likely to overstate migration rates. I reweight my samples to match the never-married population on post-migration characteristics following Bailey et al. (Reference Bailey, Cole, Henderson and Massey2020).Footnote 6 Final samples keep all men and women aged 5–30, never married, and residing on a rural (places with less than 2,500 inhabitants) farm in the South in each starting year.Footnote 7 I restrict my main analyses to never-married individuals to examine sorting and selection outside of the “tied” migration between a husband and wife, and to better capture those who were also considering marriage as a reason for migration.
Men’s Farm Tenure Mobility
The Census Tree data are also the source for my measure of men’s tenure mobility over decades. Studies that examine tenure ladder mobility and rely on cross-sectional data run the risk of incorrectly evaluating what type of mobility is occurring (or not occurring). Comparing positive changes in the shares of, for example, tenant farmers versus owners could mean greater upward mobility from the wage worker category into tenancy, or declining mobility as farm owners lose their farms to foreclosure (Kirkpatrick, McNall, and Cowles Reference Kirkpatrick, McNall and Cowles1933). It also fails to count how many individuals left farming altogether. Linked census data allow me to obtain information on farm tenure ladder mobility among the same men over time. These men represent the potential marriage partners of women who wished to remain on the farm.
When I observe a man over a decade from 1900–1940, I can measure the extent to which he was able to move up the farm tenure ladder over 10 years. I begin with the male population that was either living on their own farm or working in the farm sector and match individuals forward over the decade. I define men aged 16–40 as “employed in farming” if they are either living on a farm or working on a farm based on their occupation code. Because of the nature of occupational data in the decennial census, I can only categorize my linked men into three rungs: farm owners, farm tenants, and farm laborers.Footnote 8 Farm owners represent the upper rung of the farm tenure ladder, farm tenants the middle rung, and farm laborers the lower rung. Using my linked dataset, Equation 1 measures the share of men among each race group r, aged 16–40 at the start of the decade, who were able to move up at least one rung or step s from time t to t+10 for each county c.Footnote 9 I expect lower levels of farm tenure ladder mobility to be a key determining factor in a woman’s desire to leave her farming community.

Migration Distance and Networks
Another key part of my analysis is to examine the role of networks in facilitating migration differently by gender. I begin by measuring differences in raw migration distances in miles using latitudes and longitudes from the Census Place Project, which assigns precise geographic information to census records (Berkes, Karger, and Nencka Reference Berkes, Karger and Nencka2023). Next, using the complete set of links from Census Tree, I estimate migration network size as the proportion of individuals in a county who migrated to a different county, either within or out of the South, in the previous decade. I measure these network sizes separately by race and gender and expect that the larger the network, the lower cost of migration, and thus the greater the likelihood of migration for individuals from that community.Footnote 10
Archival Sources
Finally, I use archival sources to better understand the mechanisms of gendered migration. I primarily rely on the personal accounts of women who undertook this migration in the form of oral histories, personal essays, and small studies conducted at the time. Oral histories come from the Black Women’s Oral History Project,Footnote 11 as well as the oral history collection and analysis of Black domestic workers in D.C. from 1910–1940 in Living In, Living Out by Elizabeth Clark-Lewis. I also draw upon autobiographical essays and small studies that were conducted by the Southern Women’s Educational Alliance (SWEA), an organization with the goal of increasing rural girls’ education, and the papers of Amber (Arthun) Wharburton, who headed SWEA from 1947–1963. Personal accounts from migrant women come from autobiographical essay assignments written for the various economics courses taught by Amber Wharburton in both Pennsylvania and Georgia, including at the Summer School for Women Workers in Industry, which aimed to provide educational opportunities for young working women (both Black and White) with minimal prior education. These rich sources, in addition to reports conducted by various Agricultural Experiment Stations throughout the United States, provide the bulk of my qualitative references.
EMPIRICAL APPROACH
I focus on three main questions: (1) To what extent was off-farm migration gendered?, (2) How does marriageability (measured as men’s tenure mobility), network size, and gender dynamics within and outside the household influence differences in migration propensity between men and women?, and (3) How did women select into off-farm migration, both within and out of the South, and how did this selection change over time? Replication code for all results is available online (Withrow Reference Withrow2026).
I first used a version of the model generalized as follows:

where  if individual i lived on a rural farm in the start year (1900, 1910, 1920, or 1930) and was living off-farm in an urban area in time t + 10, 10 years after the start year.
 is equal to 0 if the individual is still living on a rural farm in the South at the end of the decade. Equation (2) is estimated as a linear probability model.
In Equation (2), my coefficient of interest is β 1 where Xit is a vector of indicator or continuous variables describing a demographic or economic characteristic of the individual in the start year: whether the individual is female, literate (age 10+), in school (age 5–18), living on a family-owned farm, whether the individual has a literate parent, the number of siblings, and whether the individual is the oldest observed sibling of their gender in the household. β 1 measures the differences in likelihood of migration based on an individual’s characteristics. γi are age fixed effects, and θct are county-of-origin fixed effects.
In the case of specifications measuring the relationship between a county-level measure and an individual’s migration likelihood, I modify Equation (2) as follows:

Here, β 2 captures the relationship between a county-level measure M: male tenure mobility or network size, on migration propensity. θst are state-of-origin fixed effects. All regressions use robust standard errors that are clustered at the county-of-origin level.
I also repeat the following analyses using a few different alternative samples: (1) limiting to those aged 13 and over, (2) limiting to only those linked via an individual constructing their family’s genealogy on FamilySearch.org (the “family tree,” most conservative links available in the Census Tree database), (3) including those who married between census years in addition to those who remain single, and (4) those linked using the ABE method. These results are available in full in Online Appendix B, and results are consistent across alternative samples.
GENDER DIFFERENCES IN MIGRATION LIKELIHOOD
Male and Female Migration Likelihoods
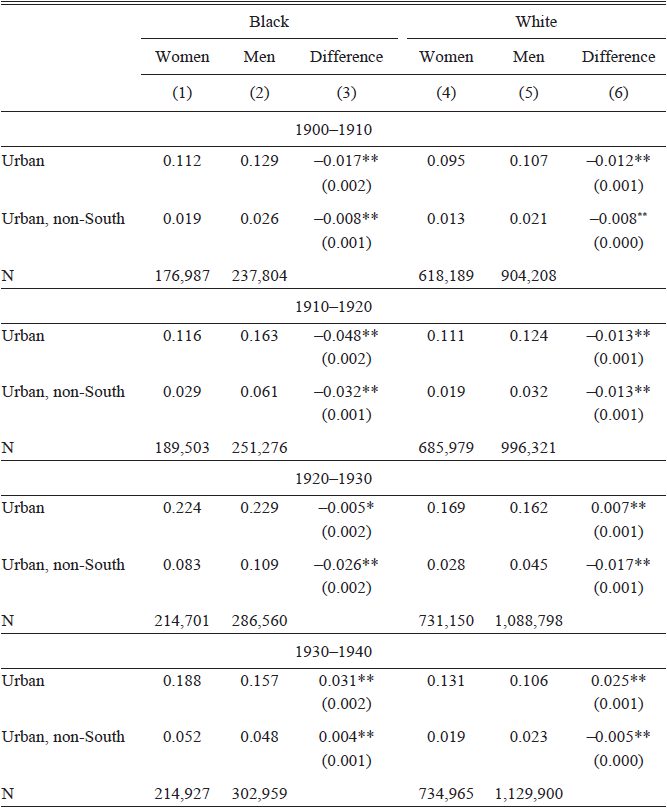
My initial analyses focus on establishing key facts about gendered migration during this period. I begin by examining the extent to which gender is a predictor of migration off-farm over time. Table 1 shows the share of men and women by race linked across each decade who migrated off-farm to an urban area anywhere, or specifically to an urban area outside of the South by the end of each 10-year period, weighted to be a representative sample based on their end-year characteristics.Footnote 12 Non-migrants are those who were still living on a rural farm in the South by the end of the decade. Columns (1)–(2) and (4)–(5) show the share of each sample who migrated off a farm, and Columns (3) and (6) measure the difference in those shares, using a t-test to determine whether those differences are statistically significant. A positive number in Columns (3) or (6) indicates that women were more likely to migrate off-farm than men.
OFF-FARM MIGRATION RATES, BY DESTINATION AND DECADE

Table 1 Long description
The table presents off-farm migration rates by destination and decade for Black and White populations, highlighting gender differences. It includes data for the periods 1900-1910, 1910-1920, 1920-1930, and 1930-1940. The table is divided into sections for Black and White populations, with columns for women, men, and the difference between them. Each section further breaks down migration to urban areas and urban areas outside the South. Notable trends include statistically significant differences in migration rates between men and women, with variations across different decades and regions. The table also includes the sample size (N) for each group and period.
Notes: Table shows the share of off-farm migrants in each sample by gender and race linked across decadal censuses (1900–1910, 1910–1920, 1920–1930, and 1930–1940). Columns (1)–(2) and (4)–(5) show the shares; Columns (3) and (6) show the difference in those shares, as well as the robust standard error of the difference. Farm rural-to-urban migrants are those who began the decade living on a rural farm in the South and who were living off-farm in an urban area by the end of the decade. Non-migrants are those still living on a farm in the South. Up to 1940, the U.S. Census Bureau defined an urban area as cities or incorporated places with 2,500+ inhabitants. Robust standard errors clustered at county of origin in parentheses, + p < 0.10, * p < 0.05, ** p < 0.01.
Source: Census Tree linked samples, 1900–1940.
Two key patterns stand out: First, during the 1900 to 1940 period, the share of men and women migrating off-farm peaks in the 1920s during the first decade of the farm crisis, then falls during the Great Depression. The share of women leaving the farm for urban areas almost doubles between 1900 to 1930. Black women were more likely than White women to be migrating off-farm—the difference in migration rates between the two rising to almost 6 percentage points during the 1920s. Among all, there was a decline in farm-to-city migration during the Depression years, but especially among men, reflecting a pattern of women being less reactive in terms of migration to changes in labor market signals (Greenwood Reference Greenwood2008). Second, women were less likely than men to migrate off-farm during the 1900s and 1910s, but it is during the 1920s that White women became more likely than men to migrate to an urban area than stay on a Southern farm. By the 1930s, both Black and White women were about 2.5 to 3 percentage points more likely to migrate than men. Black women also closed the gender gap in migration propensities out of the South by the 1930s.Footnote 13
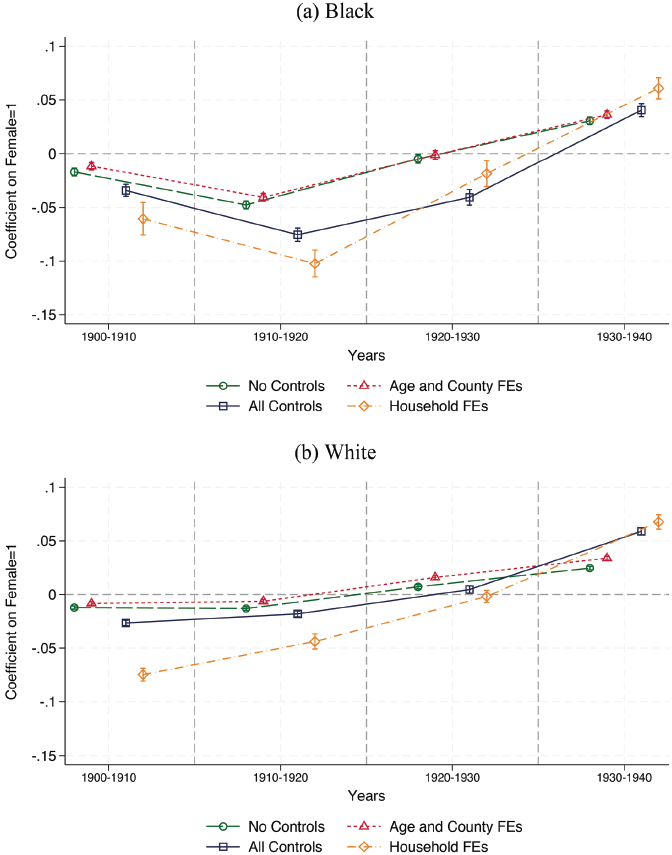
Figure 2 shows the results of Equation (2), where the dependent variable is whether the individual is a farm-to-city migrant and the coefficient of interest is a dummy variable equal to 1 if the individual is female, measuring differences in migration propensities by gender. The figure shows four different versions of this setup: (1) no controls, (2) including age and county-of-origin fixed effects, (3) including fixed effects as well as the set of individual characteristics but excluding school attendance due to its smaller age range, and (4) comparing young men and women under 18 in the same household and using household fixed effects. Overall, I find that all versions show a similar pattern: women’s likelihood of migration compared to men’s rises after 1920, and all women become more or just as likely as men to migrate off-farm by the 1930s, regardless of age, county of origin, or other individual characteristics.
FARM-TO-CITY MIGRATION LIKELIHOOD, BY RACE
Notes: Figures display the coefficient plots of regressions following Equation (2), where the outcome variable is whether the individual migrated off-farm to an urban area over the course of each decade, and the coefficient of interest is a dummy variable = 1 if the individual is female. Linear probability regressions are run separately by race and decade using robust standard errors clustered at the county of origin. Household fixed effects regressions only include households where there is at least one male and one female never-married individual under 18 in the starting year.
Source: Census Tree linked samples 1900–1940.

Figure 2 Long description
The image contains two line graphs comparing the coefficient on female for Black and White individuals across four decades, from 1900 to 1940. The graphs illustrate the likelihood of farm-to-city migration by race. The x-axis represents the years in decades, while the y-axis represents the coefficient on female, ranging from -0.15 to 0.1. Each graph includes four lines representing different control variables: No Controls, Age and County Fixed Effects, All Controls, and Household Fixed Effects. For Black individuals, the coefficient starts negative in 1900-1910, dips further in 1910-1920, and then rises above zero in 1920-1930 and 1930-1940. For White individuals, the coefficient remains close to zero in 1900-1910, slightly negative in 1910-1920, and then increases above zero in 1920-1930 and 1930-1940. The trends indicate that the likelihood of female migration from farms to urban areas changes over time and differs by race and control variables. All values are approximated.
“The Farm Woman’s Problems”
In 1920, the United States Department of Agriculture published a report titled “The Farm Woman’s Problems,” aimed at better understanding why rural women were choosing to leave farm life and migrate to urban areas (Ward Reference Ward1920). Women’s growing likelihood of migration in linked census data is consistent with the overwhelming conclusion that was published in the form of reports like “The Farm Woman’s Problems” and smaller survey studies at the time: the farm regions of the United States were experiencing an increasing exodus of women. Differences in men’s and women’s migration rates over time reflect the role of not only better work opportunities off-farm, but also the roles of declining male marriageability on-farm as motivations for migration. I first draw on evidence from surveys and biographical sketches of women who decided to leave rural farming areas for urban centers to provide context for why the share of women leaving the farm grew during these years. I then show how, in areas with poor farm tenure mobility, women were more likely to respond via migration to an urban area than men.
Firstly, surveys of female migrants during this period reflect marriage as an incentive for migration. While interviewers for SWEA commented on the lack of direct evidence of White women’s marriage motivations for migration, they did consider them an important underlying cause:
It should be said, too, that although little was explained on this point by the girls themselves… there was probably in the drive of most of them towards the city the desire for a more normal amount of social contact with boys or men, and so for an opportunity to marry according to their own ideas of successful marriage… (Hatcher Reference Hatcher1930, pp. 52–53)
Della Thompson, one interviewee in the same study, followed up a discussion of the stressful uncertainty of farm prices with a wish that she would “marry a professor, or next best a rich man” when she moved to the city (Hatcher Reference Hatcher1930, pp. 16–17). This dissatisfaction with farmers as husbands was present too in some Black women’s accounts of their relationships. In an oral history interview from the Black Women Oral History Project, then schoolteacher Alice Allison Dunnigan, and later the first Black female Congressional reporter, describes her first marriage to a farmer:
I tried hard to make a go of it… but he was a rural farmer, and of course we had different views and different values… He vowed that teaching or not, I must help him with the farm work as other farmers’ wives did… After a while I became very tired and couldn’t keep up the pace. My husband was sharecropping with his father… But at the end of the year, they came out with no money at all. In fact, they were in debt to the landlord. This was not unusual among sharecroppers… (Dunnigan Reference Dunnigan1977, pp. 13–14)
In an oral history interview, Minnie Whitney, one of the many Black women who left the South as part of the Great Migration, describes that one of the reasons she left was the unyielding nature of farm work: “I started doing that [working on the farm] when I was about seven years old… So when I became 10, my father hired me like a boy to work for him. That was round the clock… he said go, you go. When he say get up, we get up and go” (Whitney Reference Whitney1984). She would later run away from home to escape the farm. After a discussion with her mother where she was told she could not marry and leave the farm until she was 21, she “realized that that was too many years that I had to stay under bondage of the family, so I left.” For Black women, the decision to migrate was further conditioned by consistently low wages for Black men and the exploitative nature of the sharecropping system. Sharecropping, through which farmers paid landowners a share of their crop, often meant a life of debt with limited upward mobility (Alston and Ferrie Reference Alston and Ferrie2005). For Black women in particular, a move cityward was a way to escape not just the patriarchal farm family but also some of the effects of racism and poverty fueled by White owners’ and banks’ unwillingness to sell or lend to Black potential farm owners (Ransom and Sutch Reference Ransom and Sutch2001).
A better standard of living than what being the wife of a farmer could provide might be obtained by delaying marriage in favor of off-farm work in the growing, independent wage-earning opportunities for women not easily accessed in rural areas. The definition of a better standard of living described by these migrant women ranged from access to modern technologies such as electricity or running water, independent earnings, entertainment such as movies, or just the excitement a city contained. Many of the women who left talked about a need for “freedom.” For Black and White women, this notion of “freedom” had some similarities in terms of control over one’s own wages, better control over work hours, and freedom for socializing and entertainment, but the realities of racism in the South, and particularly in Southern agriculture, meant that Black women faced a starkly different set of limits on their behavior, earnings, and livelihoods than White women. Although racism also pervaded Southern and Northern cities in the form of job and wage discrimination and violence, a Black woman could have more control over her earnings in an off-farm job.
Finally, legal limits on movement were also likely to contribute to women’s greater likelihood of migration, especially during the Depression years. For Black female and male potential migrants, vagrancy and anti-enticement laws played an important role in limiting migration. Vagrancy laws allowed local police to arrest anyone from the streets they saw without an obvious occupation, and Black men were disproportionately targeted (LeFlouria Reference LeFlouria2015). White planters, concerned about the loss of their low-wage and sharecropping workforce to labor recruiters both from the South and the North, sought to limit Black men’s movements to other work through violence, intimidation, and the law, including anti-enticement legislation (Anderson Reference Anderson2016; Naidu Reference Naidu2010). These legal limits on mobility reflect a starkly different set of migration costs facing Black—particularly male—migrants that become even more salient during the Depression as urban work opportunities fell.
Men’s Marriageability as a Push Factor
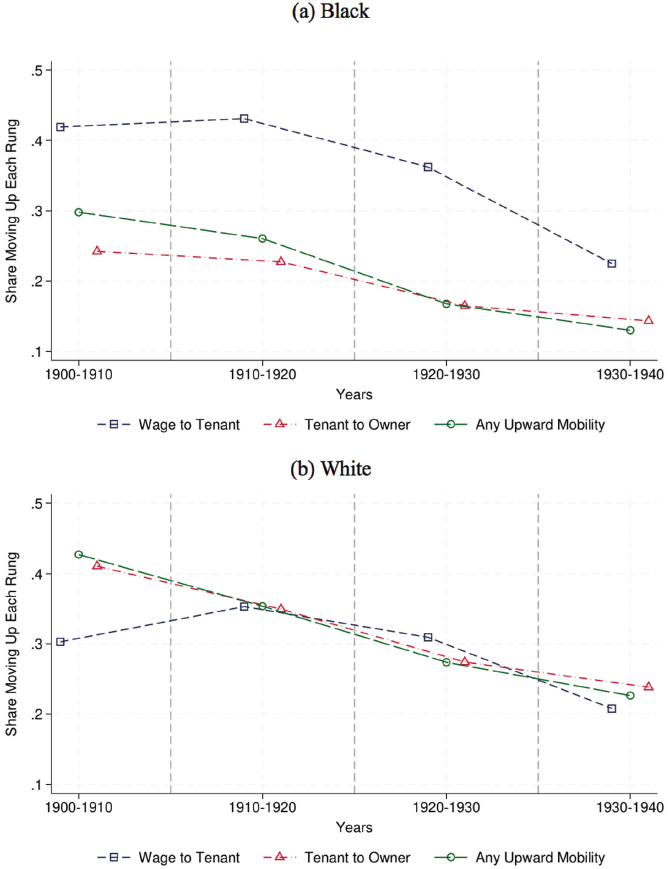
I test the relationship between men’s marriageability and women’s migration by examining migration propensity by gender in counties with different levels of farm tenure mobility during the farm crisis years, when tenure mobility was declining. Figure 3 shows the average share of men aged 16 to 40 who were able to rise up the farm tenure ladder each decade, following Equation (1). Overall, there is a decline in tenure mobility during the 1920s and the 1930s, especially among wage-to-tenant movers. For many women, their only access to economic mobility on the farm was through marriage. For example, sharecropping contracts, which are included in “tenant farming” in my analysis, relied on patriarchal supervision of labor and were given almost exclusively to men (Bercaw Reference Bercaw2003). Among women employed in farming in some capacity in 1920, only 3 percent of White women were listed as farm wage workers, along with only 13 percent of Black women. It was also very unusual for a woman to be the sole owner of a farm. In the South in 1920, an average of only 4 percent of farms were owned by sole female operators, the overwhelming majority of whom were White. Instead, women were listed mostly as “unpaid family workers.” Women, who were already constrained in farm economic life, thus were likely to respond to a greater extent than men to their sole avenue for economic mobility being eroded while urban opportunities for both work and marriage remained promising.
MEN’S TENURE MOBILITY, 1900–1940
Notes: Figures show the average share of men aged 16 to 40 who stayed in the same county and were able to rise from either wage worker to tenant, tenant to owner, or a lower rung to any higher rung (“any upward mobility”) over the course of each decade.
Source: Census Tree linked datasets.

Figure 3 Long description
Two line graphs compare the share of men aged 16 to 40 who moved up economic rungs in the U.S. from 1900 to 1940, separated by Black and White demographics. The top graph represents Black men, while the bottom graph represents White men. Each graph shows three lines indicating different types of upward mobility: wage to tenant, tenant to owner, and any upward mobility. The x-axis represents decades from 1900 to 1940, and the y-axis represents the share moving up each rung, ranging from 1 to 5. For Black men, the share moving from wage to tenant starts high around 4.5 in 1900 and declines steadily to around 2 by 1940. The share moving from tenant to owner remains relatively stable around 2.5, while any upward mobility starts around 3 and declines to just above 1. For White men, the share moving from wage to tenant starts around 3, peaks slightly above 4 around 1910, and then declines to around 2 by 1940. The share moving from tenant to owner starts around 3.5, declines to around 2.5 by 1920, and then stabilizes. Any upward mobility starts around 4, declines steadily, and stabilizes around 2 by 1940. All values are approximated.
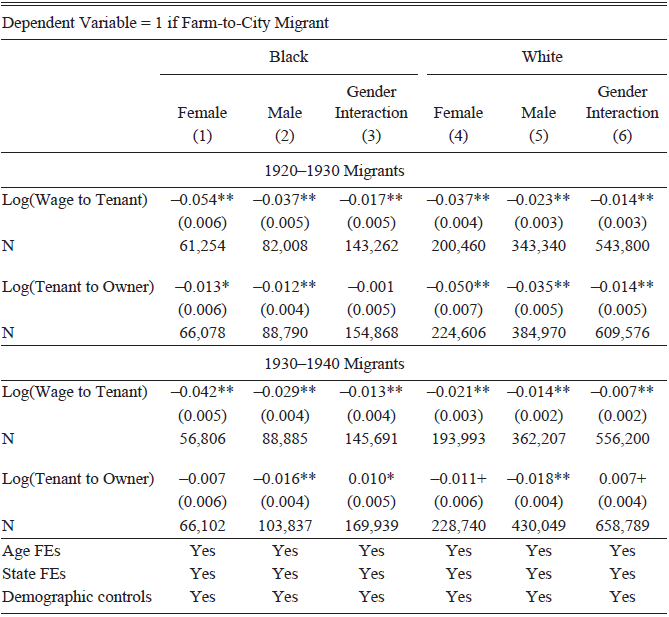
Following Equation (3), Table 2 shows the correlation between different levels of tenure mobility at the county level and men’s and women’s migration propensities.Footnote 14 All regressions include age and state of origin fixed effects, as well as controls for all demographic variables, excluding school attendance due to its age restrictions. Columns (1), (2), (4), and (5) show the coefficient of tenure mobility measures on an individual’s likelihood of migration. Columns (3) and (6) interact all coefficients with a female indicator variable, measuring the differences between men’s and women’s migration responses to men’s farm tenure mobility.
MIGRATION LIKELIHOOD AND TENURE MOBILITY

Table 2 Long description
The table presents data on the correlation between different levels of tenure mobility at the county level and the migration propensities of Black and White individuals. It includes regressions with age and state of origin fixed effects, as well as controls for demographic variables. The table is divided into two main periods: 1920-1930 and 1930-1940. For each period, it shows the impact of tenure mobility on the likelihood of migration for Black females, Black males, White females, and White males. Columns (1), (2), (4), and (5) display the coefficients of tenure mobility measures on an individual's likelihood of migration. Columns (3) and (6) interact all coefficients with a female indicator variable, measuring the differences between men's and women's migration responses to men's farm tenure mobility. The table includes specific coefficients and standard errors for each group, along with the number of observations (N) for each regression. Notable trends include negative coefficients for log wage to tenant and log tenant to owner across most groups, indicating a correlation between tenure mobility and reduced migration likelihood.
Notes: Dependent variable = 1 if the individual is a farm rural-to-urban migrant, 0 if the individual stayed on the farm in the South. Wage to Tenant and Tenant to Owner refer to the share of men aged 16 to 40 who are able to rise up each rung of the tenure ladder over the course of the decade. Columns (1), (2), (4), and (5) show the correlation between the share of individuals able to move up each rung of the tenure ladder at the county level and an individual’s migration likelihood by gender and race. Columns (3) and (6) show the interaction terms of tenure mobility and a gender dummy. All specifications include age and state of origin fixed effects as well as demographic characteristics but excluding school attendance. Robust standard errors clustered at the county of origin in parentheses, + p < 0.10, * p < 0.05, ** p < 0.01.
Source: Census Tree linked samples, 1900–1940.
Both Black and White women were more likely to stay on farms than men in counties with a higher share of men able to move from farm wage worker to farm tenant in both the 1920s and 1930s. A 1 percent increase in the share of men rising from wage worker to tenant over the decade is associated with a 5.4 percentage point decline and a 3.7 percentage point decline in migration likelihood among Black and White women, respectively. The relationship between men’s migration likelihood and mobility from wage work to tenant is almost 1.5 to 2 percentage points lower than women’s. Put another way, in counties with lower tenure mobility rates at the wage to tenant level, women were more likely to leave the farm than men. This relationship is significant across decades and races, and highlights how the particularly patriarchal nature of tenant farming and the expectation that families would be tenant farmers drove out-migration among single women from places where there were fewer of those opportunities.
Migration in response to mobility up to the final rung, owner, is more complex, especially during the Depression years. White women were more likely than men to stay on farm if a greater share of men were moving up from tenant to owner in the 1920s, though were just as likely as men to stay in response to tenant-to-owner mobility in the 1930s. Black men and women were equally likely not to migrate in response to increased tenant-to-owner mobility during the 1920s. By the 1930s, Black women were more likely to leave counties with greater tenant-to-owner mobility than men. In addition to signaling higher rates of marriageability among men, higher rates of tenant-to-owner movement among Black farmers also indicate a county with a lower degree of racism, as Black landownership was restricted in many Southern farming areas. Instead of keeping women on the farm, this may have instead provided these families with the additional resources to make longer moves out of the South to the urban North. Later, I examine the role of family resources in facilitating migration.
The 1930s results also highlight the important role of the Great Depression in gendered migration response. As urban wage work became particularly precarious for men in general, but especially Black men, it is actually men who were more likely to stay on farm in response to better mobility rates from tenant to owner. Boone and Wilse-Samson (Reference Boone and Wilse-Samson2023) explore the dynamic of men moving to or staying on farms during the Depression years as a form of informal insurance during economic downturn. The farm sector served as an outlet for struggling men and families who were able to engage in subsistence production, but single women would not have had the same opportunities.
Migration Distance and Networks
Migration distance and the role of networks are especially relevant in gendered migration. Often information about job and housing opportunities and routes is communicated through migration networks, which can significantly lower the costs of long-distance migration for a community. These networks might be smaller for women than men due to women’s historically lower migration distances, gendered expectations in where it was appropriate for women to migrate to (and with whom), and gender segregation in employment that limited the returns to long-distance migration.
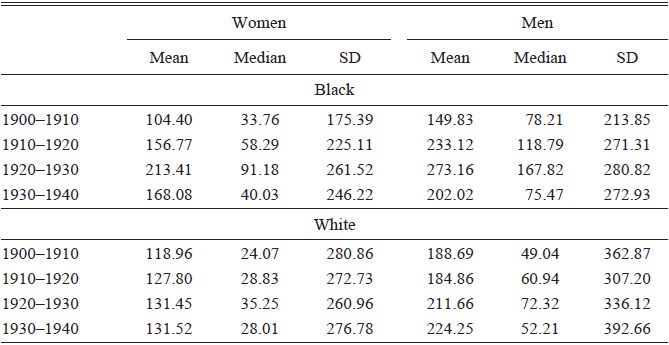
Table 3 shows the average, median, and standard deviation of miles moved among farm-to-city migrants by decade. Median distance rises overall from 1900–1930, then falls during the Depression years. Black migrants tend to move longer distances than White migrants during the 1910s–1920s, especially Black women compared to White women. Notably, median distance tends to be highest among Black men, with a peak median distance travelled of 168 miles in the 1920s. Women in each decade moved significantly shorter distances than men. During the Depression years, distance falls for everyone, but especially Black men.
DISTANCE MOVED, MILES

Table 3 Long description
The table presents data on the average, median, and standard deviation of miles moved among farm-to-city migrants by decade, separated by gender and race. It includes four decades from 1900 to 1940. The table has six columns: Mean, Median, and Standard Deviation for both Women and Men, and four rows for each decade. Black migrants tend to move longer distances than White migrants during the 1910s and 1920s, especially Black women compared to White women. Notably, median distance tends to be highest among Black men, with a peak median distance traveled of 168 miles in the 1920s. Women in each decade moved significantly shorter distances than men. During the Depression years, distance falls for everyone, but especially Black men.
Notes: Table shows the average, median, and standard deviation of the distance traveled in miles by farm rural-to-urban migrants in each decade. Latitude and longitude of migrants’ start and end locations are from the Census Place Project. Distance is measured using Stata geodist.
Source: Census Tree linked samples, 1900–1940.
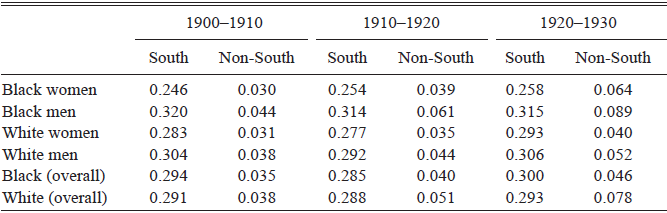
To measure network size, I estimate the share of individuals from a county who either migrated within-South or out-of-South in the previous decade. Table 4 shows the average size of these networks across race, gender, and destination region. I find that men’s networks tended to be larger than women’s networks, and that non-South networks grew over time.
NETWORK SIZE, BY RACE AND GENDER

Table 4 Long description
The table presents data on network sizes by race and gender across different regions and time periods. It includes data for Black women, Black men, White women, and White men, as well as overall data for Black and White individuals. The table is divided into three time periods: 1900-1910, 1910-1920, and 1920-1930, and compares network sizes in the South and Non-South regions. Notable trends include the growth of non-South networks over time and the tendency for men's networks to be larger than women's networks. The table has six columns: one for each time period and region combination, and eight rows: one for each demographic group and two overall rows. The data values represent the average size of networks.
Notes: Table shows the average share of a county’s population that left for either a Southern or non-Southern location over the course of each decade, by race and gender.
Source: full Census Tree linked samples, 1900–1940.
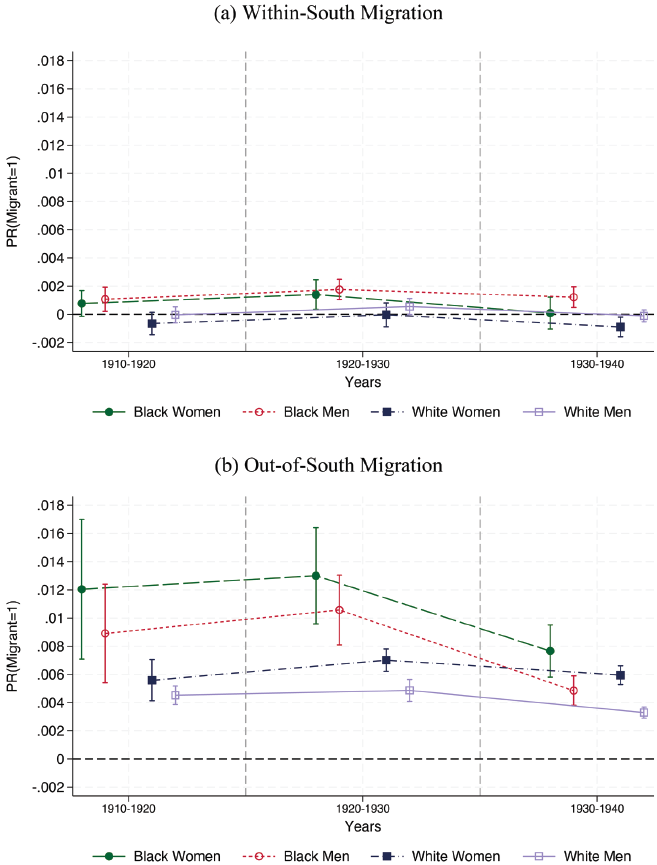
Following Equation (3), I then estimate the relationship between the size of an individual’s migrant network and his or her likelihood of migration, holding constant the complete set of demographic controls, excluding school attendance due to its age restrictions, as well as age and state-of-origin fixed effects. Each β 2 point estimate, estimated separately by race, gender, and destination region, represents the correlation between a 1 percentage point increase in the size of the migrant network and the likelihood that an individual migrated.Footnote 15 These results are presented in Figure 4.
MIGRATION NETWORK SIZE AND MIGRATION LIKELIHOOD
Notes: Figures display the coefficient plots of regressions following Equation (3), where the outcome variable is whether the individual migrated off-farm to an urban area over the course of each decade, and the coefficient of interest is on the share of the sending community who migrated (a) within South or (b) out of the South in the previous decade. Coefficients are offset to ease figure interpretation. Regressions are run separately by race and decade using robust standard errors clustered at the county of origin. All specifications include age and state of origin fixed effects, as well as demographic characteristics but excluding school attendance.
Source: Census Tree linked samples 1900–1940.

Figure 4 Long description
The image contains two line graphs. The first graph, labeled (a) Within-South Migration, shows the probability of migration within the South for Black women, Black men, White women, and White men from 1910 to 1940. The second graph, labeled (b) Out-of-South Migration, shows the probability of migration out of the South for the same groups over the same period. Each line represents a different demographic group, with Black women in green, Black men in red, White women in blue, and White men in purple. The x-axis represents the years in decades, and the y-axis represents the probability of migration. The graphs indicate trends and variations in migration patterns over time, with error bars showing the standard errors. All values are approximated.
For individuals considering leaving the South, there is a much larger relationship between the available migrant network and migration likelihood than for moves within the region. For example, a 1 percentage point increase in the share of individuals who left the South between 1910 and 1920 is associated with an increase in the likelihood of a Black woman migrating out of the South by 1.3 percentage points (a 12 percent increase over the mean migration rate) during the 1920s. In the same decade, a 1 percentage point increase in the within-South network is associated with only a 0.2 percentage point increase in her migration likelihood (0.5 percent of the mean). The importance of networks falls, however, during the Depression years. For out-of-South moves, these networks also appear more important for Black individuals than for White ones. Shorter, preliminary moves within the South would have been less costly, less reliant on networks, and may have helped facilitate eventual moves out of the South through transferable urban work experience or larger urban community networks.
While both men and women relied on networks in order to make these migrations, particularly over longer distances such as out of the South, gender norms regarding how appropriate it was for a young woman to be far from her family amplified the barriers to moving (Meyerowitz Reference Meyerowitz1988; Clark-Lewis Reference Clark-Lewis1994). Young women would have had less bargaining power within the household compared to their male counterparts, and women often were sent to a city that had a family member in it, or one that had been visited before with family. For example, among Black farmers, there was often a process of preparation for migration taken at the family level, as adult members coordinated with urban kin before the daughter would even be aware that she was expected to leave (Clark-Lewis Reference Clark-Lewis1994, p. 57).
MIGRANT SELECTION
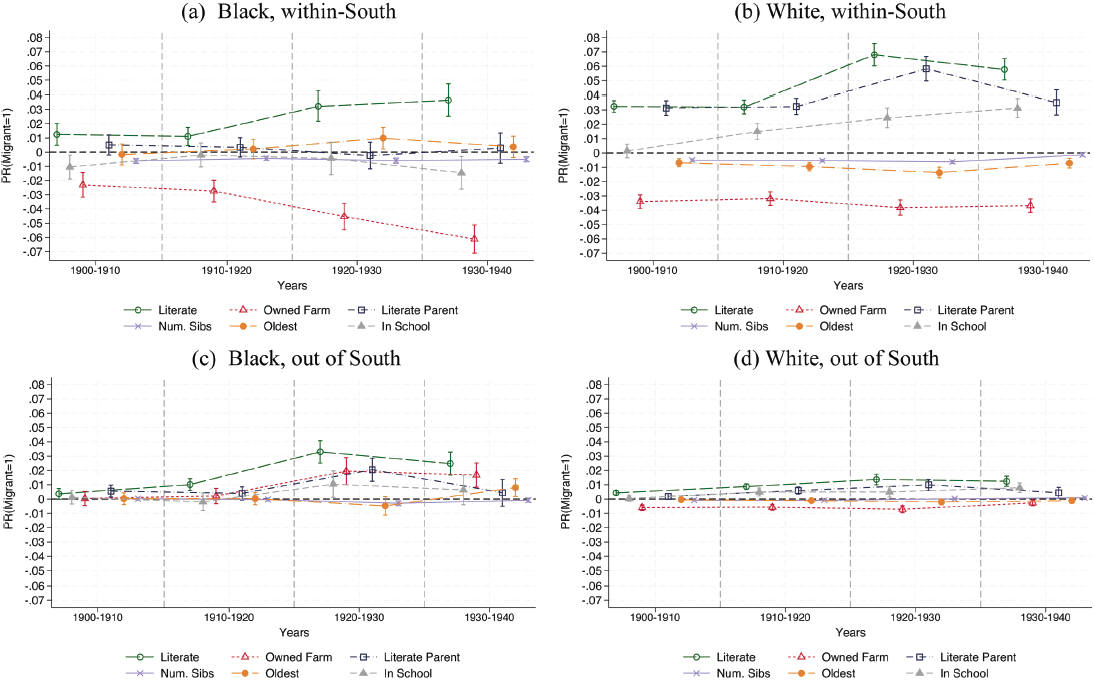
Finally, I look at how women’s selection into farm-to-city migration, both within the South and out of the South, changed over time. Following Equation (2), where the dependent variable is equal to 1 if the individual migrated off-farm to an urban area and 0 if the individual was still on a rural farm in the South by the end of the decade, Figure 5 shows Black and White women’s selection into migration.Footnote 16 Each coefficient represents the change in migration likelihood based on having that characteristic, holding all other characteristics constant, as well as age and county-of-origin fixed effects.Footnote 17 Because “In School” is only relevant for those aged 5 to 18 in the start year, that coefficient is limited to only that age range. All other coefficients are measured for those aged 10–30 (literacy is measured starting at 10 years old), and school attendance is excluded. For example, in Figure 5, Panel (a), Black women who were living on a family-owned farm in 1930 were about 6 percentage points less likely to migrate off-farm to an urban area within the South by 1940 than those who were living on a tenant farm. In the 1930 to 1940 period, the mean within-South migration rate among Black women aged 10–30 was 19.2 percent, meaning that being on a family-owned farm is associated with a reduction in migration likelihood of over 30 percent.
MIGRATION SELECTION
Notes: Figures display the coefficient plots of regression following Equation (2), where the outcome variable is whether the individual migrated off-farm to an urban area over the course of each decade, and the coefficient of interest is on each pre-migration characteristic. Coefficients are offset to ease figure interpretation. Regressions are run separately by race and decade using robust standard errors clustered at the county of origin. All results include age and county-of-origin fixed effects.
Source: Census Tree linked samples 1900–1940.

Figure 5 Long description
The image contains four line graphs that compare migration patterns of Black and White individuals within and out of the South from 1900 to 1940. Each graph represents different pre-migration characteristics: literacy, farm ownership, parent literacy, number of siblings, age, and schooling. The graphs are divided into four sections: (a) Black, within-South; (b) White, within-South; (c) Black, out of South; and (d) White, out of South. The x-axis represents the years in decades from 1900 to 1940, while the y-axis represents the probability of migration (PR(Migrant=1)). Each line within the graphs is color-coded and labeled to indicate different characteristics: literate, owned farm, literate parent, number of siblings, oldest, and in school. The graphs show trends over time, with some lines indicating an increase or decrease in migration probability based on the characteristic. For example, in graph (a), the line for 'Literate' shows an upward trend, indicating that literate Black individuals within the South were more likely to migrate over time. In contrast, the line for 'Owned Farm' shows a downward trend, suggesting that farm ownership decreased the likelihood of migration. Similar patterns are observed in the other graphs, with variations based on race and migration destination. The graphs provide a visual representation of how different factors influenced migration decisions during the early twentieth century. All values are approximated.
The Roy model of migrant selection explains migration on the basis of earnings differences between locations through measures of “skill” (usually defined as job experience or years of education) as the major determining factors in who migrates. Feminist theories of migration emphasize the role of the family in inhibiting or supporting a woman’s migration and the unequal power dynamics within families, in addition to gender segregation in the labor market. I first look at literacy, school attendance, and parents’ literacy as rough measures of “skill” in determining positive or negative selection on education in migration, following the simple Roy model. I then explicitly examine three characteristics of the family I can measure from census data: number of siblings, whether she was the oldest daughter, and farm tenure status.
In general, the Roy model would predict negative selection into rural-to-urban migration if urban areas were paying relatively more to unskilled labor than agricultural areas, which was true for men, especially during the early farm crisis years (Hatton and Williamson Reference Hatton and Williamson1992). When examining specifically South-to-North migration, Collins and Wanamaker (Reference Collins and Wanamaker2014) show that among Black and White men from 1910 to 1930, school attendance and literacy mattered relatively little in migration to the North, and they, like others, highlight other incentives for migration, such as increased political freedoms (p. 962). For women, the presence of any wage opportunities, especially those that reward education, may instead incentivize positive selection. It is under these two conditions: (1) urban wage opportunities that offer both independent wage-earning opportunities and better pay for women, and (2) the social (such as better marriage market opportunities) and political ramifications of inter-regional migration out of the South that I examine positive or negative selection.
In Figure 5, Black female migrants both within and out of the South were more likely to be literate. Black female migrants out of the South were slightly more likely to have been in school and to have a literate parent than non-migrants, especially during the 1920s. For Black female migrants who stayed within the South, having a literate parent or being in school is much less important. Among White women in Figure 5, selection based on school attendance and parents’ literacy was similar across both destinations. White female migrants who were literate, had a literate parent, or who were in school were more likely to migrate than those who were not, with the difference in migration likelihood based on those characteristics peaking during the 1920s. Additionally, coefficients on these characteristics for within-South migrants were almost twice as large as those for who migrated out of the South, but mean migration rates were much higher within-South. For example, in the 1920s, White women who were attending school were 2.4 percentage points more likely to migrate off-farm within the South and about 0.5 percentage points more likely to migrate out of the South than those who were not in school, an increase in migration likelihood compared to both the mean in-South and out-of-South migration rates by over 13 percent.
For White women in particular, urban areas offered independent earnings opportunities, better pay (or any pay), and better hours for those with more years of education. Following WWI, there was an expansion of white-collar work in areas such as teaching, social work, and clerical work that opened up “nice” occupations for White women (Amott and Matthaei Reference Amott and Matthaei1996; Goldin Reference Goldin2006). This exodus of educated White women from rural areas was exactly what SWEA hoped to prevent. For Black women, however, the set of available job opportunities off-farm was limited by racism and did not depend as much on time spent in education or training. In 1930, 53.5 percent of all employed Black women worked in private household service (Amott and Matthaei Reference Amott and Matthaei1996, p. 158). For a Black woman leaving a farm in search of other employment, domestic service would likely be the job in which she ended up, so even those who had access to education would not receive the same gains in wages as White women. Job prospects for Black women outside of farm work were further limited by the Great Depression. While White women actually experienced job gains during the 1930s, Black women’s employment was more sensitive to the downturn of the Depression, and they were some of the first to be laid off (Blackwelder Reference Blackwelder1997). These realities are reflected in selection patterns previously outlined: Black women’s education was often not rewarded in urban work in the way White women’s was; however, those with more educational opportunities were also best equipped to overcome the many barriers to Black migration by facilitating their long-distance migration off-farm and out of the South through greater monetary resources.Footnote 18
I next look at family characteristics, starting with farm ownership. Black migrants out of the South were more likely to come from family-owned farms, while Black migrants within the South were more likely to come from tenant farms. As stated before, longer moves out of the South often necessitated greater resources, both monetary and in terms of knowledge about these destinations, that would be easier to acquire for those better-off households in the South. Often, networks can facilitate migration when the costs are high. In this case, the strong association between migrant networks and out-of-South migration, but less so in-South, emphasizes the importance of family resources or education in these more complicated moves in the absence of networks. It also highlights that Black families who were better off may not have found much gain from sending their daughters to the city within the South, but greater gains from sending them out of the South. For White women, those on family-owned farms were less likely to leave than those on tenant farms.
Across most decades and especially for within-South migration, Black and White daughters from families with a greater number of children were less likely to leave: each additional sibling was associated with a 0.1 to 0.8 percentage point decrease in migration likelihood. White oldest daughters were less likely to migrate than their younger sisters, especially within-South. On the other hand, Black oldest daughters were neither more nor less likely to migrate out of the South than their sisters until the 1930s, when oldest daughters were slightly more likely to migrate.
Family care needs may have created large barriers to young women’s ability to leave the farm. In addition to a strain on the resources available for families with many children to help send their daughters away, daughters were often expected to take on childcare responsibilities, especially on the farm. This reality is reflected in my results on large families being less likely to send daughters away. At the same time, oldest daughters may have been expected to leave the farm in order to work and send money home. Testimonies from women who migrated and those who stayed help further describe these sometimes-conflicting aspects of daughters’ migration. For example, in an interview with Clark-Lewis (Reference Clark-Lewis1994), Pernella Ross, a young Black girl who lived on her family’s farm during the early 1900s, describes the expectations placed upon her and most girls on the farm:
They’d start you watching the young ones and getting water from the spring. That’s on the day you stood up! By four, you’d be doing some feeding and a little field work, and you’d always be minding somebody… By eight, you’d be able to mind children, do cooking, and wash… From the time a girl can stand, she’s being made to work. (p. 42)
In another example, Frances Herron, a White girl from a farm who attended one of SWEA’s Southern Summer Schools for Women Workers, wrote in her autobiography: “Then my father left and we did not know where he went. So I stopped school and kept house so my mother and sister could work” (Herron Reference Herron1931). If allowed to leave the farm, often these girls would forgo college for more targeted training programs that were guaranteed to bring in money and were less expensive, such as nursing. The biographical sketch of Julia Johnson in “Fifty Rural High School Girls,” an unpublished study from SWEA, describes this scenario.
The main family effort is concentrated on giving the oldest child, Julia, a high school education, so that she may assume financial responsibility for the family… she entered a training school for nursing and is now pursuing her course there…The natural result will be to take her out of the country, since nurses rarely return there…. (Southern Women’s Educational Alliance 1930)
This was a particular concern of SWEA, as they worried that these young women would not return to rural areas after gaining an education in the city.
In summary, selection patterns by both race and destination type help explain how the farm, in particular, conditioned migration. First, White migrants’ greater monetary resources and greater ease in traveling long distances safely, both within and out of the South, led to similar patterns of selection across these two destinations. Black migrants, on the other hand, face a starkly different set of risks and rewards when choosing between within-South and out-of-South migration and thus display different patterns of selection between the two regions. Second, racial discrimination in urban wage work led to less distinction between Black migrants and non-migrants in terms of education, especially among those who stayed in the South, compared to White migrants. Third, the reliance on daughters, especially for care work on farms, in addition to the strained resources in large families, led to those with more siblings being less likely to leave, while I also find mixed results when looking at oldest daughters.
CONCLUSION
In this paper, I use a new dataset of women linked across census years, in addition to qualitative sources, to provide evidence of how economic and social constraints based on gender and race can alter migration selection and sorting during economic crises. The farm crisis of the 1920s and 1930s, along with the first wave of the Great Migration and the Depression, highlight how women’s limited opportunities for agricultural economic activity outside of the family, and racial segregation in both farm and urban opportunities and economic mobility, created significant differences in propensities for migration that shifted over time. Women were more likely to migrate than men by the 1920s, suggesting that women were experiencing the transitions taking place on the farm differently than men and were both propelled off-farm and limited by the gendered dynamics of farm work and life. Women were also more likely to migrate in response to men’s falling tenure mobility rates than the men themselves and relied heavily on networks for out-of-South migration. Systemic and structural inequalities in land ownership, opportunities for work, and availability of migratory resources led to patterns of Black female migration that differed from those of White female migration. I find that Black women were positively selected on literacy, school attendance, parent literacy, and farm ownership for moves out of the South, but less so for moves within the South—especially compared to White women.
Future work will aim to address the specific causal effects of farm crisis exposure on migration, as well as how employment opportunities and social support structures awaiting men and women in urban areas altered outcomes during the Depression years. Further analysis of farm communities that lost more women than men, or lost the most well-off or educated women, or of cities that experienced large in-migrations of single and/or married women, can also help illuminate the direct role of women’s migration with respect to important topics in the literature on migration (both international and internal). These include migrant socioeconomic assimilation, the development of migrant or welfare policy, and changes to women’s labor force participation rates and expectations about family formation. In sum, by examining the characteristics of gendered farm-to-city migration, this paper provides the basis for many other avenues of understanding about women’s economic lives that changed drastically during the early twentieth century and helps outline additional questions about how these changes affected the economic and family lives of both the places they left and the places to which they moved.