


I. INTRODUCTION
Owing to superior speed performance, heterojunction-bipolar transistors (HBT) have found wide applications in high-speed switching and digital electronic systems. The demand for wideband circuits is driven by many newly introduced or future military and commercial applications, such as short-range high data rate communication systems, radar detection, digital satellite payloads and software-defined radios. Advances in modern processes such as SiGe heterojunction transistors have shown the possible practical realization of low-cost communication systems-on-chip (SOC). Owing to its high-speed advantage and great design flexibility, SiGe HBT has emerged as a technology of choice for radiofrequency (RF) and mixed digital/analog circuits [Reference Cressler1]. Integrated circuit designers are often faced with model complexity versus simulation efficiency. It is highly desirable to have two kinds of models, a simplified version for fast simulations and circuit design tasks and a detailed version for process technology evaluation and device structure optimization. The contribution proposed in this paper concerns a compact non-linear electro-thermal model for circuit design purpose.
Most of the reported HBT models such as VBIC, MEXTRAM, and HICUM are very complex and have a great number of parameters [Reference De Graaff2–Reference Bo, Shoulin, Jiali, Qiuyan and Jianjun5]. In this paper, we propose a compact model that does not target a description of numerous physical phenomena that take place in the device. The aim of the proposed model is to provide a sufficiently accurate prediction of the main electro-thermal aspects to enable fast and efficient simulations for circuit design purpose. A hybrid model already reported in [Reference Xiong6, Reference Jardel7] has been enhanced as shown in the following and is applied here to the non-linear electro-thermal modeling of SiGe HBT's from Infineon Technologies. The technology is called B7HF200 and uses relaxed 0.35 µm lithography. The process provides high-speed HBTs (fT = 200 GHz; F max = 250 GHz) [Reference Decoutere8]. In Section II, the model topology is given; in Section III, the model extraction procedure is described; and Section IV is dedicated to model validation over a broadband.
II. NON-LINEAR MODEL TOPOLOGY
The electro-thermal HBT model used in this work is based on a hybrid π topology as illustrated in Fig. 1.
Model topology.

The intrinsic part of the equivalent circuit is described by four diodes and one controlled current source:
• Dbe and Dbc control the current source.
• Dfbe and Dfbc take into account leakage currents.
This model uses a physical description for base collector and base emitter charges.
Equations of such a model have been already reported and applied to GaAs HBT modeling in [Reference Xiong6, Reference Jardel7]. They are recalled hereafter for convenience.
The model parameters that are given below correspond to a 3 × 2.8 × 0.35 µm2 SiGe HBT
1) Model equations for diodes:
 $$I_{be}=I_{se} e^{ - Te/T} \lpar e^{qVbe/NekT} - 1\rpar $$
 $$I_{bc}=I_{sc} e^{ - Tc/T} \lpar e^{qVbc/NckT} - 1\rpar $$
 $$I_{fbe}=I_{sfe} e^{ - Tfe/T} \lpar e^{qVbe/NfekT} - 1\rpar $$
 $$I_{fbc}=I_{sfc} e^{ - Tfc/T} \lpar e^{qVbc/NfckT} - 1\rpar $$
T is the junction temperature, k is the Boltzmann constant, and q is the electron charge.
Model parameters for diodes

2) Model equations for current source I ct
 $$I_{ct}=\alpha _f I_{be} - \alpha _r I_{bc} $$
 $$\alpha _f=\displaystyle{{\beta 0} \over {\beta 0+1}}\; \; {\rm and }\; \alpha r=\displaystyle{{\beta r} \over {\beta r+1}}$$
Model parameters for current source, access resistances, and thermal circuit

3) Model equations for charges:
3a) Base-emitter charge q be
 $$q_{be}=q_{bej}+q_{bed}+q_{bek} $$
q bej stands for depletion, q bed for diffusion, and q bek for Kirk effect.
 $$\eqalign{q_{bej}&=\displaystyle{{ - C_{je0} \varphi _{BE} \left({1 - \lpar V_{lim - be} /\varphi _{BE} \rpar } \right)^{1 - Mje} } \over {1 - Mje}}\cr& \quad+\displaystyle{{C_{je0} } \over {\lpar 1 - lim\rpar ^{Mje} }}\lpar Vbe - V_{lim - be} \rpar +K_{be} }$$
 $$\eqalign{{\rm With}\quad V_{lim - be}&=Vbe - \phi _{BE} \lpar 1 - lim\rpar \cr&\quad Ln\lpar 1+e^{\lpar Vbe - lim \cdot \phi _{BE} /\phi _{BE} \lpar 1 - lim\rpar \rpar } \rpar }$$
K be is a constant that is used to force the charge to 0 when Vbe = 0 V. V lim−be expression is used to limit the value of the base emitter voltage Vbe when it approaches ΦBE. This technique has been reported in [Reference Paasschens, Toorn and Kloosterman9].
Model parameters for q bej

 $$q_{bed}=\tau _{f0} \lpar 1 - V_{bci} V_{bc} \rpar \lpar 1 - I_{ci} Ic\rpar \lpar 1 - F_{cd} \rpar F\lpar Ic\rpar $$
Ic is the collector current and F(Ic) is a function defined as following:
 $$F\lpar Ic\rpar =Ic+A_{\tau f} G\left({\displaystyle{{ - Ic} \over {A_{\tau f} }}} \right)\; \quad {\rm if}\quad Ic\gt 0$$
 $$F\lpar Ic\rpar =A_{\tau f} G\left({\displaystyle{{Ic} \over {A_{\tau f} }}} \right)\; \quad {\rm if}\quad Ic\lt 0$$
Where function 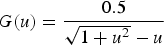 $G\lpar u\rpar =\displaystyle{{0.5} \over {\sqrt {1+u^2 } - u}}$ if
 $u\gt - 1$
 $$G\lpar u\rpar =\displaystyle{{ - 0.5} \over {u\lpar 1+\sqrt {1+\lpar 1/u^2 \rpar } \rpar }}\; \; {\rm if}\quad u\lt - 1$$
Model parameters for q bed

 $$q_{bek}=\tau _{k0} Ic\lpar 1 - F_{ck} \rpar H^2 \lpar Ic\rpar $$
Function H(Ic) is defined as the following and has also been used in [Reference Schroeter10].
 $$H\lpar Ic\rpar =\displaystyle{{\lpar 1 - \lpar I_k /Ic+10^{ - 6} \rpar +\sqrt {\lpar 1 - \lpar I_k /Ic+10^{ - 6} \rpar \rpar ^2+A_{\tau k} } } \over {1+\sqrt {1+A_{\tau k} } }}$$
where  $I_k=I_{k0} \lpar 1 - Vbc_{{invk}} Vbc\rpar $
Model parameters for q bek

3b) Base-collector charge q bc
 $$q_{bc}=q_{bcj}+q_{bcd}+q_{bc - trans} $$
 $$\eqalign{q_{bcj}&=\displaystyle{{ - C_{jc0} \phi _{BC} \left({1 - \lpar V_{lim - bc} /\phi _{BC} \rpar } \right)^{1 - Mjc} } \over {1 - M_{jc} }}\cr&\quad+\displaystyle{{C_{jc0} } \over {\lpar 1 - lim\rpar ^{Mjc} }}\lpar Vbc - V_{lim - bc} \rpar +Cbcp.Vbc}$$
 $$\eqalign{{\rm With}\quad V_{\lim - bc}&=Vbc - \phi _{BC} \lpar 1 - \lim \rpar \cr&\quad Ln\lpar 1+e^{\left({Vbc - \lim \phi _{BC} /\phi _{BC} \lpar 1 - lim\rpar } \right)} \rpar }$$
Model parameters for q bej

 $$q_{bcd}=\tau _r Ic$$
 $$q_{bc - trans}=F_{cd} q_{bed}+\displaystyle{{F_{ck} } \over {1 - F_{ck} }}q_{bek} $$
F cd: is a constant used to divide the charges in the base into two parts. The first one takes into account the diffusion charges which depend on Vbe, the second one q bc−trans takes into account non-quasi-static effects in charge distribution and is called trans-capacitance.
F ck: is a constant used to divide the Kirk charges into a base emitter capacitance and a base collector capacitance.
q bek: represents the part of qbc charges that appear at high-current densities due to the Kirk effect.
Cbc_p: represents the package capacitance
Model parameters for q bed and q bek

The new aspects in the model that are highlighted below are:
• Current gain formulation that fit current gain decrease versus collector current.
• Breakdown formulation.
• Temperature dependence of leakage diodes.
• Formulation of base collector charges for an improved cut-off frequency modeling.
Furthermore, a thermal impedance extraction technique already reported in [Reference El Rafei, Sommet and Quere11, Reference Sahoo, Fregonese, Zimmer and Malbert12] is used and combined with the features mentioned above.
These aspects are successively reported in the following.
III. MODELING ASPECT ENHANCEMENTS APPLIED TO NPN SIGE HBT
A) Current gain formulation
DC I/V characteristics of a 3 × 2.8 × 0.35 µm2 SiGe HBT from Infineon Technologies have been measured using a Keithley 4200 semi-conductor device characterization system. During measurements the transistor is biased with a base current generator configuration [Reference Saleh13]. The measurement results are given in Fig. 2.
DC IV measurements of a 3 × 2.8 × 0.35 µm2 SiGe HBT.

Figure 3 shows the measured gain current characteristic of the transistor versus collector current.
Current gain versus collector current measured at Vce = 1 V.

It is observed that the current gain decreases versus collector current. In order to model this behavior, the following expression is used:
 $$\beta=\beta _0+\beta _1 \,\ast\, \exp \lpar\!\! - {\it Ic/Ic0}\rpar \comma \; $$
where β0, β1 and Ic0 are the fitting parameters.

Figure 4(a) shows a comparison between simulated I/V plots and measurements when the model uses a constant gain ( $\beta=\beta o$). Figure 4(b) shows the same comparison when the model uses a current gain that depends on the collector current.
Simulated IV network with constant current gain (a) and variable current gain versus collector current (b). (Ib_start 1 µA; Ib_step: 40 µA; and Ib_stop: 201 µA).

It can be observed in Fig. 4(b) that the enhanced model provides a better fit of I/V characteristics at low current.
B) Breakdown model
For better convergence purpose, breakdown modeling is performed using equation (19)
 $$\alpha _f=\alpha _0 \lpar 1+{\rm exp\lpar }Vce^2 - C - \lambda .IC\rpar \rpar $$
where C and λ are the fitting parameters. C parameter determines the breakdown voltage for a given collector current and λ takes into account the decrease of break down voltage at high collector currents. A good agreement between measurements and simulated results is illustrated in Fig. 5.

Simulated and measured IV network with breakdown modeling. (Ib_start = 1 µA; Ib_step = 40 µA; and Ib_stop = 201 µA).

C) Base collector charge formulation
The determination of cut-off frequencies and particularly the transition frequency is very important.
The transition frequency Ft is determined by computing the current gain from S-parameter measurements up to 65 GHz and by extrapolating the current gain at higher frequencies, until it reaches 0 dB. Analytical expression of gain current h 21 deduced from S parameters is given in equation (20).
 $$h_{21}=\displaystyle{{2S_{12} } \over {\lpar 1 - S_{11} \rpar \lpar 1+S_{22} \rpar +S_{12} S_{21} }}$$
In order to obtain correct behavior of the non-linear model at high-current densities and high collector emitter voltages, the base collector charges have been modeled by the following expressions:
 $$\eqalign{qbc& =qbcj+qbc\_kirk+qbc\_Vcb \cr qbc\_kirk& =\tau _{k0} \lpar 1+tanh\lpar 1 \times 10^{ - 3} \lpar Ic - I_{ck} \rpar \rpar \rpar \lpar Ic^2 \rpar } $$
 $$qbc\_Vcb=- Cbc\exp \!\lpar Vcb - V_{cb0} \rpar $$

The equations (21) and (22) replace equations (14), (16) and (17). The increase of base collector capacitance with respect to collector current enables the modeling of transition frequency saturation at high collector current (Kirk effect) as shown in Fig. 6.
Transition frequency versus collector current.

The increase of base collector capacitance with respect to collector-base voltage also enables a good fit of transition frequency saturation at high collector base voltages as shown in Fig. 7.
Transition frequency versus collector emitter voltage.

D) Leakage diode temperature dependence
In order to characterize thermal dependence, Ic versus Vce DC measurements are performed at different chuck temperatures as shown in Fig. 8
Simulated and measured Ic versus Vce for different chuck temperature.

It can be observed in Fig. 8 that the collector current decreases when the chuck temperature increases. However, for any fixed temperature and base current conditions, collector current does not decrease when collector voltage increases. Consequently, we have included in the model a temperature dependence of the current flowing in the base emitter leakage diode. The leakage current increases when the temperature increases. Leakage current variations versus temperature are modeled by equation (23):
 $$\eqalign{I_{sfe}&=I_{sfe0} exp^{kT/qN_{FE} vt}\cr&\quad\times exp^{ - kT_{FE} /qN_{FE} vt} \lpar exp^{Vbe/qN_{FE} vt} - 1\rpar }$$
where I sfe0, T FE, and N FE are the fitting parameters.

E) Thermal sub circuit determination
The thermal impedance profile versus frequency has been extracted using low-frequency S parameters method previously reported in [Reference Paasschens, Toorn and Kloosterman9]. The thermal impedance is extracted from the h 12 parameter using the following relation:
 $$Z_{th} \lpar \omega \rpar =\displaystyle{{h_{12} \lpar \omega \rpar } \over {\phi ^{\ast} I_{C0} }}\; \; {\rm where }\quad \phi=\displaystyle{{\partial Vbe} \over {\partial T}}$$
Following equation (24), it is clear that, for a given collector current I C0, the only parameter to be determined is the base-emitter thermal coefficient ϕ. This coefficient is a technological parameter of the transistor that slightly depends on the collector current. It is taken here to be a value of −0.9 mV/°C.
Figures 9(a) and 9(b) show the real and imaginary parts of the thermal impedance measured in the (100 Hz–5 MHz) frequency range [Reference El Rafei14].
(a) Imaginary part of thermal impedance. (b) Real part of thermal impedance.

For a good description of thermal behavior, the thermal impedance symbolically represented in Fig. 1 by a single parallel RC network is substituted by a multi cell RC network as represented in Fig.10 [Reference Sahoo, Fregonese, Zimmer and Malbert12].
Enhanced thermal sub circuit description.

For a good agreement between measurements and simulations eight cells are considered. Model parameters are respectively:

k is a fitting parameter used to obtain a transient part of the thermal response close to a  $\sqrt T $ shape (T is the temperature).
IV. MODEL SCALING
As the collector current flows through the emitter contact, IC0 is proportional to the emitter area A E. Thus, the proposed model can be scaled with respect to the emitter area. In this section, the scaling laws adopted for this model are given.
Table 1 gives a summary of the scaled parameters and their scaling rules. The model parameters are scaled with respect to the emitter area A E.
Scaling rules of model parameters X_u denotes the value of the parameter X for A E = 2.94 µm2 (emitter area for the smallest transistor 3 × 2.8 × 0.35 µm2).

Fig. 11 shows the simulated versus measured IV network for a 1 × 10 × 3.5 µm2.
Simulated and measured IV network (Ib_start = 1 µA; Ib_step = 50 µA; and Ib_stop = 301 µA).

V. MODEL VALIDATION
A) S parameters measurements
S parameters of the transistor are measured from 100 Hz to 65 GHz. The validation of the model over this frequency bandwidth is important for its use for the design of broadband analog digital converters.
Figure 12 shows a comparison between measured and simulated S parameters of a 3 × 2.8 × 0.35 µm2 SiGe HBT.
(a) Measured versus simulated S11. (b) Measured versus simulated S21.(c) Measured versus simulated S12. (d) Measured versus simulated S22.

A good agreement between measured and simulated S parameters on the whole frequency bandwidth is obtained. It can be observed as two different regions in S-parameter loci. At low frequency, below 200 MHz, both thermal and electrical aspects are present and taken into account in transistor responses. For frequencies above 200 MHz, only electrical aspects impact transistor behavior.
B) Large signal measurements
Large signal measurements have consisted here in measuring the power gain of the transistor for different bias points and RF input power levels. CW measurements given below are performed at 2 GHz. The transistor under test is terminated into a 50 Ω load.
The power is swept from −40 to −12 dBm. Time domain current and voltage waveforms are obtained, thanks to the use of a vector network analyzer having time domain capabilities. We used for that purpose a large signal network analyzer (LSNA) with a calibrated phase reference generator [Reference Reveyrand, Mallet, Nebus and Vanden Bossche15].
Figures 13–15 show a comparison between simulated and measured power gain, voltage and current waveforms, and collector DC current.
Measured and simulated gain versus input power.

Simulated and measured waveforms (Vbe = 0.8 V, Vce = 1.2 V, and input power = −20 dBm). (a) Collector emitter voltage. (b) Collector current. (c) Base emitter voltage. (d) Base current.

Simulated and measured DC collector current.

Same measurements are performed at 5 GHz.
Figures 16–18 show a comparison between simulated and measured power gain, voltage and current waveforms, and collector DC current.
Measured and simulated gain versus input power.

Simulated and measured waveforms (Vbe = 0.8 V, Vce = 1.2 V, and input power = −20 dBm). (a) Collector emitter voltage. (b) Collector current. (c) Base emitter voltage. (d) Base current.

Simulated and measured DC collector current.

VI. CONCLUSION
In this paper, an accurate HBT Electro-Thermal compact model has been proposed. It has been shown that very small thermal time constants are involved in SiGe HBTs. Moreover, the non-linear model can easily be implemented in CAD software for the simulation of circuits such as power amplifiers or ADCs.
ACKNOWLEDGEMENTS
The authors acknowledge K. Aufinger from Infineon Technologies for providing the transistors. The research leading to these results has received funding from the European Community's Seventh Framework Program (FP7/2007–2013) under grant agreement no. 242521.
 Alaa Saleh was born in Saida, Lebanon on August 1983. He received his Ph.D. from the XLIM laboratory in LImoges in 2009. His research interests include high-frequency transistor modeling for high-speed digital circuits applications as well as for microwave samplers.
 Abdelkader El Rafei was born in Akkar, Lebanon on May 29, 1985. He received a Ph.D. from the University of Limoges-XLIM laboratory in 2011. His research interests include high-frequency transistors, characterization, and conception of the dispersion effects including thermal and traps with low-frequency S-parameters measurement.
 Mountakha Dieng was born in Kebemer, Senegal on June 10, 1982. He received a Ph.D. from the XLIM laboratory in Limoges. His research interests include evaluation of thermo-mechanical stress in plastic packaging for space environment.
 Tibault Reveyrand (M’07) received a Ph.D. degree from the University of Limoges, France, in 2002. From 2002 to 2004, he was a Post-Doctoral Scientist with CNES (French Space Agency). In 2005, he worked as a CNRS engineer at XLIM (formerly IRCOM). His research interests include the characterization and modeling of radiofrequency (RF) and microwave non-linear components and devices. Dr Reveyrand was the recipient of the 2002 European GaAs best paper award.
 Raphael Sommet received the French aggregation degree in applied physics and the Ph.D. degree from the University of Limoges, Limoges, France, in 1991 and 1996, respectively. Since 1997, he has been a permanent researcher at XLIM-CNRS at the University de Limoges. His research interests concern heterojunction-bipolar transistor (HBT) device simulation, 3D thermal finite-element simulation, model order reduction, microwave circuit simulation, and generally the coupling of all physics-based simulation with circuit simulation.
 Jean Michel Nébus received a Ph.D. degree in electronics from the University of Limoges, France, in 1988. He has then worked for 2 years as a Project Engineer with Alcatel Space Industries, Toulouse, France. He is currently a Professor with the XLIM Laboratory, University of Limoges. His main research interests are non-linear microwave device characterization and power amplifier design.
 Raymond Quere was born in 1954 in St Brieuc (France). He received an electrical engineering degree from ENSEEIHT Toulouse, France, in 1976 and the French aggregation in applied physics in 1978. After a teaching period of 8 years for undergraduate students, he prepared and earned a Ph.D. degree (with honors) from the University of Limoges in 1989. In 1992, he was appointed as a full time professor at the University of Limoges. From 1992 to 1997 he headed the Department of Electrical Engineering at the Institute of Technology of the University of Limoges. Since 1998, he has led the non-linear high-frequency devices, circuits and systems research department at XLIM-CNRS laboratory. He advises more than 30 Ph.D. students and he authors or co-authors more than 100 journal articles or communications in international conferences.



