


1. Introduction
Snowdrift is an important mass-balance component, as vast amounts of snow can be transported horizontally when surface winds are sufficiently strong (e.g. Reference RadokRadok, 1970). Also sublimation of snowdrifting particles can significantly affect the net mass loss of the surface (e.g. Reference SchmidtSchmidt, 1982; Reference BintanjaBintanja, 1998). In particular, in orographically complex regions divergences and convergences of snowdrift transport can lead to extensive erosion or deposition of snow. A notable example is the widespread existence of blue-ice areas (BIAs) in mountainous regions on the Antarctic continent. These are hypothesized to be formed in regions where orography has apparently induced snowdrift divergence (Reference Takahashi, Endoh, Azuma and MeshidaTakahashi and others, 1992; Reference Van den Broeke and BintanjaVan den Broeke and Bintanja, 1995), since BIAs seem to occur mainly (but not exclusively) in the lee of mountains. After their initial formation, positive feedbacks associated with their low albedo may help to further expand the BIA (Reference Bintanja and van den BroekeBintanja and Van den Broeke, 1995; Reference BintanjaBintanja, 1999). Also the smoothness of the bare ice may play a role in affecting snowdrift transports over BIAs.
This paper presents the first actual measurements of snowdrift over an Antarctic BIA. There are two main reasons for measuring snowdrift over blue ice: (1) we would like to infer how horizontal snowdrift transport is influenced by the presence of a BIA and by the meteorological conditions that typically occur over BIAs, in order to better understand the formation and maintenance mechanisms of BIAs as mentioned above, and (2) we would like to know more about the fundamental differences in snowdrift transports over ice and snow surfaces. For instance, the absence of a continuous source of erodible particles at the surface of BIAs may, through comparison of snowdrift transport rates over ice and snow surfaces, yield insight into the importance of erosion mechanisms in “normal” (i.e. over-snow) snowdrifting conditions. Also, Reference TablerTabler (1980) compares the influence of snowdrift on the wind-speed profile between snow and ice surfaces.
2. Location, Instrumentation and Data Acquisition
The snowdrift observations were part of an extensive and detailed meteorological and glaciological experiment carried out on and near a BIA close to the Swedish station Svea (74°11’S, 10°13’W; 1250ma.s.L), Dronning Maud Land, Antarctica, during austral summer 1997/98. Svea is located on the western side of the Scharffenbergbotnen valley, a U-shaped valley in the central Heimefrontfjella which harbours the largest BIA in the region (3 km × 6 km). Figure 1 shows some topographic detail of the region. The measurements performed at sites 1 (blue ice) and 3 (snow) formed the core of the meteorological experiment. There, meteorological stations continuously measured vertical profiles of wind speed, temperature and humidity at five levels (0.5–9 m), wind direction, radiative fluxes and subsurface temperatures during the period 29 December 1997 to 7 February 1998 at a sampling rate of 2 min. Additionally, direct turbulence measurements using sonic anemometers were performed at these sites, but these sensors may have yielded inaccurate readings during snowdrift events because drifting particles interfered with the acoustic pulses. Therefore, only data from the meteorological stations were used in this study. Reference Bintanja, Reijmer, Snellen and ThomassenBintanja and others (1998) give a detailed account of all the measurements that were carried out. At sites 1 and 3, mean wind speeds during the experiment were 4.2 and 4.3 ms–1, respectively, while mean temperatures were –7.6° and –10.2°C. Site 3 over snow has an undisturbed fetch of several tens of kilometers. Site 1, however, does not have an undisturbed fetch at all: about 500 m to the southeast (upwind) there is a steep rock wall about 400 m high from which prevailing winds descend from the elevated upwind plateau. Such a complicated upwind fetch is typical for most BIAs.
Location of measuring sites 1 and 3 and the research station Svea in the Scharffenbergbolnen region of the central Heimefrontfjella. Svea is located about 300 km from the coast. Prevailing winds are from the east.

We had four snowdrift sensors at our disposal, which were placed in a vertical array at nominal heights of 10, 20, 40 and 80 cm above the surface to be able to measure as accurately as possible the vertical profile of snowdrift density. We number these sensors 1 (lowest) to 4 (highest) throughout the paper. Figure 2 shows the experimental set-up at site 1 over blue ice. Each sensor is equipped with a wind-vane to keep the sensor head fully exposed to the wind at all times (this was confirmed visually at each visit; the four sensors always mutually aligned, even in light winds). The sensor head (4 mm in diameter) is sensitive to drifting particles impacting on its surface. Essentially, the sensor records the momentum of each impacting particle using the pulse-counting technique as described in detail by Reference TugTug (1988). Data were transferred to a datalogger, which was programmed to store 6 min totals of integrated particle momentum (M) and the number of impacts (N). Snowdrift and weather-station data were averaged to obtain 30 min average data. Figure 3 shows an example of the output of the four sensors for a snowdrift period on 30 and 31 January 1998. Clearly, all four sensors behave synchronously, with the lowest sensor recording the highest transport rate and the largest number of events, as would be expected in normal snowdrift. Alternative methods to measure snowdrift are snow gauges or traps (e.g. Reference Budd, Dingle, Radok and RubinBudd and others 1966; Reference TakahashiTakahashi, 1985) and photoelectrical cells detecting shadows of passing particles (e.g. Reference SchmidtSchmidt, 1982).
Photo of the instrumentation at site 1 over blue ice. In the foreground are the four snowdrift sensors which are attached to a vertical stake drilled firmly into the ice. In the background to the left are the sonic anemometer and the 9 m meteorological profile station. Prevailing winds are from left to right in this picture (this contrasts with the orientation of the sensors in this picture).

Example of a time series of half-hourly observations of the number of impact events (a) and the integrated transport rate (b) for sensors 1 (lowest) to 4 (highest) at site 3 Note that decimal time is used, i.e. 30.5 equals 30 January, 1200 UTC.

The average particle impact momentum (A) is determined by the ratio M/N. For each sensor the output value of A was calibrated beforehand in the laboratory by dropping a fixed number of sand grains with known weight from a certain height (which specifies the impact velocity) onto the sensor head. In this way, the sensor output was calibrated against a known value of mean particle momentum of sand grains to yield the calibrated A After calibration is applied, the total mass flux F (in kg m–1 s–1) of snowdrifting particles at each height is determined as F = AN/(STu), where S is the surface area of the sensor, T is the period of sampling (360 s) and u is the horizontal wind speed at the height of the sensor. The drift density η (in kg m–3) is then readily evaluated using η = F/u. The wind-speed profile is determined by fitting the observed wind-speed profile with the well-known log-linear surface layer profile (e.g. Reference GarrattGarratt, 1992, p. 53), which allows for stability effects, and this fit is used to calculate the wind speed at the height of the sensors. Incidentally, the height of the sensors (meteorological and snowdrift) was accurately measured at each visit to the various sites (every 2–3 days), since accurate information about the height of the sensors is essential in the interpretation of the data. There are various uncertainties contributing to the total measurement error (e.g. non-elastic collisions with the sensor head, distortion of flow around sensor, oblique impacting), which is estimated at 10% (Reference Bintanja, Reijmer, Snellen and ThomassenBintanja and others, 1998).
The snowdrift instrumentation was first installed at site 1 over blue ice, where it was operational during the period 28 December 1997 to 25 January 1998. Thereafter, the equipment was transferred to site 3 over snow, where it worked from 25 January to 6 February 1998. The snowdrift equipment worked continuously and automatically, with energy provided by batteries and solar cells. Data were downloaded every 2–3 days. Unfortunately, very few data were obtained during the first 2 weeks (until 10 January) because of problems with the batteries. After that, however, the snowdrift system suffered only minor interruptions. In total, the system operated successfully for 516 hours, of which 276 were over blue ice and 240 over snow.
3. Measuring Errors
Some examples of typical vertical profiles of snowdrift density over blue ice and snow are shown in Figure 4. Several interesting features can be deduced from this figure. First, it is clear that there is no monotonic decrease in drift density as would be expected from the theory. In particular, drift densities at the third level are virtually always lower than those measured at the uppermost level, which is physically impossible. This means that either the third sensor reads low or the top sensor reads high. To determine which of these is the case, we fit measured profiles with theoretically derived ones. The balance between upward turbulent diffusion of particles and the downward pull by gravitation leads to the well-known power-law distribution (e.g. Reference Shiotani, Arai and ŌuraShiotani and Arai, 1967):

where z is height, V is mean terminal fall velocity of the ensemble of particles, K IS the von Karman constant, u∗t is the friction velocity (determined from the wind profile using log-linear fitting as mentioned earlier), and ηo is the drift density at the lower boundary of the suspension layer z0, usually the saltation-suspension interface. To derive Equation (1), it was assumed that V and u∗ are independent of height. Fitting measured profiles of drift density such as those shown in Figure 4 with the theoretical profile (1) mostly gives reasonable fits, which, however, clearly indicate that the measured drift densities at the third level (z ∼ 0.44 m) are significantly too low. Using another method to fit the data, in which V is assumed to depend on height (Bintanja, 2000), leads to the same conclusion. Hence, we will disregard the measurements obtained at the third level.
Typical examples of observed half hourly mean vertical profiles of drift density over blue ice (a) and over snow (b). The thick line represents the power-law fit to the measured profile indicated by the dashed line.

Another suspect phenomenon in Figure 4 is the relatively weak upward decrease in drift density from the lowest to the second level. According to theory, the vertical gradient in drift density should always increase downward (in steady state), which also follows directly from Equation (1). This is often not the case in our measured profiles, especially over blue ice. Figure 5 illustrates this by showing the ratio of drift densities measured at the various levels as a function of friction velocity. Essentially, there are two clearly distinct “clouds” of data points, one representing data obtained over snow and the other over blue ice. According to theory, these ratios should always be greater than unity. Evidently, this is often not the case over blue ice when data from the lowest level are applied. Using data from the second and fourth levels (Fig. 5c), however, the ratio is practically always >1 Any of the ratios presented in Figure 5 is always much larger than unity for the observations made over snow, which leads to the following conclusions: (1) the vertical gradient in snowdrift density is generally much smaller over blue ice than over snow (see also Fig. 4), which implies that profiles over blue ice are more susceptible than those over snow to give erroneous reversals in the vertical gradients; (2) the readings of the lowest sensor over blue ice may have been affected by the presence of surface ripples, yielding deviations from the steady-state profile such as Equation (1) in which it is inherently assumed that a flat surface exists. Hence, we decided to disregard the data obtained at the lowest level, leaving only the second and fourth levels available for analyses and for estimating vertical gradients in drift-density profiles. Clearly, this is far from ideal, but under the circumstances it is better than having no estimate of the vertical profiles at all. Incidentally, the data shown in Figure 5 indicate that over snow the vertical gradient in drift density decreases in stronger winds. Apparently stronger winds induce increases in upward turbulent diffusion of particles that are larger than the increase in low-level drift density which are governed by the drift density in the saltation layer. This agrees well with existing theory and with observations of drift-density profiles shown by Reference Mann, Anderson and MobbsMann and others (2000). Over blue ice, matters are much less clear. Reasons for this will be discussed in the next section.
Ratios of measured drift density against friction velocity at (a) first and second levels, (b) first and fourth levels, (c) second and fourth levels. The data points having a value equal to unity represent data for which at least one of the measured drift densities was equal to zero. The uppermost cluster of data points (crosses) represents values over snow at site 3, while the remainder of the data (open circles) represent values over blue ice.

4. Results
Having established which of the snowdrift sensors are most likely to provide reliable data, we will now try to draw some useful interpretations from the remaining data. A time series of snowdrift density over the entire measurement period is shown in Figure 6. Snowdrift seems to occur regularly at these locations in summer, both over blue ice and over snow. Generally, snowdrift density measured over blue ice seems to be significantly lower than over snow (at the same height and wind speed). This is an important observation, which is probably related to the fact that there is often no surface snow available for the flow to erode and entrain upwards (only occasional precipitation events deposit snow onto the blue-ice surface). Hence, while the flow over blue ice is capable of lifting a certain amount of snowdrift into the air, quite often there apparently is no snow available to be lifted and snow-drifting remains undersaturated. Interesting in this respect is the general observation that, in the early stages of snowdrift events over snow, saltation drift density is significantly enhanced by saltating particles bouncing at the surface over and over again, thereby ejecting numerous other particles. This effect obviously is of limited importance over blue ice when practically all surface snow is already in motion, which means that drift densities will mostly remain low.
Tine series of half-hourly values of wind speed at 2m and drift density at about 0.2 m. Date is in Julian days. On 25 January, the snowdrift equipment was transferred from site 1 to site 3 as indicated by the vertical marker. Drift densities lower than 1 × 10⁻¹⁰ kg m–3 indicate either zero values or no data.

Snowdrifting events over blue ice seem to be only vaguely related to wind speed, with very light winds (< 2 m s–1) occasionally being sufficient to initiate snowdrift. This may be because blue ice is very smooth, which enables wind fluctuations to pick up surface particles more easily. On snow surfaces, cohesive and other forces efficiently bond surface particles to their neighbours; these forces must be overcome through the shear exerted by the flow before the particles can become mobile (Reference SchmidtSchmidt, 1980). Over blue ice, snow particles at the surface are less strongly bonded to each other or to the ice, in particular when loose snow is present on the blue-ice surface. This means that the threshold shear stress (being the stress applied by the flow just sufficient to initiate particle motion) is lower over blue ice than over snow.
We now take a closer look at the vertical gradients in drift density, and focus on the differences between blue ice and snow. Figure 7 depicts a time series of the fall velocity, which is calculated by fitting the observed drift densities at the second and fourth levels using the power-law relation (1) (additionally using the first level over snow yielded no significant difference). This fall velocity is representative for the height range 0.4–0.8 m. Evidently, typical fall velocities over snow (-03–0.6 m s–1) are significantly larger than over blue ice (-0.1–0.2 m s–1). This is a reflection of the fact that over blue ice the gradient in drift density is generally smaller. The values over snow agree reasonably with values found in other studies (e.g. Reference Budd and RubinBudd, 1966; Reference TakahashiTakahashi, 1985; Reference Pomeroy and MalePomeroy and Male, 1992) in the same height range. This indicates that the values of V found over blue ice are indeed unusually low. One possible explanation for this is that light particles apparently dominate the particle ensemble over blue ice. This, however, is not a very plausible explanation as the number of impact events (N) over blue ice appears to be somewhat smaller than over snow, rather than larger which would be expected if light particles were somehow overrepresented. A more likely explanation for the low fall velocities is that the usual balance between gravity and upward diffusion is valid only over snow surfaces where an infinite source of particles is present at the surface to maintain a continuous balance between erosion and deposition. Hence, ηo can be maintained at a constant value in steady-state snowdrift over snow. In contrast, ηo cannot be maintained over blue ice because, in developing snowdrift, at some point all snow will have been eroded. Then the only source of snowdrifting particles over BIAs is the influx from upwind snow-covered regions. This leads to a decrease in drift density at lower levels, and hence a decrease in the vertical gradient in drift density. Moreover, the power-law Equation (1) fails to be applicable to the vertical drift profiles, yielding too low values of V which should instead be attributed mainly to lower values of ηo. Incidentally, fall velocities increase with wind speed (as more heavy particles are picked up in higher winds) over both blue ice and snow (not shown), in accordance with theory and other observations (e.g. Reference Budd and RubinBudd, 1966; Reference Mann, Anderson and MobbsMann and others, 2000).
Time series of half-hourly average fall velocities of the ensemble of particles. Zero values of fall velocity represent data for which at least one of the measured drift densities was equal to zero and the fall velocity was not defined.

Finally, we will use the measured drift densities at the second and fourth levels to evaluate the total snowdrift transport rate Q (in kg m–1 s–1), which we will define as:
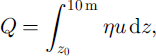
where η(z) follows from fitting Equation (1), and u(z) from the fitted log-linear profiles. The height z0 is taken as z0 = ζu2∗ with ζ = 0.0652 m–1 s2 (Reference Pomeroy and GrayPomeroy and Gray, 1990), and represents the height of the saltation layer that deepens as the flow gets stronger (e.g. Reference OwenOwen, 1964). Tests showed that the choice of z0 is not vital; taking a constant value z0 = 1 cm or a constant drift density to define the lower boundary height altered the results only slightly. Extending the upper limit to 30 m, say, has a negligible effect on total transportrate values, so the bulk of the transport occurred beneath 10 m (for the events studied here). This, obviously, is because the range in wind speeds was rather limited (half-hourly mean winds were never >10 m s–1). The quantity Q essentially represents the transport rate of particles in suspension; an additional fraction moves in the saltation layer. Reference TakeuchiTakeuchi (1980) and Reference Pomeroy and MalePomeroy and Male (1992) demonstrated that suspended transport dominates the total transport at virtually any wind speed over snowfields with sufficiently long fetch, so that Equation (2) may be regarded as representing the total transport rate. However, this may be different over blue ice near site 1 because of the very short fetch.
Figure 8 shows values of Q against friction velocity. Additionally, three empirical curves, derived from snowdrift data over snow surfaces, have been included (quite a number of similar empirical relationships exist; all exhibit roughly the same curvature). At first sight, there appears to be quite a bit of scatter associated with our transport rates, in particular over blue ice; however, significant scatter seems to be inherent in measuring snowdrift quantities given the many uncertainties and potential measurement/interpretation errors. The snow data appear to agree reasonably well with the empirical relations, even though in our data the range in u, is too small to establish their validity with any certainty. However, this agreement does suggest that the measured snowdrift quantities over snow and blue ice are probably fairly realistic. The threshold of snowdrift initiation over snow is about 0.3 m s–1, in accord with similar estimates over Antarctic snow (Reference King, Anderson, Smith and MobbsKing and others, 1996; Reference Mann, Anderson and MobbsMann and others, 2000). Transport rates over blue ice are significantly smaller than over snow (by 2–3 orders of magnitude). Apparently, snowdrift over blue ice remains undersaturated most of the time, that is, there are fewer particles suspended than the flow is able to carry. Evidently, this can be attributed to the fact that over blue ice there is usually limited snow available at the surface. Moreover, snowdrift over blue ice does apparently start (and can be maintained) at very weak winds because of the smoothness of the ice surface as discussed above. In any case, over blue ice no clear trend of Q against u* can be determined from these data.
Values of snowdrift transport rate as defined by Equation (2) vs friction velocity for half-hourly mean data. Empirical fits of Reference Mann, Anderson and MobbsMann and others (2000) (their exponential and power-law fits) and of Reference KobayashiKobayashi (1978) are included for comparison. Mote that these empirical relations have been derived over snow-covered surfaces.

5. Concluding Remarks
This paper presents snowdrift data measured over Antarctic blue-ice and snow surfaces. Measurements were carried out with sensors using the pulse-counting technique (Reference TugTug, 1988). A vertical array of four sensors was used, of which unfortunately only two appeared to provide reliable data. The use of concurrent wind-profile data made it possible to evaluate drift-density data. It was found that snowdrift densities (and snowdrift transport rates) over blue ice were generally much lower than over snow, which can be attributed to the fact that over blue ice significantly less snow is available at the surface. In other words, snowdrift suspension over blue ice is generally undersaturated, indicating that fewer particles are suspended compared to the amount the flow is able to carry. Another important observation is that vertical gradients in snowdrift density are significantly smaller over blue ice than over snow, which is probably also caused by the limited amount of particles at the surface, as the drift density near the surface is also lower than over snow (at the same wind velocity). Over snow, snowdrift starts at friction velocities of about 0.3 m s–1, whereas over blue ice very weak winds are able to initiate snowdrift. The latter can probably be attributed to the smoothness of the blue ice, preventing the occasional snow cover from becoming firmly attached to the ice surface. Future analyses will focus on the details of the snowdrifting events over blue ice in order to identify and perhaps quantify the underlying fundamental mechanisms responsible for the differences in snowdrift quantities between blue ice and snow.
Acknowledgements
We are very grateful to C. Reijmer and H. Snellen for their assistance in performing the measurements in the Antarctic. Financial support was provided by the Netherlands Antarctic Research Programme (ALW) which is part of the Netherlands Organization of Scientific Research (NWO).



