

Introductory remarks
After many decades of debate there remains a wide divergence of opinion about the degree of ranking and hierarchy in the Neolithic of the Middle East. Some discuss arguments in favour of egalitarianism (e.g. Banning & Chazan Reference Banning and Chazan2006). Price and Bar Yosef (Reference Price, Bar-Yosef, Price and Feinman2010) suggest that there was incipient ranking in the Natufian (even though they admit to a lack of clear evidence: 2010, 152), while Mithen et al. (2018, 12) suggest that both in the Natufian and PPNA there is an ‘absence of explicit signs of social ranking’; some authors see aggrandizers in the PPNA (Hayden Reference Hayden2014) and at Körtik Tepe, Benz et al. (Reference Benz, Alt, Erdal, Şahin, Özkaya and Hodder2018) argue for a lack of institutionalized hierarchy; some see the monuments at Göbekli and the tower and wall at Jericho as indicating leadership (Price & Bar Yosef Reference Price, Bar-Yosef, Price and Feinman2010); in contrast to the evolutionary assumption of increased complexity and differentiation through time, Frangipane (Reference Frangipane2007) describes different forms of egalitarian societies stretching through into Halaf, Samarra and Ubaid. Perhaps Kuijt (Reference Kuijt and Kuijt2002, 158–9) describes the situation best when he suggests that MPPNB societies put an emphasis on egalitarianism while at the same time permitting some social differentiation. He describes ‘competing and cooperating Houses and households, founded on an egalitarian ideology’.
Wengrow and Graeber (Reference Wengrow and Graeber2015) have argued that ‘Palaeolithic politics’ involved a variety of alternating and contrasting hierarchical and egalitarian options, consciously and deliberately chosen at different moments (see also Graeber & Wengrow Reference Graeber and Wengrow2021). Rather than the Neolithic being seen as a prelude to the emergence of ranked societies (Powers & Lehmann Reference Powers and Lehmann2014; Price & Bar Yosef Reference Price, Bar-Yosef, Price and Feinman2010), with research heavily influenced by Melanesian and American Northwest coast ethnography in which big men and feasting play a key role (Flannery & Marcus Reference Flannery and Marcus2012), I wish in this paper to see egalitarianism as an active process. This is not of itself novel. For example, Blanton (Reference Blanton, Feinman and Marcus1998) and Dueppen (Reference Dueppen2012, 7) argue that egalitarian behaviour is a type of political action that aims to set up and sustain restrictions on the exercise of exclusionary power (see also Feinman Reference Feinman, Price and Feinman1995). There is a long and distinguished line of research that sees egalitarianism as an active process. Pierre Clastres (Reference Clastres1987, 214–15) argued that being egalitarian is an active choice: a rejection of unequal power. There is, of course, power in stateless societies, based on various forms of personal influence, age, gender and so on, but this power depends on the goodwill of the group, and coercive power is seen as a ‘negativity that is immediately subdued’ (Clastres Reference Clastres1987, 45) and a mortal risk to the group (1987, 44; see also Graeber Reference Graeber2004). (For applications of egalitarianism as an active revolutionary process in archaeology, see Dueppen Reference Dueppen2012 and Fowles Reference Fowles and Alt2010; Reference Fowles and Pauketat2012).
Such arguments have already been recognized in the Neolithic of the Middle East. For example, rather than seeing egalitarianism as a descriptive category, Kuijt (Reference Kuijt and Kuijt2002, 141) describes it as a process ‘to deliberately affect community behavior and social relations by emphasizing shared identity and affinity’. And further, ‘all egalitarian systems are a reaction … against formalized social differentiation’. Finlayson (Reference Finlayson2020, 27) suggests that ‘there is evidence that early Neolithic societies in Southwest Asia promoted egalitarian behavior’. Shared storage at Dhra’ and WF16 indicate that ‘PPNA subsistence … was very specifically prevented from being used as a means to inequality’ (Finlayson Reference Finlayson2020, 35).
In responding to this debate, I will focus on the data obtained from 25 years (1993–2018) of excavation and research at Çatalhöyük. The notion that differing social organizations at the site (first discussed in Hodder Reference Hodder2014) could be described in terms of molar and molecular arose from the consideration of those data, in dialogue with data from other sites in Anatolia and the Middle East and in reaction to theoretical debates in a variety of disciplines. It would be inaccurate to present this article as if the research involved a test of some theoretical preconceptions; rather, the data and interpretations of Çatalhöyük are described first before discussing the broad theoretical framework of molar and molecular that emerged, and before discussing cross-cutting terms such as heterarchy.
Çatalhöyük social organization: the Early and Middle phases
Çatalhöyük has seen differences of opinion about whether it was egalitarian or ranked. For example, the first excavator Mellaart (Reference Mellaart1967) envisaged priestly elites, Wason (Reference Wason2004) and Hayden (Reference Hayden2018, 315–18) saw evidence of ranking, whereas I have argued for an aggressive egalitarianism (Hodder Reference Hodder2014). What is the substance that lies behind these differences of opinion?
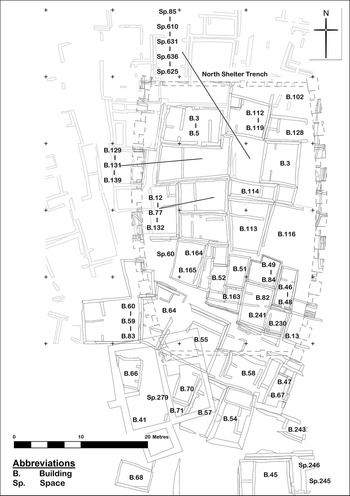
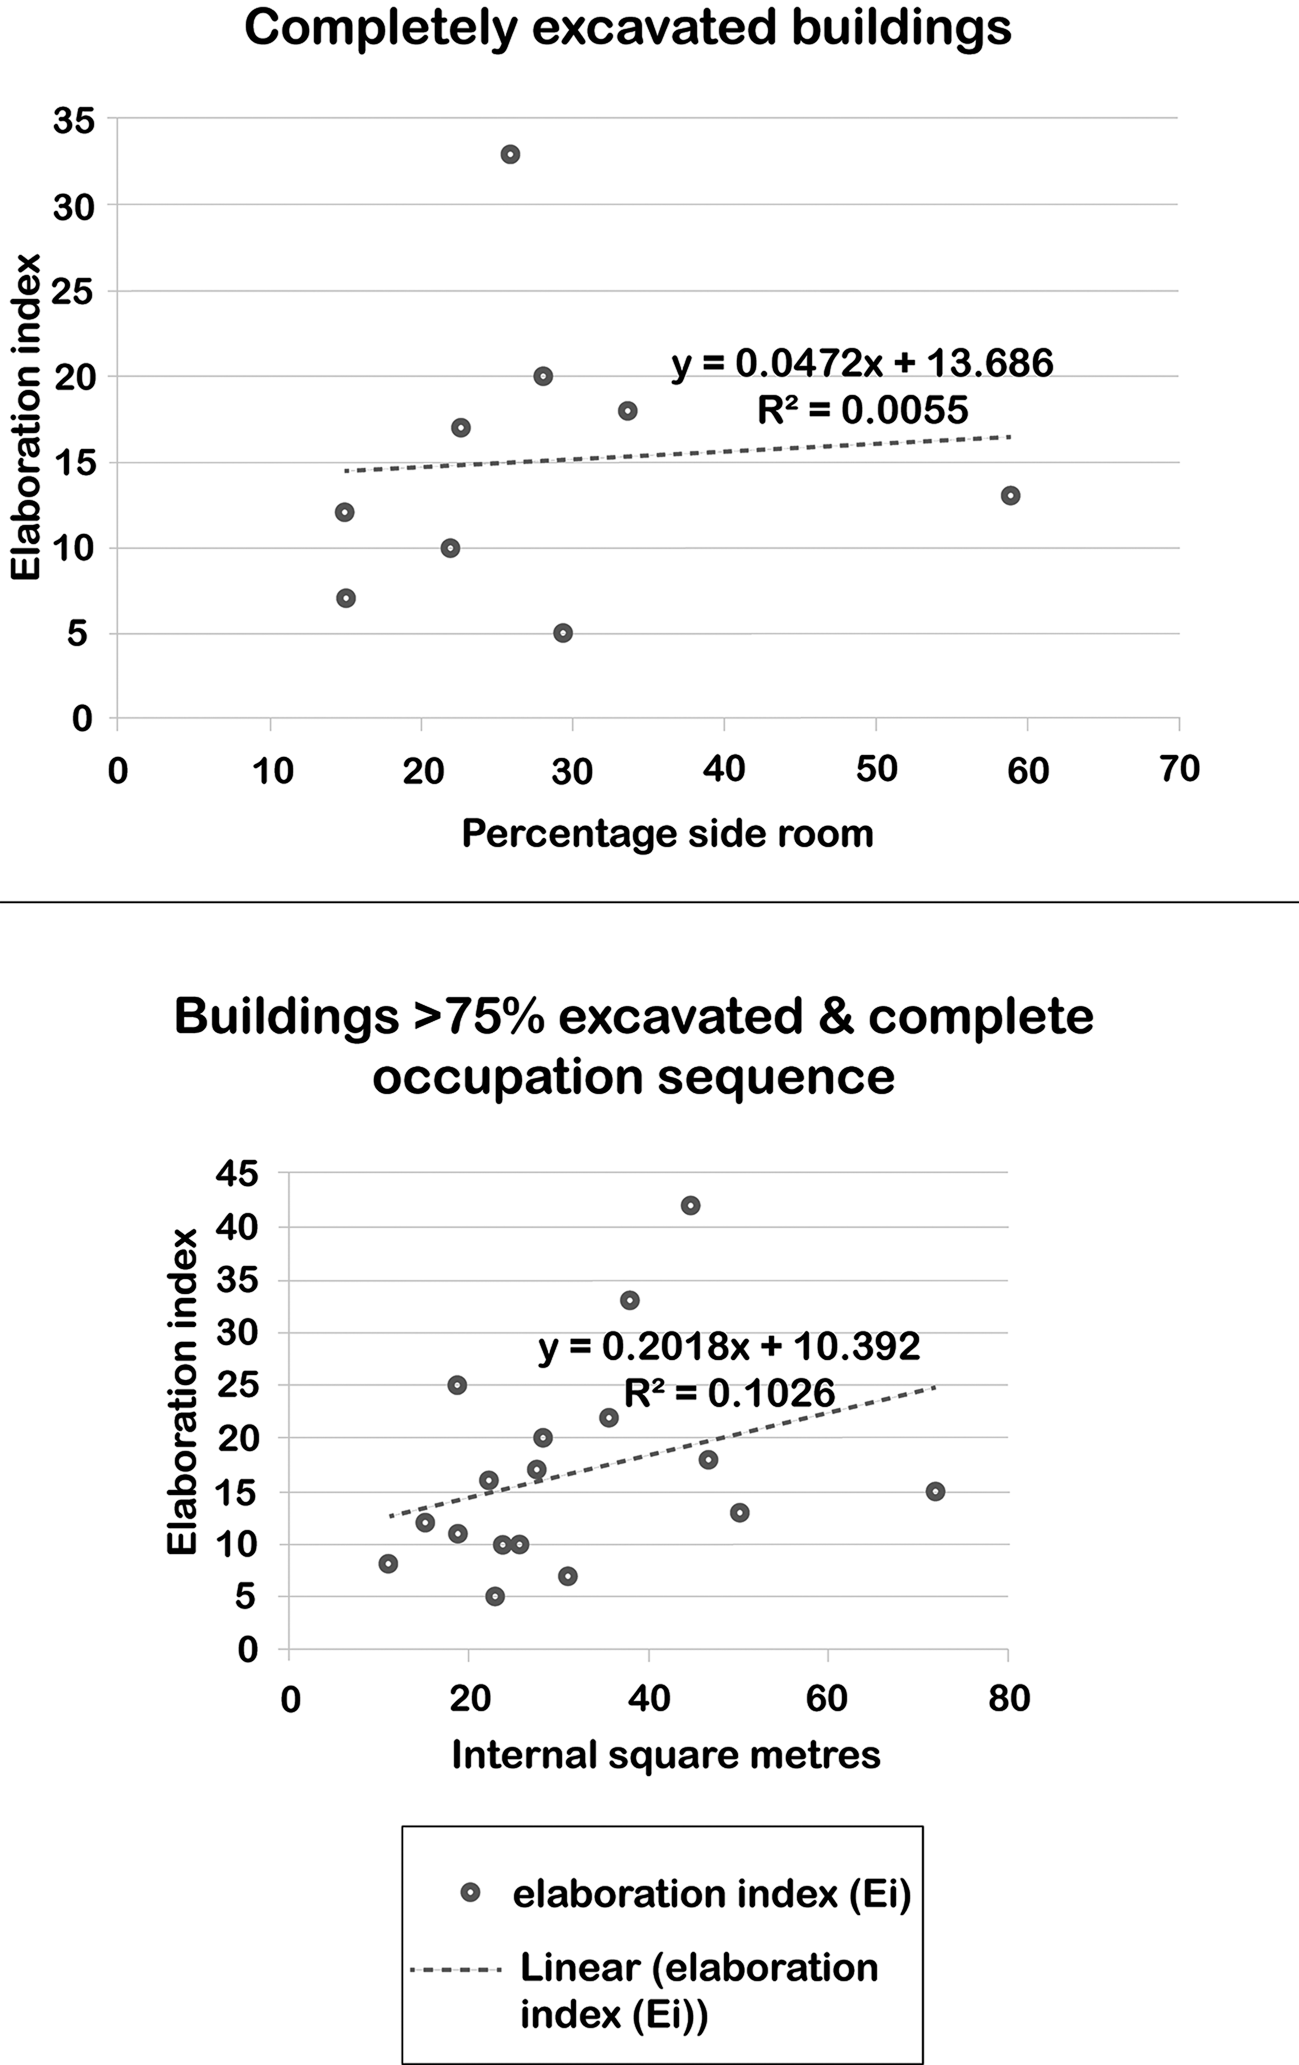
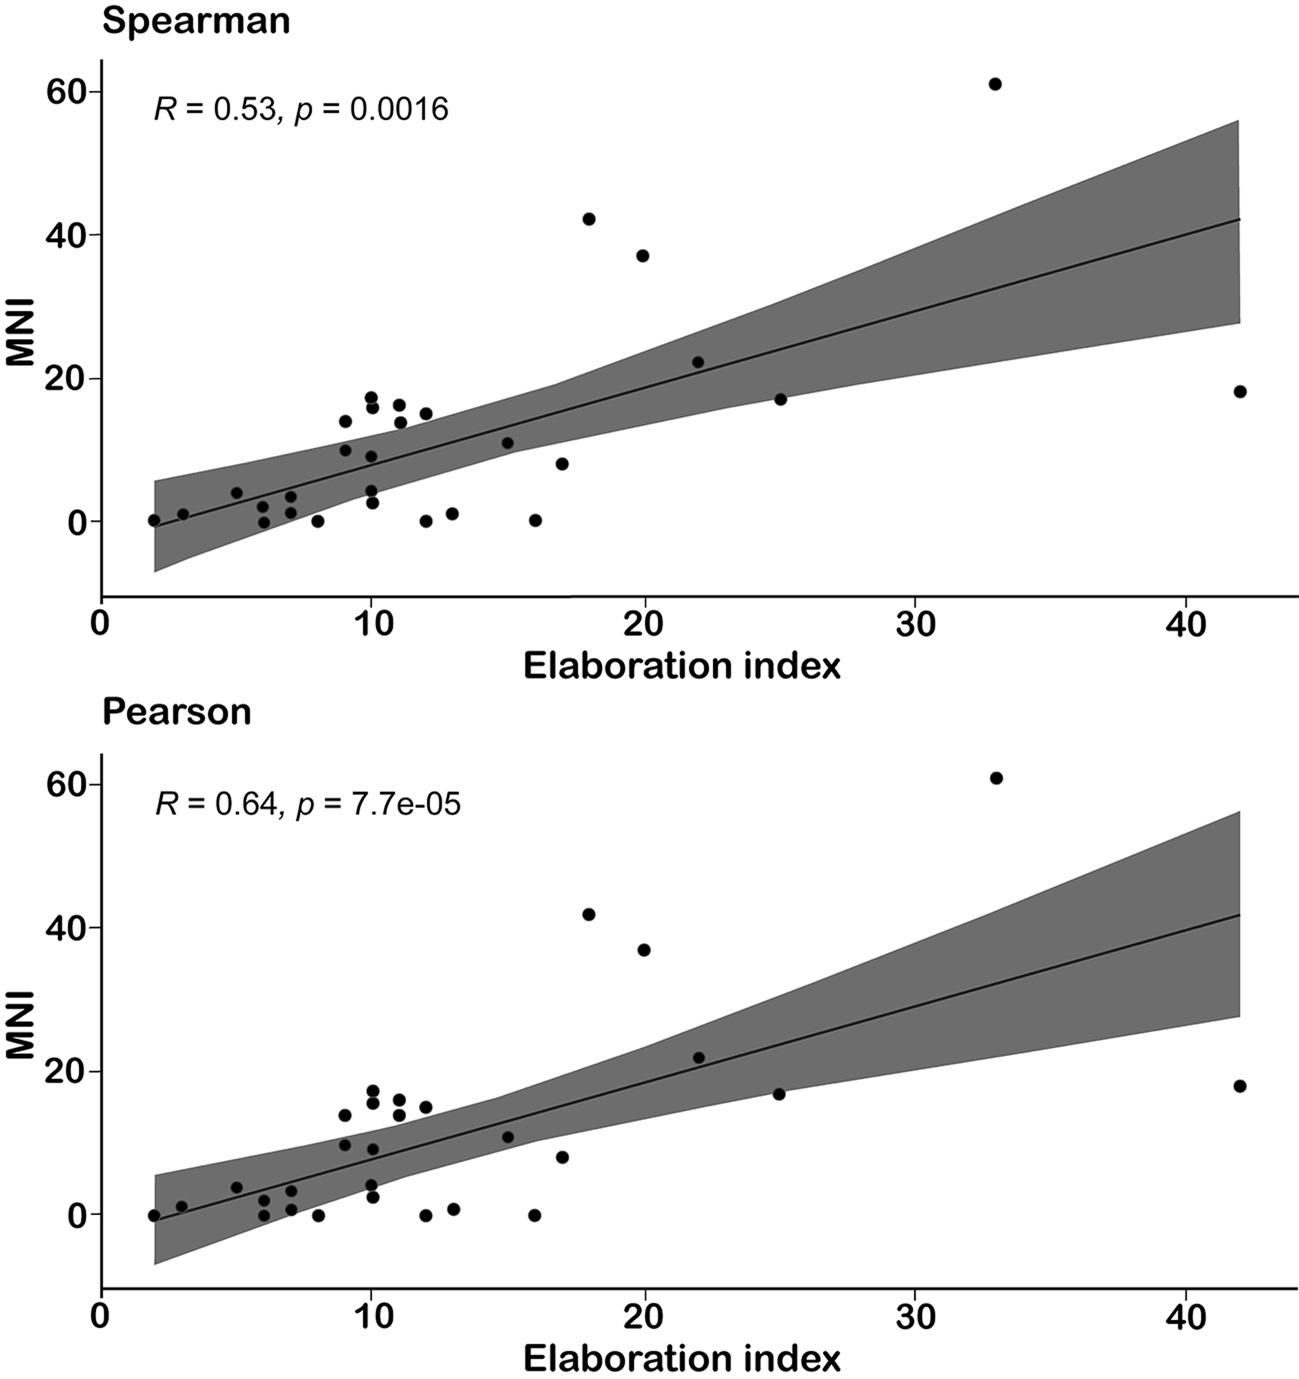
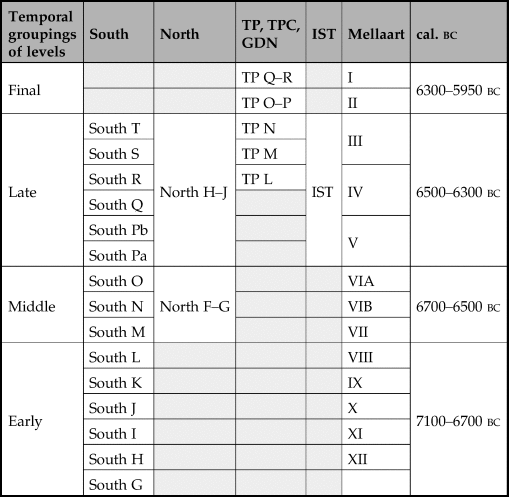
A cursory look at Çatalhöyük (7100–5950 cal. bc) excites questions about variability and inequality (Fig. 1). There is much variability in the size of buildings overall and in any one phase of occupation (Table 1). But despite years of research, no variable has been found that correlates with size (for greater detail on the data discussed here, see Hodder Reference Hodder2021a,Reference Hodderb; Reference Hodderforthcoming; Hodder & Tsoraki 2021). There is no evidence that house size correlates with any measure of inequality (Hodder Reference Hodder2016), despite assumptions to the contrary (Kohler et al. Reference Kohler, Smith and Bogaard2017). One possible measure of inequality is the degree of internal architectural elaboration of houses. Figure 2 shows an elaboration index for completely or 75 per cent excavated houses at Çatalhöyük. This index was devised by Hodder and Pels (Reference Hodder, Pels and Hodder2010) and simply sums the numbers of floor segments, basins, benches, installations (protuberances on walls, including bucrania and other animal fixtures), pillars and paintings in the main room of the building. Kuijt (Reference Kuijt2018) argues that this measure mixes mundane architectural features such as floor segments and wall pillars on the one hand, and symbolic features such as paintings and bucrania. However, it is difficult to discern which features are more or less symbolic—for example, floor segments seem to have played an important symbolic role in differentiating areas of activity. Therefore I have preferred to retain the original index. The simple sum of features does not correlate with size of building (Fig. 2), but it does correlate with the minimum numbers of individuals buried beneath the house floors of buildings (Fig. 3). Those buildings with more elaboration and more burials have been termed ‘history’ houses, since the placing of bucrania and ancestral remains within buildings can be seen as a process of memorialization (Hodder & Pels Reference Hodder, Pels and Hodder2010).
Plan of buildings from multiple levels (North F to I) in the North Area of Çatalhöyük. Buildings without numbers have been surface scraped but not excavated. (Map redrawn by Justine Issavi based on data from Camilla Mazzucato and the Çatalhöyük Research Project.)

The elaboration index in completely or at least 75 per cent excavated buildings in relation to (above) the percentage of a building floor space devoted to side room(s) and (below) the overall internal space in a building. (Figure redrawn by Justine Issavi based on data provided by the author and the Çatalhöyük Research Project.)

The relationship between the elaboration index and the Minimum Number of Individuals buried in a building at Çatalhöyük. The envelope indicates the 95 per cent confidence level. (Figure redrawn by Justine Issavi based on data provided by the author and Claudia Engel.)

Temporal groupings of levels at Çatalhöyük. In this article the terms early and late (without capitalization) are used to refer to the Early-Middle and Late-Final periods respectively. (Source: Çatalhöyük Research Project.)

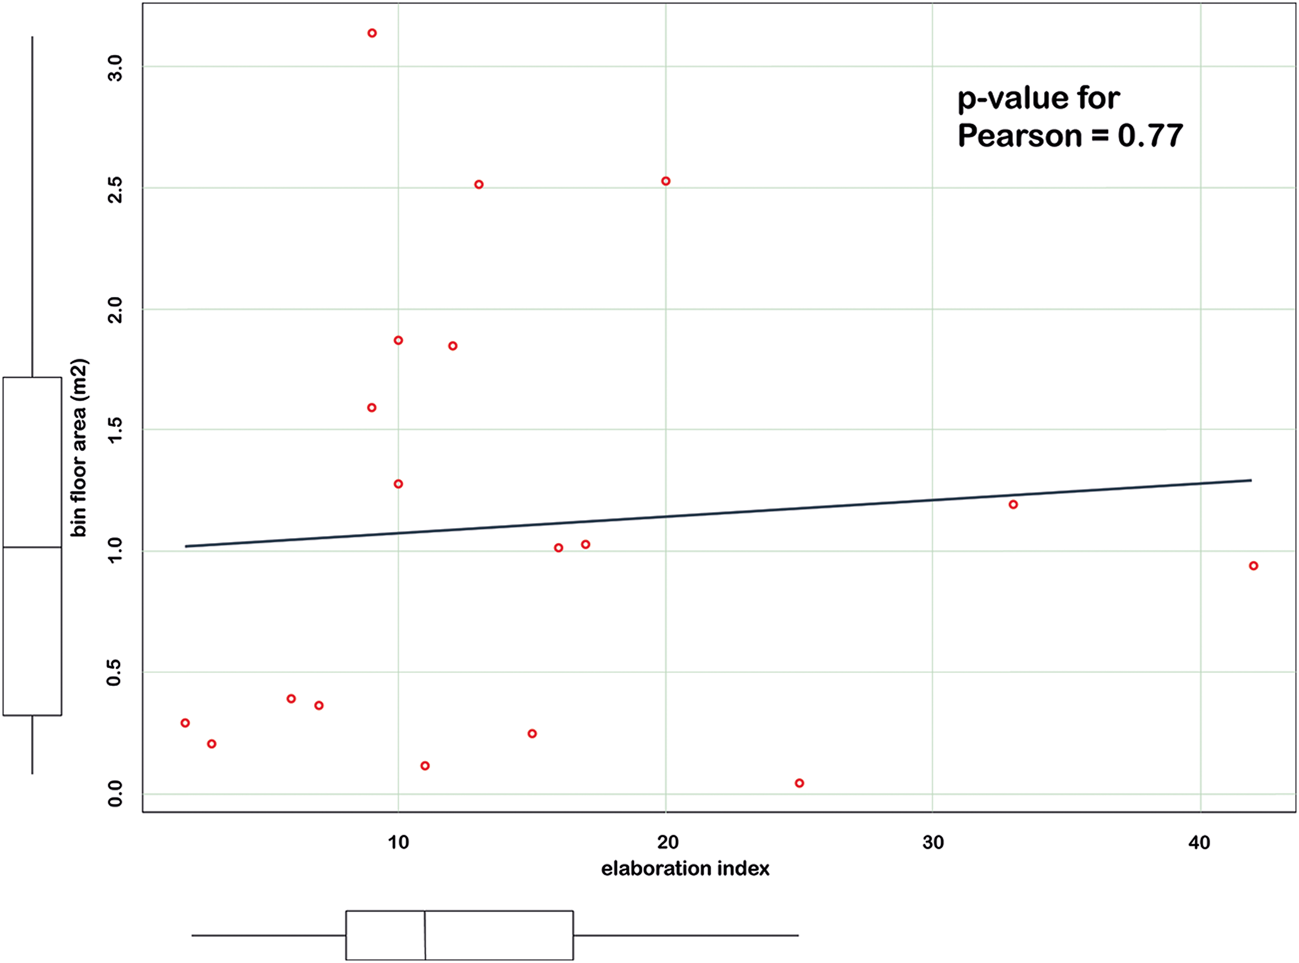
It can be argued that the presence of buildings with more elaboration and burial suggests inequality, at least in the ritual sphere, but we have found no variable that correlates with this variability. As already noted, there is no correlation with size of building. Neither is there any correlation with the percentage of side-room space given over to storage and production (Fig. 2), nor between the elaboration index and the size and number of storage bins (Fig. 4). (A similar argument is made by Benz et al. Reference Benz, Alt, Erdal, Şahin, Özkaya and Hodder2018, 152, in relation to PPNA Körtik Tepe, where social differentiation in burial customs is not mirrored in daily practices, architecture, or diet.)
The relationship between the elaboration index and the amount of floor space used for storage bins. (Source: the author and Justine Issavi.)

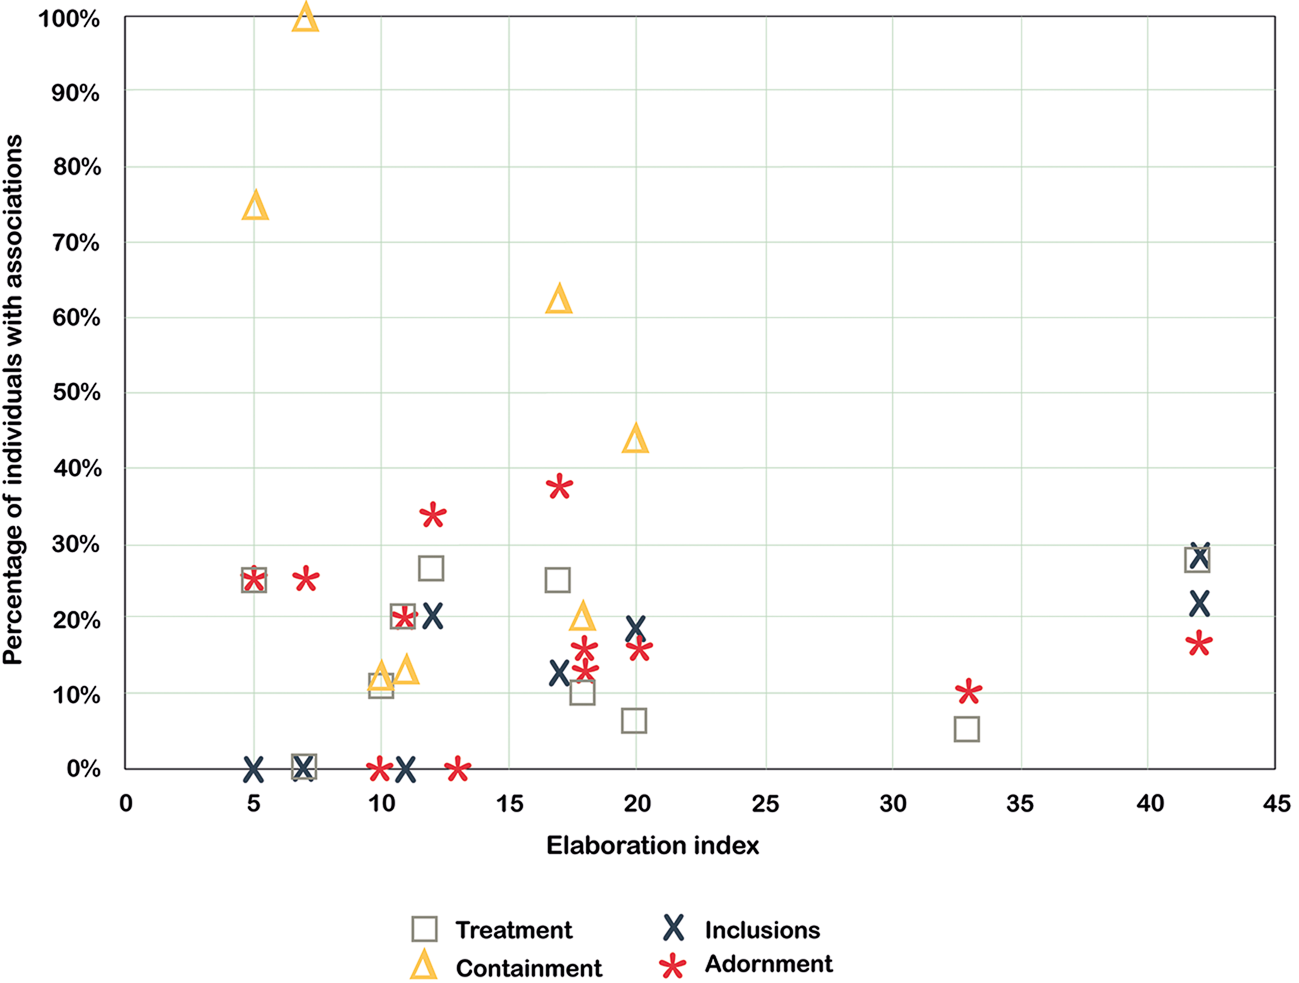
So it is clear that the more elaborate houses with more burials could not translate their position into the control of production and storage. We have found the same lack of correlation with many variables, whether we are looking at groundstone, plant and animal bone densities, diet (based on C and N isotopes), or at a whole series of skeletal measures of health and work practices (Bogaard et al. Reference Bogaard, Charles, Filipović and Hodder2021; Knüsel et al. Reference Knüsel, Milella, Betz and Hodder2021; Pearson et al. Reference Pearson, Lamb, Evans and Hodder2021; Tsoraki Reference Tsoraki and Hodder2021; Twiss et al. Reference Twiss, Wolfhagen, Demirergi, Mulville and Hodder2021). No correlation was found between the number and density of figurines or beads in a building and the elaboration index (Nakamura Reference Nakamura and Hodder2021; Vasić et al. Reference Vasić, Knüsel, Haddow and Hodder2021). Inequality is often measured in terms of the number or ‘richness’ of artifacts in graves. Figure 5 shows the percentage of individuals with different types of associations and treatments in graves in buildings, plotted against the elaboration indices for those buildings (Vasić et al. Reference Vasić, Knüsel, Haddow and Hodder2021). Again, there is no correlation. The more elaborate buildings do not have richer burials.
The elaboration index in relation to the percentage of individuals buried with different types of associations and treatment in buildings. (Figure redrawn by Justine Issavi based on data provided by Milena Vasić and the Çatalhöyük Research Project.)

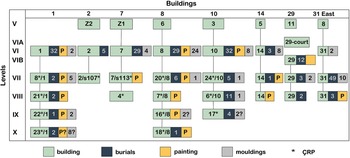
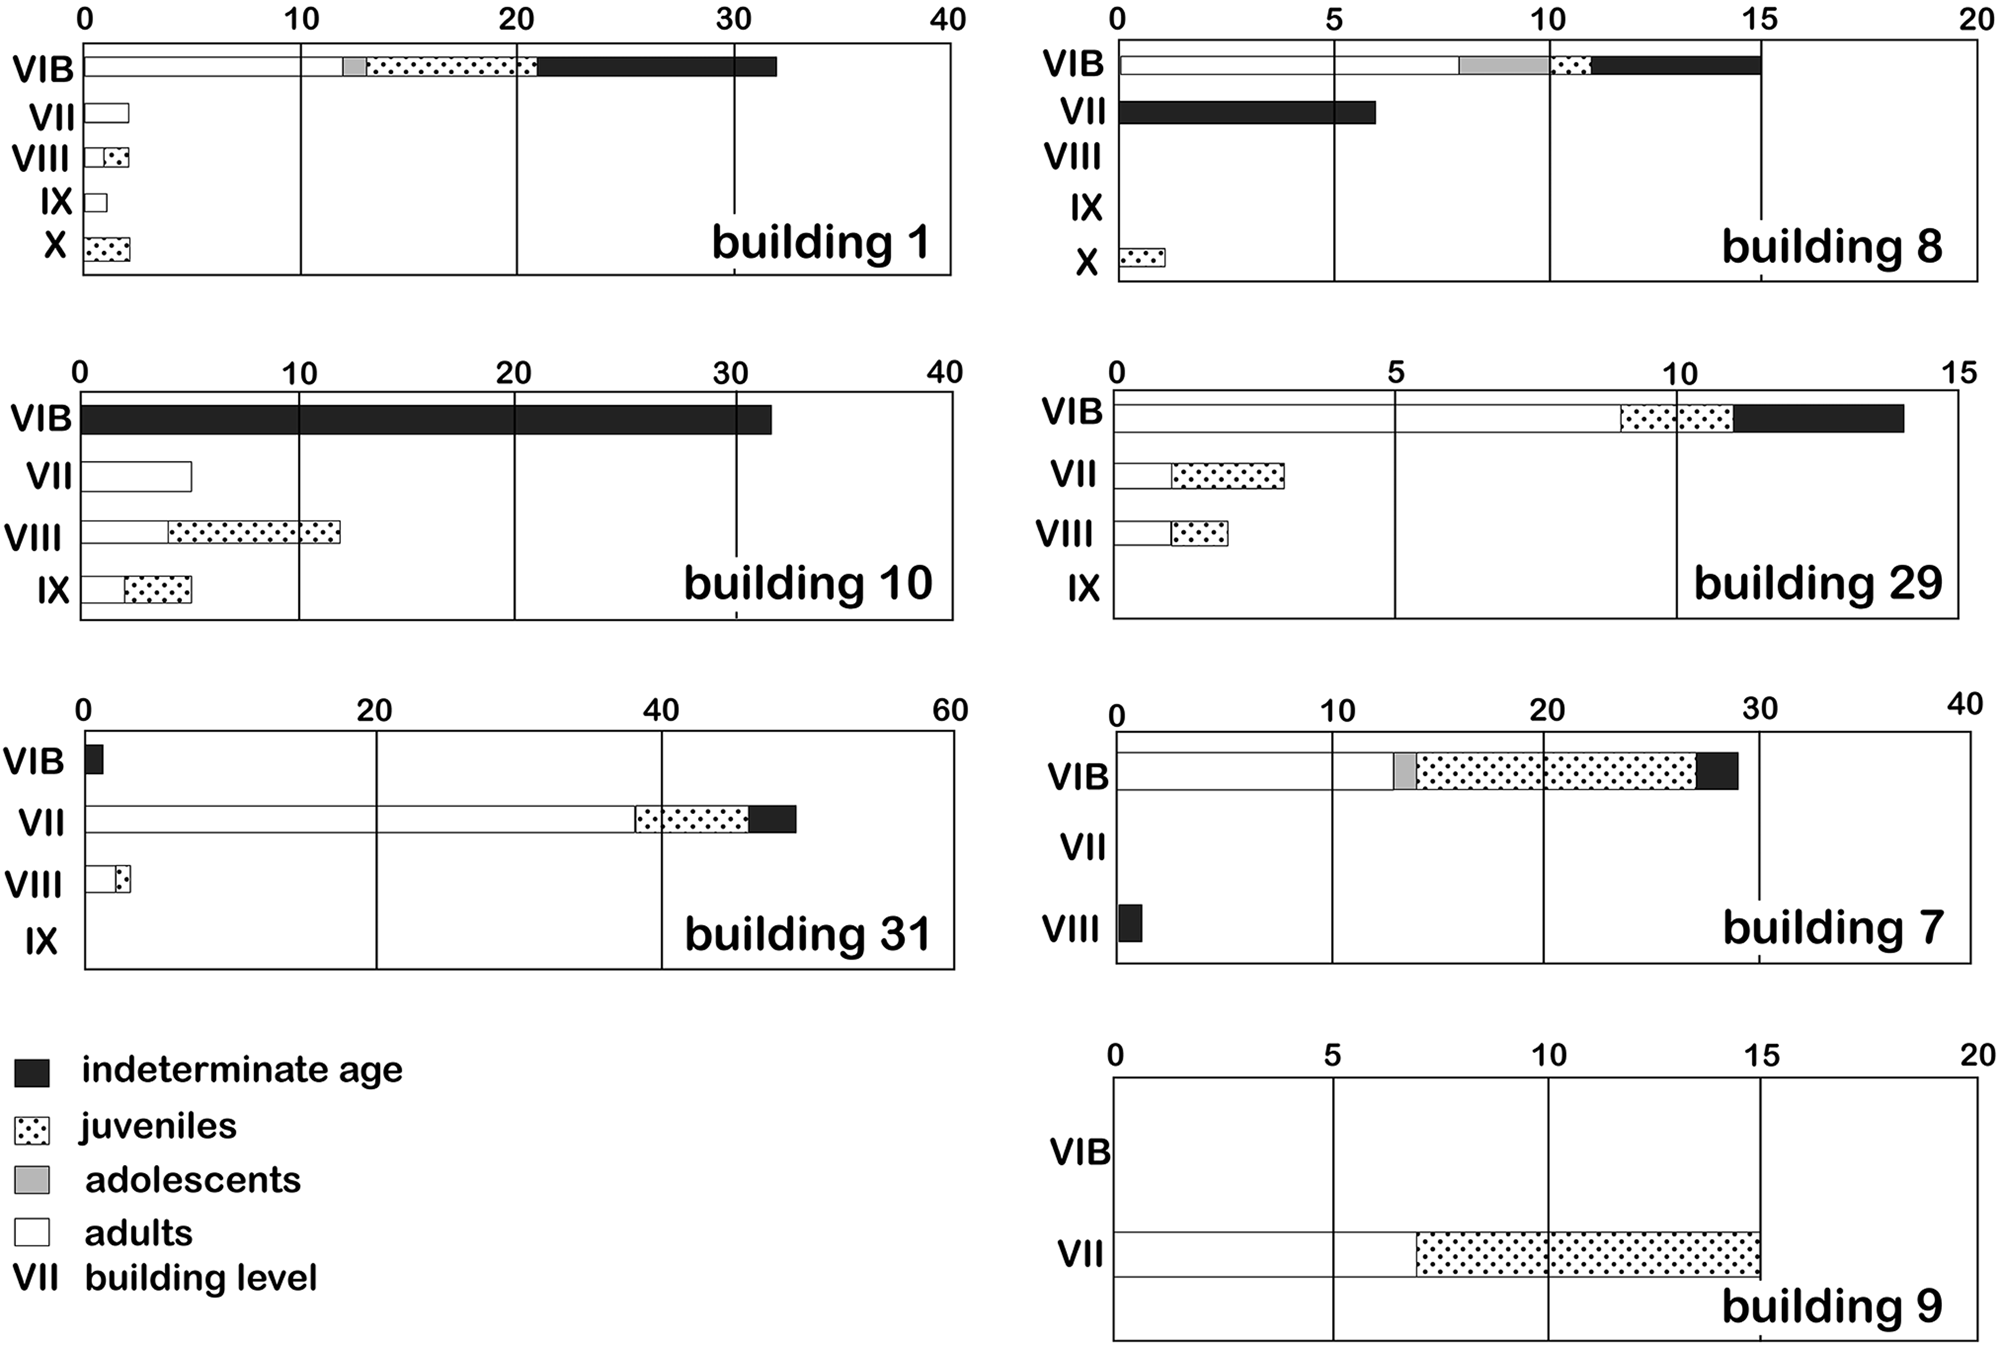
So this seems a very egalitarian society, except that there are some buildings that have more elaboration and burial. My use of the term ‘aggressively egalitarian’ (Hodder Reference Hodder2014; see Currás & Sastre Reference Currás and Sastre2019 for the related term ‘assertive egalitarianism’) results from the evidence that the more elaborate buildings with many burials made attempts to aggrandize but were dampened and constrained such that an overall egalitarianism could be maintained. Bleda Düring (Reference Düring2005; Reference Düring2006; Reference Düring2007) noticed a recurring pattern in relation to the elaborate buildings excavated by Mellaart in what is now termed the South Area. Several of these buildings had been rebuilt several times on the same footprint, and as they were rebuilt the numbers of architectural mouldings and paintings increased into Mellaart's Levels VII or VI (Fig. 6), at which point the buildings were frequently burned, followed by a discontinuity or a rebuilding of a less elaborate building, often on a rather different footprint. Düring (Reference Düring2006) also collated information on the numbers of burials in these buildings through time. As shown in Figure 7, the numbers of sub-floor burials in buildings tend to increase into Levels VII or VI, before again declining sharply.
Overview of the development of continuous Çatalhöyük buildings in the South Area and the number of burials, mouldings and wall paintings they contain. Çatalhöyük Research Project building designations (as opposed to those used by Mellaart) are shown with an asterisk. (Figure redrawn by Justine Issavi based on Düring Reference Düring2006, fig. 6.28, with permission.)

Sub-floor burials in continuous Çatalhöyük buildings by level. (Figure redrawn by Justine Issavi based on Düring Reference Düring2006, fig. 6.29, with permission.)

As Hamilton (Reference Hamilton and Hodder1996) has shown, the recording of burials by Mellaart was often inaccurate. It is thus important to turn to the data collected in the more recent excavations. In one case it has been possible to extend one of Mellaart's columns of buildings in the South Area: the following minimum numbers of individuals were found buried in Building 162 (0 MNI), B161 (8), B160 (4), B43 (9), B27 (0) (from the lowest to the uppermost). This early sequence of buildings from the equivalent of Mellaart's Level XI to his Level VII is little elaborated, as is often the case in the earlier levels, but Building 43 in Level VIII contained a pair of opposed leopard reliefs. This sequence perhaps again suggests some increased elaboration and burial in Level VIII followed by a less elaborate building in Level VII (B27).
The North Area architecture
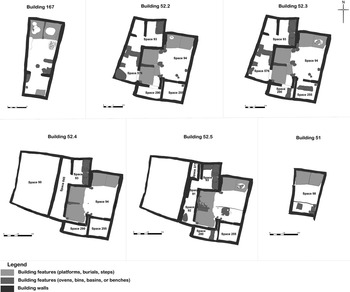
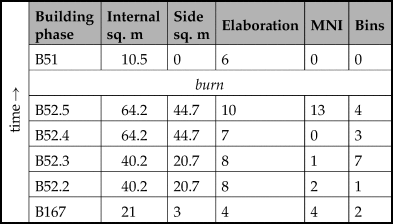
A more detailed exploration of these types of sequences is possible as a result of the new excavations in the North Area, although these have focused on spatial patterning rather than long sequences of buildings. The excavations in the North Area also allow more refined phasing within the life-span of buildings. Table 2 provides information for the building sequence from B167 to B52 (with several subphases) to B51, and the sequence of plans is shown in Figure 8. As is shown in the Table, there is through time an increase in size of the building, as well as the size of side rooms, and increases in the elaboration index and MNI before the building is burned, to be replaced by a much smaller and less elaborate building (B51). These buildings have not been accurately dated, but the lithic and ceramic assemblages and relationships with adjacent buildings have placed the sequence into North G, equivalent to Mellaart's Level VI (based on a variety of relative and absolute dating as argued by Farid et al. Reference Farid, Hodder, Taylor, Tung and Hodderforthcoming).
The B67–B52–B51 sequence of plans. (Figure assembled by Justine Issavi based on data provided by Camilla Mazzucato and the Çatalhöyük Research Project.)

Changes in the size, elaboration and numbers of bins and burials through time in the occupation of Buildings 167, 52 and 51. (Source: the author and Çatalhöyük Research Project.)
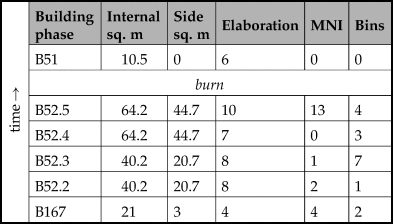
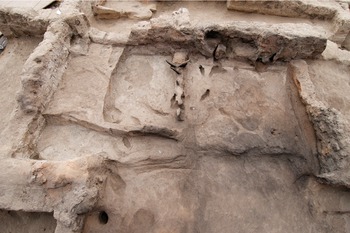
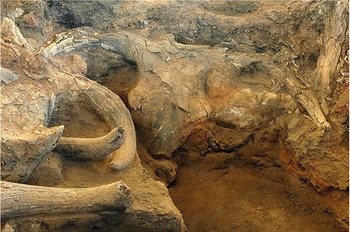
The B167–B52–B51 sequence suggests a clear process of aggrandizement. The initial B167 is small and with a typical Çatalhöyük internal layout. In B52.2 the western wall of the building is knocked through to give access to spaces for platforms and storage and production areas (with bins, basins and oven). After a relatively stable phase B52.3, there is further expansion of the building in B52.4 to enclose an adjacent area to the west. B52.4 sees the greatest height of elaboration. The extended footprint of the building continues and sheep and goat horns are added to a very thin partition between the platforms in the western part of the main room (Fig. 9). These are then covered over by a thick bench in which are set bull horns (Fig. 10); a bucranium is set into the wall nearby and on this are placed 13 bull horns as part of the burning of the building. There has been much debate about the nature of the burning of B52.4 (Twiss et al. Reference Twiss, Bogaard and Bogdan2008), but the stacking of the bull horns suggests a process of ritual closure. B51 is then nestled into the corner of the earlier, larger and more elaborate building.
Thin ‘bench’ studded with sheep and goat horns between western platforms in B52.5. This ‘bench’ replaced an earlier plain bench and was itself replaced by the larger bench shown in Figure 10. (Source: Jason Quinlan and the Çatalhöyük Research Project.)

Large bench (to the left) set with cattle horns in B52.5. By the bench a bucranium was set into the wall and on top of this 13 bull horns were placed during abandonment. (Source: Jason Quinlan and the Çatalhöyük Research Project.)

In this B167–B52–B51 sequence we see a gradual increase in elaboration and burial leading up to a burning and a return to a much smaller building. As shown in Table 2, there is no parallel increase in the number of bins; rather the sequence conforms to the pattern seen in Figure 4 of a lack of correlation between elaboration and bin capacity. The B167–B52–B51 cycle concerns architectural elaboration and numbers of burials. In this case there is also a link with overall building size and size of side rooms, but as was shown in Figure 2, this is not a site-wide pattern.
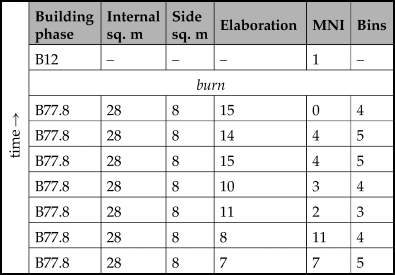
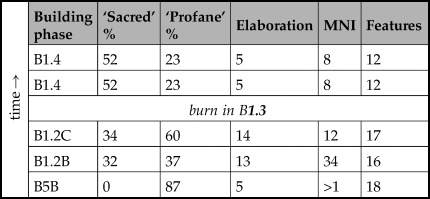
Other sequences in the North Area show similar if slightly variant patterns of building variation through time, either on the same footprint or on the same location or building lot. The B77–B12 sequence as shown in Table 3 sees a gradual increase in elaboration through time including a northeastern platform bordered by bull horns, as well as a niche, bucranium and paintings, with hand prints, on nearby walls (House Reference House and Hodder2013). There is then a burning in which large numbers of groundstone artifacts are intentionally broken and deposited on the house floors (Tsoraki Reference Tsoraki and Hodder2021) before a much reduced building (B12) is constructed. In this case the frequencies of burials show a different pattern with a decline through time. The numbers of bins do not seem to increase or decrease in association with these trends. Data for the B5–B1 sequence were collected in early stages of the project and were collated by Cessford (Reference Cessford and Hodder2007) in rather different terms (Table 4), but again the burning in phase B1.3 of what had been a very elaborate building in phases B1.2B and B1.2C with many burials (overall in this building an MNI of over 54 was recovered) leads to the construction of a much smaller building (B1.4) nestled within just half of the earlier building.
Changes in the size, elaboration and numbers of bins and burials through time in the occupation of Buildings 77 and 12. (Source: the author and Çatalhöyük Research Project.)

Changes through time in the amount of floor space used for ritual (‘sacred’) and domestic (‘profane’) activities, and in the elaboration and numbers of burials through the occupation of Buildings 5 and 1. (Source: Cessford Reference Cessford and Hodder2007.)

The North Area has been the subject of a detailed Bayesian dating program (Bayliss et al. Reference Bayliss, Chivall, Farid, Goslar, Issavi, Tung and Hodderforthcoming) so that it is possible to compare the timings of the individual burnings in B1.3 and B77.8. An adjacent B131 was also burned and it had a large number of burials (MNI 41), but we have not excavated the underlying building B139 so it is difficult to evaluate the sequence. The three burns in B1.3, B77.8 and B131 all took place within overlapping 95 per cent probability ranges between 6555 and 6450 cal. bc. So they could all have occurred at closely similar times. However, the burning in B131 was stratigraphically later than the burn of B77. The Bayesian analysis of the South Area awaits completion. In general terms the Level VI burnings in that area have been assigned, on the basis of radiocarbon determinations (Cessford Reference Cessford and Hodder2005), to approximately 6500 bc. Thus although there may be a horizon of heightened burnings around 6500 cal. bc, the stratigraphic evidence in the North Area indicates that the burnings of buildings did not all occur at the same moment in a site-wide conflagration, as had been suggested for the South Area by Mellaart (Reference Mellaart1967).
The social process in the Early and Middle Levels
There is thus variability in the life histories of the more elaborate houses in the Early and Middle Levels at Catalhoyuk. A process of aggrandizing in terms of architectural elaboration and numbers of burials happens at different times in different ways through much of the Early and Middle levels, but especially builds up to an increased frequency of burning in Level VI/South O/North G at around 6500 cal. bc. Despite the variability in these life histories, there is not a recurring pattern whereby the social and ritual aggrandizement is associated with the ability to control production or storage (pace the claims of Hayden Reference Hayden2018, 315–18). In addition, accumulation of features such as bull horn installations, and the deposition of bull horns and intentionally broken groundstones on abandonment, cannot be seen in terms of conspicuous consumption/destruction leading to enhanced status; rather, the life histories always seem to lead to a levelling and diminution.
What were these levelling processes at Çatalhöyük in the Early and Middle phases? We can presume that methods such as ridicule, gossip, ostracism may have been in play. We have also seen above that a separation was often maintained between the socio-religious spheres and areas of production; this distinction is neatly encapsulated in the strict spatial division within buildings between the southern and side room areas used for ovens, hearths, tool and food production and the northern platforms where adult burial and paintings and installations occurred (Hodder & Cessford Reference Hodder and Cessford2004). There is some dietary and figurine evidence that elders had a distinct status in society, and elders may have been charged with the monitoring and passing down of these rules (Nakamura Reference Nakamura and Hodder2021; Pearson & Meskell Reference Pearson and Meskell2015). They may also have monitored the ritual practices that interrupted the life histories of buildings by burning, infilling, artifact breakage and deposition or temporary abandonment—the Bayesian dating in the North Area has demonstrated that there were sometimes periods of abandonment during which, for example, midden accumulated in abandoned buildings (Bayliss et al. Reference Bayliss, Chivall, Farid, Goslar, Issavi, Tung and Hodderforthcoming).
These levelling mechanisms can be situated within an overall social and ritual system characterized by complex cross-cutting ties. The settlement as a whole was ordered by a set of highly repetitive rules that were embodied in daily practices within the house, in particular the north–south separation of activities that has been widely discussed (Baird et al. Reference Baird, Fairbairn and Martin2017; Hodder & Cessford Reference Hodder and Cessford2004). But there is increasing evidence that individual buildings were linked to other buildings within a nested and overlapping set of balanced divisions.
The overall site by the sixty-sixth century cal. bc is undoubtedly a distinct whole. As already noted, the layout of individual buildings is remarkably uniform, despite individual variability. Much of this variability is linked to spatial distance within the mound. Mazzucato (Reference Mazzucato2019) has conducted network analysis of the buildings based on their architectural features and burial contents, and their artifact assemblages including faunal, botanical, ceramic and lithic. The conclusion of this work was that
within the highly interconnected system of networks at Çatalhöyük, the modularity maximization algorithm was able to isolate groups of buildings that were materially related or were interacting more intensely among themselves than with buildings belonging to other groups; these modules/communities consist of spatially adjacent buildings. Thus, buildings that are geographically adjacent are embedded in dense sets of material connections that differentiate them from other groups of neighbouring buildings. Buildings that are close to each other in space are more similar in terms of material assemblages and are therefore more intensely connected. (Mazzucato et al. Reference Mazzucato, Doyle, Issavi, Hodder and Tsoraki2022, 143)
For example, the network analysis identified differences between the northern and southern submounds which are distinct features of the Neolithic East Mound as a whole. These two halves, contemporary in the Middle phase, are distinguished in terms of, for example, the location of the main burial platform in buildings (Mazzucato et al. Reference Mazzucato, Doyle, Issavi, Hodder and Tsoraki2022). Archaeobotanical evidence has found that new crops and technologies were introduced at different times and rates in the two submounds—as if the agricultural practices differed between them to some degree (Bogaard et al. Reference Bogaard, Charles, Filipović and Hodder2021).
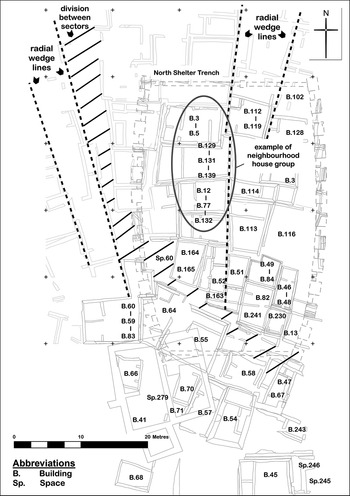
Other spatial groupings within the submounds are summarized for the North Area in Figure 11. The evidence for these divisions is as follows. The separation of buildings into sectors is based on the presence of long linear zones of open space or midden (an example is shown by the diagonal hatching in Figure 11). There are no doorways from these zones into buildings and they do not seem to have functioned as ‘streets’ (based on micromorphological evidence: Matthews et al. Reference Matthews, Almond, Anderson, Wiles, Stokes and Hodder2013). We have not excavated sufficiently across these sector boundaries to determine whether there are material practice distinctions between them. The sectors are themselves divided by radial ‘wedges’ that are marked by the linear alignments of wall abutments. These lines that radiate out from the high points in both the north and south submounds are associated with distinct neighbourhoods (see below) and archaeobotanical evidence from the distribution of weed seeds on site suggests that these radial divisions may have extended out into the near landscape and may have partitioned the locally diverse wet and dry landscape in equitable ways (Bogaard et al. Reference Bogaard, Charles, Filipović and Hodder2021).
Different types of spatial groupings identified in the North Area. (Figure drawn by Justine Issavi based on data provided by the author, Camilla Mazzucato and the Çatalhöyük Research Project.)

Within and at times cross-cutting these radial wedges in the Early and Middle phases of the occupation are local groupings of similar buildings that constitute loosely defined neighbourhoods (as predicted by Düring & Marciniak Reference Düring and Marciniak2006). In conjunction with the work of Mazzucato (see above), we have now identified several examples of these neighbourhoods. For example, in the South Area, Vasić (Reference Vasić, Knüsel, Haddow and Hodder2021) has identified a neighbourhood that lasts through Levels South K to L based on distinctive burial features such as red pigment, imitation red deer canine beads, wooden planks and placed animal scat. This neighbourhood fits within a radial wedge. The neighbourhood shown in Figure 11 again runs through several phases and is characterized by buildings with large numbers of burials, large numbers of secondary burials, burials of young people with a very high number of beads, mace heads in burials, and an access hole between two of the buildings (Vasić Reference Vasić, Knüsel, Haddow and Hodder2021).
So one form of egalitarian leveling involved the balance and equivalence between nested units. We have found no evidence that any one wedge, sector or submound was dominant over others; neighbourhoods certainly varied, but again there is no evidence of greater storage or productive capacity in some neighbourhoods rather than others. Buildings were balanced with each other within neighbourhoods that were balanced with each other in wedges that were balanced against each other in sectors within submounds within the site as a whole. Lower-level groupings were equivalent to each other and nested into higher-level groupings within an overall spatial system that reached its apogee in the Middle phases in the sixty-sixth century cal. bc. The balance and nested symmetry of this overall system can be seen as functioning to level individual outliers or aggrandizers.
But this was by no means the only levelling mechanism that can be claimed in this time period. Mazzucato (Reference Mazzucato, Doyle, Issavi, Hodder and Tsoraki2022) in her network analysis also found cross-cutting links between buildings and it is certainly the case that many distinctive symbols and traits at Çatalhöyük are not spatially clustered. For example, the raised arm or bear reliefs (thought by Mellaart to be female goddesses) are found dispersed across the South Area of excavation, but also in the North Area (Farid Reference Farid and Hodder2014, fig. 30.11). The pairs of leopard reliefs are not found in neighbouring houses, but spread across the South Area settlement as a whole. The leopard reliefs and other distinctive features such as paintings of vultures are often found repeated as buildings are rebuilt (as in the case of Mellaart's Building 44 in which pairs or leopards on the north wall occur in Levels VIB and VII, and Shrine 8 in which vulture paintings occur in Levels VII and VIII).
The neighbourhood group marked in Figure 11 ‘bleeds’ over into adjacent B114 in that the latter building also contained a burial with a mace head (one of the features of this neighbourhood—see above). Cross-cutting links are also suggested by other aspects of burial practice. There is great variation in the numbers of burials in buildings, from 0 to 62. Given that it would be difficult to produce the larger numbers of burials from the inhabitants of these small houses over the typical 20–40-year lifespan of the buildings, and given that there is no evidence that particular categories of people were preferentially buried in buildings rather than off site, it seems clear that some buildings were used preferentially for burial, and as noted earlier these were often the more elaborate buildings. We of course do not know where these people lived during life. The dead in buildings could all have derived from local neighbourhoods. But there is some evidence to suggest that the co-burying group of people cross-cut the neighbourhoods: in the North Area the houses with many burials sometimes seem to cluster together themselves, such as the neighbourhood group shown in Figure 11.
The co-burying group thus may have cut across the spatial neighbourhoods and the members of the group also seem to have consumed together through life, or eaten food obtained from similar parts of the environment or using similar procurement practices. Pearson et al. (Reference Pearson, Lamb, Evans and Hodder2021) found statistically significant differences between those buried in buildings based on C and N isotopes. The notion that groups of houses prepared food and ate together is supported by detailed work on house histories (Kay Reference Kay2020; Reference Kay, Hodder and Tsoraki2022). In several buildings there is an absence of hearths or ovens in particular phases, suggesting that more than one building was involved in food preparation at certain times.
A further example of complex cross-cutting links is provided by the genetic evidence. Using dental metrics as a proxy for genetic distance, Pilloud and Larsen (Reference Pilloud and Larsen2011) found that those buried together (and who had similar diets) were not close genetically. Those buried together in a building were not more closely related than those buried in different buildings. This suggests that biological kin was cross-cut by fictive or practical associations—a person's biological parents were often not in the group that ate together and were buried together. This evidence has been corroborated by the results of aDNA analysis. The proportion of people in co-burying groups who are not related is much higher at Çatalhöyük than at earlier sites such as Aşıklı and Boncuklu. Among Çatalhöyük individuals co-buried in three buildings from the middle part of the sequence, only 2 out of 10 genomes had genetic kin identified (Yaka et al. Reference Yaka2021, 7). Biological and practical kin thus seem to have been cross-cutting.
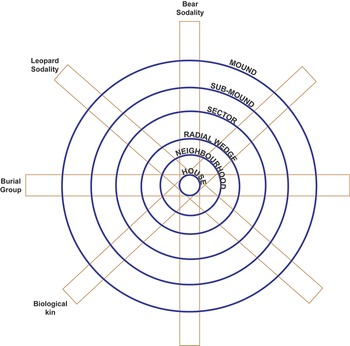
So in summary I am arguing that in Early and especially in the Middle phases at Çatalhöyük there were complex levelling mechanisms based around, on the one hand, nested spatial groupings of houses and neighbourhoods, and on the other hand cross-cutting affiliations and alliances (Figure 12 shows such a system from the perspective of an individual building). The nested spatial groupings levelled by creating balance and opposition; the cross-cutting connections can be seen as providing the horizontal circulation of food, burial and ritual practices. The elaborate buildings with more burials were often nodal in these cross-cutting connections and they were often associated with distinctive symbols (such as the leopard pairs, bear reliefs or vulture paintings) that can perhaps be interpreted in terms of sodalities such as hunting or medicine societies that extended across the site as a whole (for the notion of sodalities, see Mills Reference Mills and Hodder2014 and Hayden Reference Hayden2018). But as we have seen, these nodal buildings were not able to use their connections to aggrandize beyond a limited degree, and certainly not in terms of economic production and storage.
An interpretation of the nested groupings within which houses were situated, cross-cut by sodalities of various forms. (Figure drawn by Justine Issavi based on data provided by the author, with apologies to Kroeber Reference Kroeber1917, 185, fig. 3, and his work on Zuni social structure.)

The argument being made here is not that Çatalhöyük was a segmentary or segmentary lineage society (Sahlins Reference Sahlins1961). There have been many decades of criticism of these concepts and their evolutionary tones (Barth Reference Barth1966; Dresch Reference Dresch1986; Munson Reference Munson1989; Southall Reference Southall1988), and in any case there is much evidence that Çatalhöyük does not fit neatly into such a scheme. As already noted, neighbourhoods were probably cross-cut by co-burying and co-eating groups, and we have seen at least one example where a neighbourhood cuts across a radial wedge (Fig. 11). But there does appear to be evidence for some form of spatially nested system (a related nested pattern has been argued for at the 20 ha site of Sha'ar Hagolan in the seventh-millennium Yarmukian Pottery Neolithic: Garfinkel Reference Garfinkel, Banning and Chazan2006), but with many cross-cutting processes. The spatial nesting and the cross-cutting may have balanced or constrained each other: nodal buildings in the cross-cutting networks may have been dampened by the balance with other entities in the nested system, and buildings that became nodal at apical points in the nested system may have been constrained by obligations in the cross-cutting networks. It is incorrect to claim that the cross-cutting ritual sodalities ‘enabled ambitious men to operate with impunity’ (Hayden Reference Hayden2018, 318); there were countervailing processes that constrained and limited aggrandizement.
The Late and Final phases
The form of social organization that reached its height in the Middle phases would have been very effective at buffering risk as individual buildings and inhabitants had enormously complex sets of ties that could be called upon in times of hardship. Concomitantly, the organization would have been very demanding in that all the various different types of affiliations and networks would have had to be continually maintained and provisioned. These demands on labour may have been one of the reasons population size and density and the spatial extent of the site reached their maximum in the Middle phase (Hodder Reference Hodder2014). There is evidence from the age distributions of human skeletal remains that population increase was fuelled by increased fertility (Knüsel et al. Reference Knüsel, Milella, Betz and Hodder2021). But there is also evidence of heightened stress and disease on the skeletons in the Middle phase (Larsen et al. Reference Larsen, Hillson, Ruff, Sadvari, Garofalo and Hodder2013).
There is much evidence of a major response to these problems that gradually led to a rather different social organization in the Late and Final phases (Hodder Reference Hodder2014; Marciniak et al. Reference Marciniak, Asouti, Doherty, Henton, Hodder and Marciniak2015). In these later levels the extent of occupation in the North Area gradually diminishes and some reduction is also seen in the South, while new areas of occupation occur on a small eastern part of the East Mound and then (perhaps as early as 6300 cal. bc) on the West Mound (Orton et al. Reference Orton, Anvari, Gibson, Last, Bogaard, Rosenstock and Biehl2018). After 6500 bce there thus seems to be a decline and a dispersal or fragmentation of occupation. There is more space between houses and less continuity of houses (Düring Reference Düring2005; Reference Düring2006). A decrease in dental asymmetry in the Late period is seen as consistent with decreasing population densities through time (Knüsel et al. Reference Knüsel, Milella, Betz and Hodder2021). There is also confirmation from cross-sectional geometry of human limb bones of increasing mobility and movement into the Late period (Larsen et al. Reference Larsen, Hillson, Ruff, Sadvari, Garofalo and Hodder2013). Sheep isotopes indicate that animals were grazed over wider extents of the Konya Plain (although rarely beyond it) (Pearson et al. Reference Pearson, Lamb, Evans and Hodder2021). There is also some evidence that buildings exerted greater independence. For example, in Level South R two columns of buildings have been excavated: B53–B42, and about 15 m to the east, B65–B56–B44–B10. The sheep δ13C values in the open area deposits by each building are markedly different, suggesting that the sheep associated with the second stack of buildings were grazed over a wider range of environments than the first, a pattern repeated over several rebuilds (Hodder et al. Reference Hodder, Bogaard, Engel, Pearson and Wolfhagenforthcoming; Pearson et al. Reference Pearson, Lamb, Evans and Hodder2021). This notion that buildings acted with a greater degree of independence in the later levels is confirmed by the network analyses mentioned above (Mazzucato et al. Reference Mazzucato, Doyle, Issavi, Hodder and Tsoraki2022). Though there are less data available for spatial network analysis in the upper levels, the ‘results are consistent with an increase of fragmentation of the built environment and a progressive dispersal of population at the site during the Late period after 6500 calBC’ (Mazzucato et al. Reference Mazzucato, Doyle, Issavi, Hodder and Tsoraki2022, 144).
As already noted, there are some stacks of rebuilt buildings in the Late phases, although these appear less common and consistent (Düring Reference Düring2006). The best studied stack in the recent excavations is the B65–B56–B44–B10 sequence in the South Area. Although this sequence has buildings with some elaboration and burials, there is no indication of incremental aggrandizing behaviours. Indeed, in the Late and Final phases in the site as a whole, there is an overall decrease in bull horn installations (Russell & Meece Reference Russell, Meece and Hodder2006) and an increase in mobiliary art (stamp seals and decorated pottery). Burial becomes less common beneath house floors in the latest levels (from 6300 to 5950 cal. bc) and largely disappears from buildings on the ensuing West Mound (Rosenstock et al. Reference Rosenstock, Anvari, Franz, Orton, Ostaptchouk, Stroud, Biehl and Marciniak2019).
Although the shifts through time into the upper levels are subtle and gradual, buildings do appear to become more independent and self-sufficient, and there is a greater focus on mobility and dispersal. The complex socio-ritual system based on nested and cross-cutting networks seems increasingly less prevalent. The new system is accompanied by a decrease in skeletal evidence for stress and disease (Larsen et al. Reference Larsen, Hillson, Ruff, Sadvari, Garofalo and Hodder2013), and it is associated with a set of important economic changes. In particular, there is a dramatic rise in sheep proportions during the site's later occupation and this is matched by a rise in sheep-bone densities in the Late period (Twiss et al. Reference Twiss, Wolfhagen, Demirergi, Mulville and Hodder2021). Through much of the sequence at the site cattle are morphologically wild, but with increasing management; definite domestic cattle do not appear until the Late and Final periods and on the West Mound (Wolfhagen Reference Wolfhagen2019; Wolfhagen et al. Reference Wolfhagen, Twiss, Mulville, Demirergi and Hodder2021). There is a wide range of changes in plant and cereal exploitation in the upper levels, including a greater focus on more fertile soils as the site population declined (Bogaard et al. Reference Bogaard, Charles, Filipović and Hodder2021).
The greater independence of individual house buildings after 6500 bce and the wider use of the landscape could be a product of climatic and environmental change (Ayala et al. Reference Ayala, Wainwright, Walker, Hodara, Lloyd, Leng and Doherty2017), but they could also be the result of internal pressures in the Middle period that forced changes in the upper levels. These changes stayed within an egalitarian mode. There is again little evidence that individual buildings in the upper levels were able to sustain inequality and extend it into economic and productive control. Greater household autonomy, dispersal and mobility in a context in which there is greater focus on the building as a productive unit and on economic intensification can be seen as mechanisms that allow a degree of release from overarching collective constraints.
The social and economic organization in the upper levels can be described as constituted from elements that have a degree of autonomy despite the continuation of community-wide obligations. There continues to be evidence of small and moderate sized collective feasts (Demirergi et al. Reference Demirergi, Twiss, Bogaard, Green, Ryan, Farid and Hodder2014) and there are wall paintings of collective rituals associated with the teasing and baiting of animals. But buildings appear to be increasingly focused on house-based production as the importance of the clustered neighbourhood declines (Marciniak et al. Reference Marciniak, Asouti, Doherty, Henton, Hodder and Marciniak2015). The Early and Middle system, on the other hand, had been built up from individual buildings which had much evidence for the daily processing of foods (Bogaard et al. Reference Bogaard, Charles, Filipović and Hodder2021), but these were embedded within complex and powerful overarching processes.
Molar and molecular
In trying to capture the social organizational differences between the lower and upper levels at Çatalhöyük I have found the terms molar and molecular useful. These terms are used very widely, for example in mechanics or in behavioural psychology (Baum Reference Baum2004), in order to emphasize the whole of something (molar) as opposed to its constituent parts (molecular). The terms are also used extensively by Deleuze and Guattari (Reference Deleuze and Guattari1987), who distinguish molar as, for example, unifiable, totalizable, organizable, and molecular as composed of particles (1987, 33; for other definitions, see pp. 40, 41, 45, 213, 216–18, 221, 275; see also Holland Reference Holland2013, 115 and Bogue Reference Bogue1989, 93). The term molar is used here to describe a tendency in Early and Middle phases at Çatalhöyük towards a highly complex and burdensome overlay of demands on the constituent individual units; Deleuze and Guattari (Reference Deleuze and Guattari1987) describe this as ‘over-coding’. These early phases of occupation suggest a version of the molar that is supple rather than rigid, given all the evidence for cross-cutting interactions (Deleuze & Guattari Reference Deleuze and Guattari1987, 213). The term molecular is used here to describe a mode of articulation that allows greater independence and autonomy of parts.
It is important not to conflate these terms with aggregation and dispersal or centripetal and centrifugal; as we have seen, the molecular tendency can result in village-like aggregations just as much as the molar. Equally it is important to distinguish molar and molecular from all the many terms denoting variations in terms of social hierarchy. For example, it could be argued that both the earlier and later organizations at Çatalhöyük represent heterarchical systems as defined by Crumley (Reference Crumley1995, 3). She notes that
heterarchy may be defined as the relation of elements to one another when they are unranked [a notion perhaps applicable to the later levels at Çatalhöyük] or when they possess the potential for being ranked in a number of different ways [perhaps as in the Early and Middle levels where socio-ritual power could be said to be separated from the control of economic resources].
Molar and molecular as used here are terms that refer to modalities of community participation in overarching and burdensome codes rather than to degrees of hierarchy. In the specific case of the Neolithic of Anatolia and the Middle East, I argue that both molar and molecular were used as ways of dampening and counteracting hierarchical tendencies. It is clearly possible for more molar systems to be more or less hierarchical, as it is for molecular tendencies to be more or less egalitarian (for example, Deleuze & Guattari Reference Deleuze and Guattari1987 use the terms to refer to various forms of fascism). In this prehistoric context, I mean the terms molar and molecular to cross-cut the distinction between hierarchical and egalitarian and to argue that the terms were used in a very particular way at Çatalhöyük to counter increased hierarchy. The distinction is thus different from the gumsa/gumlao opposition described by Leach (Reference Leach1973) for highland Burma or Friedman's (Reference Friedman1998) separation of hegemonic from balkanized forms. Because of the focus on burdensome over-coding, the molar/molecular distinction is also different from other terms that focus on whole/part relations such as holistic/atomistic or collective/individualistic.
It should be emphasized that the terms molar and molecular are not used here to refer to distinct types, but to tendencies that vary from the more molar to the more molecular and with each occurring to different degrees and in different ways in each place and time. In considering whether the terms have a value in the Neolithic of the Middle East more widely, I do not expect to find distinct and entirely separate social forms, but they may be helpful terms in seeking an alternative way of discussing social variation in the Neolithic of Anatolia and the Middle East.
A wider pattern
Through much of the Neolithic in the Fertile Crescent, there is a long-term process of increased household autonomy coupled with agricultural intensification. I wish to argue that the interpretation of molar and molecular tendencies at Çatalhöyük may be of relevance to these much longer and earlier sequences throughout the Middle East, at least with regard to debates about increased household autonomy. A hypothesis might be suggested that throughout this area and time period molar and molecular tendencies may have been in play in order to combat rising inequalities.
A candidate for an early molar mode gradually shifting into a more molecular version is Göbekli Tepe, at least as described as a result of new excavations, dates and stratigraphic analyses (Kinzel & Clare Reference Kinzel, Clare, Gebauer, Sorenson, Teather and Valera2020). Coupled with the results of geophysical research, the new mapping (their fig. 3.2) shows that numerous circles were in use at the same time; this was not just a single community, but also a segmented one. Clare and Kinzel (Reference Clare, Kinzel, Gebauer, Sorenson, Teather and Valera2020, 65) suggest that the segments resulted from ‘the agglomeration of people from abandoned settlements’ in the region. Whatever the nature of the circular buildings (Banning Reference Banning2011; Watkins Reference Watkins2005), they suggest an emphasis on balance and radial participation. There are not single central pillars in the circular buildings, but pairs of pillars set within equivalent radial divisions of circular benches, and this radial pattern would appear to extend out into the adjacent agglomeration of buildings (Kinzel & Clare Reference Kinzel, Clare, Gebauer, Sorenson, Teather and Valera2020, fig. 3.2). So there again appears to be a tension between the social differentiation that presumably lay behind the organizational feat to construct the circles and the evidence for multiple circles and their internal ‘communal’ layout (radially segmented benches). Flannery and Marcus (Reference Flannery and Marcus2012, 130) suggest that in relation to the enclosures ‘perhaps each descent group competed with the others’ and that the enclosures ‘brought great renown to the leaders who organized the labor’. We do not know whether the leaders who managed the construction of the enclosures were able to translate their status into the control of production, but there was an overall emphasis on balance, segments and ritual closure. There is debate about how the circles were filled in (Kinzel & Clare Reference Kinzel, Clare, Gebauer, Sorenson, Teather and Valera2020), but the end result was certainly a burying and decommissioning. Through time a rather more molecular articulation emerges. The smaller, surrounding, ‘domestic’ buildings become larger and more rectangular and take over some of the features, such as the T-shaped pillars, of the circles. Certainly by MPPNB some of the circles seem to have gone out of use and been covered by a terrace wall. The early part of the sequence at Göbekli could be described as more molar, in that individual domestic buildings worked within an elaborate symbolic and material framework that must have been burdensome and time-consuming. The labour demands of this ‘over-coding’ may have contributed to a gradual shift to greater house autonomy. The dangers of aggrandizement in relation to the competitive construction of circles may have been countered by a molar and then molecular egalitarianism.
It is now recognized that there are a large number of sites comparable to Göbekli in the upper Euphrates region of southeast Turkey, including Karahan Tepe (Karul Reference Karul2021). These and related sites in the upper Tigris, such as Gusir Höyük and Çemka Höyük (Karul Reference Karul2020; Kodaş et al. Reference Kodaş2020), often have ‘special buildings’ around which settlement seems to grow (Özdoğan & Özdoğan Reference Özdoğan, Özdoğan, Arsebük, Mellink and Schirmer1998). These long-lived buildings often occur in multiples and have circular or subrectangular layouts with radially divided benches set around or in relation to central standing stones, often again in multiples. There are regional differences, such as the higher frequency of carving of symbolic motifs onto the uprights in the upper Euphrates, but there is widespread occurrence of intentional infilling of the circles (Özdoğan Reference Özdoğan2018).
In Syria, tensions similar to those at Göbekli are discernable at Jerf el Ahmar. On the one hand there is much evidence at Jerf el Ahmar of sharing with divisions, of balance and symmetry. In relation to phase II/E, Stordeur (Reference Stordeur2015, 326–7) argues that ‘la symètrie dans ces maisons, sans être absolument rigoureuse, s'impose comme une règle déterminante’. Asouti and Fuller (Reference Asouti and Fuller2013, 321) describe ‘segments’ at the site. At least in some phases the site is divided into two halves. The way the site plan develops, it is as if there are modules of buildings associated with communal buildings; the latter have radial divisions in what is perhaps storage, and there are also what are described as communal food preparation buildings (in II/W). There is a separation of ritual and mundane in the distinction between the communal buildings and other buildings. There is much evidence (Stordeur Reference Stordeur2015) of the burning of buildings, and in my view many of the objects left in abandoned buildings should be seen as abandonment rituals rather than the result of sudden departure. On the other hand, Stordeur also sees some evidence of inequality. She wonders whether the burned building with bull horns in the Middle phase could be seen as a chief's house. She sees some buildings nearer to the communal buildings as more privileged and talks of their ‘authority’ (Stordeur Reference Stordeur2015, 337 & 342). So again the molar focus on balance and symmetry is associated with potential inequality.
There are similar emphases on symmetry and radial division at Mureybet (Cauvin Reference Cauvin1978) and Tell ‘Abr 3 in Syria. Tell ‘Abr 3 also has a separation within buildings between domestic (dirty floors) and sacred (clean floors) (Yartah Reference Yartah2004). Going farther afield in the PPNA, the layout of the special building (O75) at WF16 in Jordan almost looks as if an anthropologist was using the building to explain the rudiments of a classic segmentary society (see diagram figure 43.10 in Mithen et al. Reference Mithen, Finlayson, Maricevic, Smith, Jenkins and Najjar2018). This highly structured communal building contrasts with the domestic architecture. Again here fire seems to have destroyed some buildings. Segmentation in the PPNA is perhaps also seen in the four ‘granaries’ at Dhra’ (if indeed they are granaries: Colledge et al. Reference Colledge, Conolly, Finlayson and Kuijt2018). Kuijt and Finlayson (Reference Kuijt and Finlayson2009, 3) argue that ‘many granaries would have been in use simultaneously’. Interpretation of the overall layout of the PPNA Jericho is difficult given the restricted excavation (Kenyon Reference Kenyon1981), but numerous possible granary structures are associated with the tower and wall that must have been extremely burdensome to complete, and may suggest some organizational hierarchy.
Rather later, in central Anatolia, a similar set of articulations may be observed at Aşıklı Höyük (Özbaşaran et al. Reference Özbaşaran, Duru and Stiner2018). In the early eighth millennium cal. bc in Level 2 the layout of the settlement seems to have small houses within segments, in places radially organized. The term ‘clustered neighbourhoods’ seems appropriate (Düring & Marciniak Reference Düring and Marciniak2006). There is a separation of the sacred and the profane in the physical bounding of the ritual buildings in relation to the domestic buildings. But as noted by Duru (Reference Duru and Hodder2018, fig. 6.1), there are some buildings that tend more frequently to have hearths and burials; these buildings persist through time in long highly structured columns. So some differentiation can be observed in what is otherwise a strongly egalitarian system.
Farther to the east, the later ninth and eighth millennia see the development of PPNB sites in which there is less evidence of burdensome ritual labour, less elaborate codified systems (for the shift to a less elaborate iconography in the PPNB in the northern Levant, see Helmer et al. Reference Helmer, Gourichon and Stordeur2004), and more evidence of molecular aggregations. In the sequence from Nevalı Çori through Çayönü in southeast Turkey, we see the increasing internal elaboration of the house and practices such as infilling and rebuilding in place applied to the domestic context (Erim-Özdoğan Reference Erim-Özdoğan, Özdoğan, Başgelen and Kuniholm2011; Hauptmann Reference Hauptmann, Özdoğan, Başgelen and Kuniholm2011). The Plaza at Çayönü creates a community focus, but it is not highly ritualized or codified. There is an overall focus on the repetition of similar units at Çayönü, but again some degree of hierarchy is evidenced. ‘To the north of the Plaza were the houses of the elite’ (Erim-Özdoğan Reference Erim-Özdoğan, Özdoğan, Başgelen and Kuniholm2011, 190).
The similarities between Çatalhöyük and its contemporaries in northern Levant are often striking. The MPPNB-PN buildings at the 8 ha and long-lasting 11 m high mound at Halula are all very similar to each other, on the same orientation and built on older houses—there can be five to eight structures on top of each other (Kuijt et al. Reference Kuijt, Guerrero, Molist and Anfruns2011) and there are no obvious special buildings. There is no significant variation in the scale of storage from house to house. Burial occurs inside buildings in regular locations, and ‘the number of burials within different houses is not linked to building size’ (Kuijt et al. Reference Kuijt, Guerrero, Molist and Anfruns2011, 517). The aDNA evidence suggests a ‘homogeneous population structure’ (Fernandez et al. Reference Fernández, Ortiz and Torres2008). There are also similarities between Tell Sabi Abyad in northern Syria and Çatalhöyük (Plug et al. Reference Plug, Hodder and Akkermans2022). Despite obvious differences such as the presence of large-scale storage and a long-used cemetery at Sabi Abyad, and while there is continuity of house types, there is much discontinuity both in the rebuilding of individual houses and in the frequent relocation of the settled area (Akkermans Reference Akkermans, Nieuwenhuyse, Bernbeck, Akkermans and Rogasch2013). Frangipane (Reference Frangipane2007) argues that Level 6 at Sabi Abyad, with its seals and storage rooms, suggests an egalitarian redistribution system with different marks for different clans.
Akkermans and Schwarz (Reference Akkermans and Schwarz2003, 61 & 103) argue that the pattern of settlement on the Euphrates in the later eighth and seventh millennia at sites in Syria such as Abu Hureyra, Halula and Bouqras involves regularity, order and conformity in the layout of house construction, and repeated occupation of buildings over hundreds of years (Akkermans et al. Reference Akkermans, Boerma and Clason1983). For Halula, Borrell and Molist (Reference Borrell and Molist2014, 226) suggest that the interacting household ‘formed the basic organizational unit, like the cells form a body’—this phrase captures well the main theme of the molecular, built up from below from the constituent parts. And these are increasingly productive units. In discussing MPPNB-PN Akarçay in southeast Turkey, Özbaşaran and Duru (Reference Özbaşaran, Duru, Özdoğan, Başgelen and Kuniholm2011, 178) suggest that after the EPPNB, sites along the Euphrates like Gritille, Mezraa, Halula and Sabi Abyad II are ‘more domestic in character’. Concomitantly, Özdoğan (Reference Özdoğan, Özdoğan, Başgelen and Kuniholm2011) describes a disappearance of cult buildings in the PN.
For the southern Levant, the PPNB shift to more molecular tendencies is seen clearly at Jericho, where the PPNB is associated with the end of use of the tower and wall (Kenyon Reference Kenyon1981). These structures must have involved much collective labour, perhaps allowing incipient ranking and hierarchy, but they were brought to an end within a PPNB system in which individual house units increased in size and range of functions. Byrd (Reference Byrd1994, 640) argues that ‘household autonomy increased over time’. More generally ‘a progression from relatively undifferentiated oval buildings to more elaborate internally divided rectangular buildings occurred throughout Southwest Asia during the early Neolithic’ (Byrd Reference Byrd1994, 658; see also Garfinkel Reference Garfinkel, Banning and Chazan2006). Goring-Morris and Belfer-Cohen (Reference Goring-Morris and Belfer-Cohen2020, 13) saw a process of increased privatization (see also Bogaard et al. Reference Bogaard, Charles and Twiss2009) based around the nuclear or extended family, and in the PPNB property rights in relation to house, land and animals. At ‘Ain Ghazal in Jordan, Rollefson (Reference Rollefson and Kuijt2002, 184) notes that ‘the size and arrangement of MPPNB architecture suggest that each household was a nuclear family and essentially an independent production and consumption unit’. Finlayson and Makarewicz (Reference Finlayson and Makarewicz2018, 36) put it well: ‘PPNA social organization was based more around the integrated community than individual households’ in that settlements have shared storage, communal architecture and shared food processing, whereas LPPNB Basta and Ba'ja in Jordan have no communal structures (even if they occur at Beidha and ‘Ain Ghazal: Rollefson Reference Rollefson and Kuijt2002). Even if the evidence from Çatalhöyük might throw some doubt on the widespread assumption of a link between buildings and nuclear families, the overall trend towards increased household autonomy seems well established.
Staying egalitarian as an incentive for agricultural intensification
The hypothesis was suggested above that, throughout the PPNA to PN sequence in the Middle East and central Anatolia, molar and molecular tendencies may have been in play in order to combat rising inequalities. A second hypothesis is that tendencies towards more molecular systems increased, at different times and in different ways in different places, partly as a response to constraints associated with more molar tendencies. I argued above that the shift from molar to molecular was associated with evidence of physical stress and disease towards the end of the earlier phases at Çatalhöyük. The molar system allowed balance and reciprocity, but it is burdensome in the provisioning of complex networks. The ‘over-coding’ in terms of symbolic and ritual practices makes demands beyond the exigencies of daily practice. The argument is perhaps most clear in relation to the demands of constructing the Göbekli circles or the Jericho tower, but I have above identified several PPNA sites in which a focus was placed on maintaining balance and sharing. It can be argued, therefore, that there was a long slow transformation from the MPPNB onwards, in which there was a gradual turn to more molecular systems. The latter allowed a continued retention of egalitarian principles by focusing on household autonomy and dispersal.
A third hypothesis is that this shift to molecular autonomy was associated with agricultural intensification. At Çatalhöyük, the upper levels with more independent and larger buildings are associated with an important shift in the degree of dependence on sheep herding and the adoption of domesticated cattle. Looking more broadly over longer periods of time, Asouti and Fuller (Reference Asouti and Fuller2013) have charted the intensification of agriculture through the phases of cultivation and domestication. They show how these processes led to an increase in the input of human labour per unit of managed land. So why would people undertake the harder work of agriculture? One answer is to say ‘because they wanted or needed higher yields’. But why did they want higher yields? There have been many attempts to answer this question in terms of either push or pull arguments (Zeder Reference Zeder2006). The hypothesis suggested here is that the shift towards a molecular tendency that occurred in the MPPNB and onwards in the Levant and Upper Mesopotamia and later in central Anatolia fuelled the process of intensification. Being autonomous depended on more intensive agricultural systems that linked caprine herding and manuring in fixed-plot intensive horticulture (Asouti Reference Asouti, Benz, Gebel and Watkins2017, 25; Kabukcu et al. Reference Kabukcu, Asouti, Pöllath, Peters and Karul2021). Peters, Pöllath and Arbuckle (Reference Peters, Pöllath, Arbuckle and Albarella2017, 256) argue that the transition from EPPNB to MPPNB in southeastern Anatolia saw the completion of the ‘Neolithic barnyard’ with domesticated sheep and cattle integrated into crop-manuring systems and that this ‘fueled the spread of Neolithic technologies within and outside of the Fertile Crescent region’ (2017, 257). I want to add that this economic transition was itself fuelled by the start of a shift to a molecular mode, itself an egalitarian transformation.
As an example of the detail that may lie behind these large-scale processes, Marston (Reference Marston2021) has noted the different labour requirements of hulled versus free-threshing wheats. The spikelets of hulled varieties enable storage, but in order to consume the grains mortars, pestles and baskets are needed; the processing (grinding and cooking) needs to be near the storage. We have much evidence of these activities occurring in close proximity in the houses at Çatalhöyük (Bogaard et al. Reference Bogaard, Charles, Filipović and Hodder2021). Through time, free-threshing naked wheats may have become attractive as they allowed the second winnowing and sieving of grains with all the paraphernalia of mortars, pestles and baskets to be dispensed with. Marston suggests this labour saving may have been desired as greater emphasis was placed on sheep herding and on the independence of house units with an increasing range of activities taking place within them. The use of naked wheats and barley may also have been the result of the impulse towards the molecular and the intent to remain egalitarian.
Conclusions
There has been much ethnographic recognition of different forms of egalitarian society. For example, Moscona et al. (Reference Moscona, Nunn and Robinson2020) make a distinction between segmentary lineage organization characterized by unilineal descent with ancestry traced back to a common, often mythical ancestor, and in which lineage segments function as autonomous groups that come together in larger groups, depending on where threats come from; and village societies in which people attach themselves to a headman, but the group is open, not closed, and individuals and families may join or leave, so that only some people in the group are related. In an ethnographic review of egalitarian societies in West Africa, Dueppen (Reference Dueppen2012) contrasts political systems that foreground descent and segmentation with those that have autonomous villages with heterogeneous populations. These examples capture some of the characteristics of the terms molar and molecular as defined here. I have used these terms in order to allow for the diversity of ways in which distinctions might be drawn, and to propose definitions that respond to the archaeological evidence. I have also wanted to focus on the impulses for change over time.
I have argued elsewhere for a long, slow Neolithic in which humans and things get increasingly entangled, drawing humans into intensifying pathways (Hodder Reference Hodder2018). After years of debate, it seems clear that single-cause explanations for sedentism and agriculture have remained elusive. While long-term processes of climate change and material entanglement played a role, a variety of specific proximate causes were involved at different places and times within a polycentric process (Gebel Reference Gebel2004; Ibáñez et al. Reference Ibáñez, González-Urquijo, Teira-Mayolini and Lazuén2018). Some role for social and ritual factors has long been argued (e.g. Bender Reference Bender1978; Cauvin Reference Cauvin2000; Hayden Reference Hayden1990). In this paper I have suggested that remaining egalitarian may have been another causal factor. The evidence suggests a continual tension between various forms of hierarchy and egalitarian principles. Initially more molar solutions were often sought, at times leading to impressive outpourings of creative ingenuity, as at Göbekli, Jericho, and at many PPNA sites. Before the development of intensive integrated agriculture, these systems allowed egalitarian principles to be pursued through community sharing and notions of nested balance between parts. But creating and regulating the superstructures or over-determined codings for these systems was often demanding, leading to a shift towards greater autonomy of individual units and more focus on fragmentation and dispersal. Fuelling this process was intensification. The fully developed domestication of plants and animals in the PPNB and onwards emerged within the drive towards egalitarianism and allowed the pursuit of more molecular tendencies.
Although the sequence at Çatalhöyük has stimulated the hypotheses proposed here, the site itself is a hybrid of the trends identified more widely. As noted above, it has many of the characteristics of other Late Neolithic sites such as fully developed agriculture, very large size and lack of specialized cult buildings. On the other hand, it is the first large-scale community in the Konya Plain after Pınarbaşı and Boncuklu (Baird et al. Reference Baird, Fairbairn and Martin2017), and the small sizes of the houses and the symbolic repertoire are more reminiscent of PPNA sites in the northern Levant (Helmer et al. Reference Helmer, Gourichon and Stordeur2004). It went through a sequence that reprised and was part of larger-scale trends, but in a distinctive local fashion. The tensions between egalitarian and hierarchical were played out in different ways at different times throughout the Neolithic of the Middle East, leading to diverse variants of what has been termed here the molar and the molecular. Çatalhöyük in its local setting perhaps recapitulated wider trends, but in its own distinctive way, contributing to the polycentric variability which is a feature of early agriculture, sedentism and dispersal in the Neolithic of the Middle East (Gebel Reference Gebel2004; Ibáñez et al. Reference Ibáñez, González-Urquijo, Teira-Mayolini and Lazuén2018).
Acknowledgements
I am very grateful to two anonymous reviewers as well as Ted Banning and Ian Kuijt for their critical comments on an earlier draft. I am also indebted to the many people whose research at Çatalhöyük is referred to in this article, or who have worked on the project over its duration, and to its sponsors. Both team members and sponsors are listed at www.catalhoyuk.com.