Introduction
Natural selection is the process of preservation of genotypes among organisms that increases their chances of survival, procreation and multiplication from generation to generation at the expense of less advantageous ones. Evolution often occurs as a consequence of this process. Natural selection may arise from differences in (1) survival, (2) fertility, (3) rate of development, (4) mating success, or (5) any other aspect of the life cycle. All such differences result in natural selection to the extent that they affect the number of progeny an organism leaves.
The problem of measuring the intensity of natural selection directly in human populations was solved by Crow (Reference Crow1958) with his ‘index of opportunity for natural selection’. This enabled change in fitness to be measured using specific birth and death rates. Thus ‘natural selection’ is the relative probability of survival and reproduction of the genotype. Only when a certain variability of this fitness is present in a population does natural selection occur. In human populations the relative reproductive success of different genotypes depends on the total number of offspring that each couple leaves to the next generation (Jacquard, Reference Jacquard1969). However, natural selection does not only operate through differential fertility; the existence of differential survival of descendents up to reproductive age also determines biological fitness (Reddy et al., Reference Reddy, Chopra and Malhotra1987; Lasker & Kaplan, Reference Lasker and Kaplan1995). Crow's index of opportunity for natural selection merely sets an upper limit on the amount of selective opportunity that can exist in any particular population; it would only measure actual selection if the heritability of fitness were complete and if birth and death rates were totally determined by genetic factors (Jorde & Durbize, Reference Jorde and Durbize1986).
Despite this limitation, Crow's index has been widely used in human populations, because it allows indirect quantitative estimation of the selection inherent in the evolutionary process simply on the basis of the demographic statistics of birth and death rates (Terrenato et al., Reference Terrenato, Ulizzi and San Martini1979; Hed, Reference Hed1987; Reddy & Chopra, Reference Reddy and Chopra1990; Kapoor et al., Reference Kapoor, Kshatriya and Kapoor2003; Alfonso-Sanchez et al., Reference Alfanso-Sanchez, Calderon and Pena2004). The study of secular trend, a covariate of Crow's index, and its implications provides a new dimension to understand the evolution and process of transition going on in a population. No such study has been done among the Indian population. The present study therefore aimed to calculate the secular trend of Crow's index and its implications among the Indian population. The study could be a model for other research into the predictors of Crow's index in any population.
The study area and people
India is the second largest country in the world with a population of more than one billion. It is also a very diverse country, with many religions, sects, castes and tribes. Economically and socially, India has made great strides since Independence, and social legislation has done much to alleviate inequalities between higher castes and ‘untouchable’ castes, tribes and non-tribes, men and women and other deprived segments of society.
The rigid caste hierarchy is an empirical feature of Indian Hinduism, with Brahmins at the top enjoying their priestly occupation. Kshatriyas and Vaishyas are in the middle position as fighters (as well as rulers) and businessmen respectively, whereas the Scheduled Castes (SCs) are placed at the lower end of the social stratum. Many of the SCs are still treated as ‘untouchable’. Though untouchability has been abolished by law (Singh, Reference Singh1999), it still exists among Hindus, particularly in rural areas. In 1931, the Commissioner of Census identified criteria for the classification of depressed classes and prepared a list of those suffering from serious social and political handicap on account of their degraded position in Hindu society. Accordingly the Indian Franchise Committee passed an order to the Provincial Government of the State to prepare a list of depressed classes under the banner of ‘scheduled castes’ (Mandal et al., Reference Mandal, Datta, Guha, Mukherjee and Ghatak2005). The President of India declared some indigenous groups in various pockets of India as Scheduled Tribes on 26th January 1950 under Article 342 of the Constitution of India. A brief description of the studied population follows:
Scheduled tribes (STs)
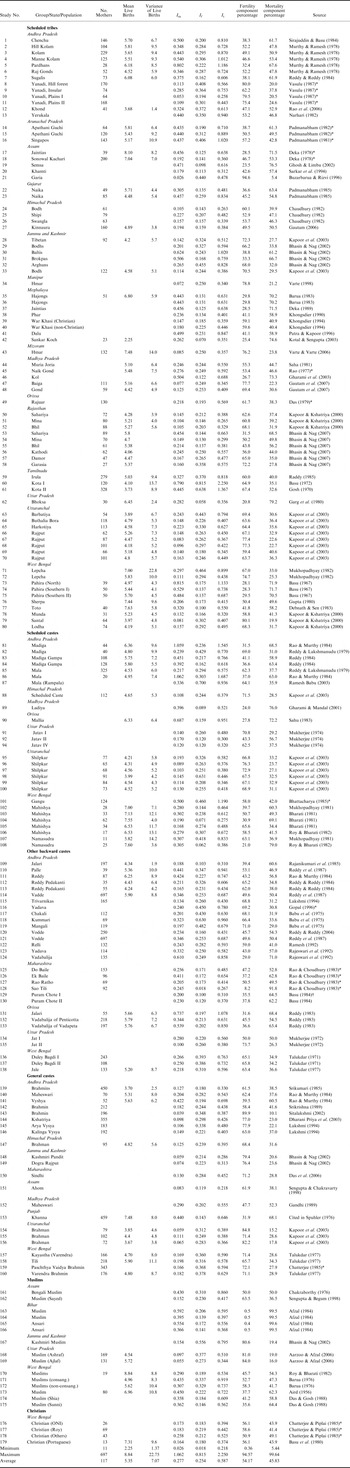
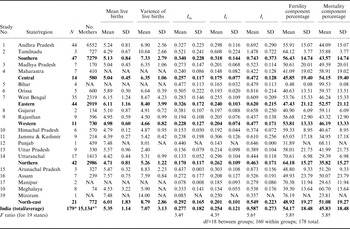
The Census of India (1991) enumerated more than 500 tribal groups in India, making up 8.08% of the total population (1.028 billion). Of these, 74 were identified as primitive tribes. These Primitive Tribal Groups (PTGs) are characterized by pre-agricultural level of technology, forest-based economy, extreme poverty, a low level of literacy and a stagnant population. Altogether 80 studies on tribal groups of different ethnic stock are included in the present study, and state-wise details are shown in Table 1. It is apparent that these tribal groups belong to divergent geo-climatic set-ups and different religious persuasions. The socio-cultural variations among tribes are also extreme. The north-eastern states are inhabited by the matrilineal, matriarchal Khasi (Table 1, Study Numbers (S.Nos) 39 and 40) and Jantia (S.No. 37), whereas at the other extreme there are the polyandrous and patriarchal Kota (S.Nos 60 and 61) of the southern states of Tamilnadu and Kinnaura (S.No. 27) of Himachal Pradesh (northern state). Out of 80 tribal groups taken into account in the present study, some are primitive tribes such as Baiga, Sahariya and Kathodi.
Data on Crow's indices of opportunity for natural selection for Indian populations

* Source: Reddy & Chopra (Reference Reddy and Chopra1990).
† Cited in Sirajuddin & Basu (Reference Sirajuddin and Basu1984).
Scheduled castes (SCs)
There are 499 communities classified as scheduled castes. Their total population has been enumerated as 138.223 million, or 16.33% of the total population of the country (Census of India, 1991). They are economically poor and socially deprived as ‘untouchable’ and this situation still prevails in the 21st century. In Indian history and literature, they are described as Shudra (4th or lowest verna of Hindu caste hierarchy), Achhoot (untouchables), Dalit (depressed), Harijan (people of God) and so on. Often they are treated as sub-human beings, even like domestic animals. They are forced by the ‘upper’ castes to follow many social stigmas. Generally their hamlets are in the outskirts of villages. They live in extreme poverty and illiteracy, with only about a third (30%) being literate. Special provision has been made in the Indian constitution for their safety and development, but still their condition is worst. Even in towns they are placed into slums. They practise a varied range of occupations: some are leather-workers, some are artisans and many work as agricultural or daily wage labourers. The present analysis includes 28 studies on scheduled castes from different states.
Other backward castes (OBCs)
In caste hierarchy these are above those from the scheduled castes and tribes. Also, they are socially, economically and politically more affluent and dominate over the SCs and STs. But OBCs are below the general castes, who are at the top in all aspects. In the present analysis, 30 studies are on OBCs. Cultivation is their primary occupation. They are good traditional farmers and hard labourers. Besides agricultural practices, they also earn their livelihood through daily wages. Some are reliant on other kinds of occupations for their subsistence.
General castes
A total of fourteen castes included in the present study are considered as general castes. In the Hindu caste hierarchy these occupy the uppermost position. They have been socioeconomically sound and politically dominant since historical times. They occupy an advantageous position in all arenas of life. Some of them are forerunners in business e.g. Sindhi. This whole group is socially, economically and politically affluent and dominates Indian society and polity.
Muslims
The Muslim population are distributed throughout the country. Their total population is approximately 138.188 million; more than half are illiterate (Census of India, 2001a). Of those considered as literate, the majority have attained a very low level of education (5th or 7th standard). Mostly they live in urban or suburban areas. Economically, they are poor by and large. They are engaged in a wide range of occupations from labourers to owners of factories, mechanics to engineers, small traders to industrialists. They have no caste in the real sense of the term. They are divided into classes and many sub-classes; but in some regions and states casteism too can be seen (e.g. in Bihar and Uttar Pradesh). The main two sections of Muslims are the Shias and Sunnis (Basu et al., Reference Basu, Mukherjee, Dutta, Bose, Basu and Ghosh1994). They have a very glorious past as they established kingdoms, and India is still known for its glorious heritage (Taj Mahal and Red Fort) left by the Mughal Emperors. In the pre-Independence era, especially during Mughal rule, the lower caste Hindus converted to Islam. In the present analysis, fifteen studies on Muslims from five states are included.
Christians
In the present investigation, four studies on Christians of West Bengal are taken into account. There are some tribes and castes that pursue Christianity, but these are included either in scheduled caste or tribes. In general, Christians are quite well educated, and most of them converted from scheduled castes and tribes. Indian Christian society is divided into groups, geographically and according to denomination, but the overriding factor is one of caste. Caste groups may dine together and worship together, but, as a rule, they do not intermarry. Thus Indian Christians often form castes or endogamous bodies analogous to castes. They sometimes are even admitted to temples to which untouchable Hindus have no entrance. The problem of reconciling change in religious belief with existing social tradition has dominated the history of Christianity in India.
Methods
The data for the present investigation are taken from 179 studies on opportunity for natural selection, conducted among 144 different endogamous communities in nineteen states and six geographical regions categorized into six social groups, viz. scheduled tribe (80), scheduled caste (28), other backward caste (30), general caste (22), Muslim (15) and Christian (4). These studies appeared across 33 years between 1956 and 2007. (Note that in the 51-year period from 1956 to 2007 there were no studies in some of the years, so data were available for 33 of the 51 years; for details see Table 4.) These data were collected from 89 sources, most of them published; some are in the process of being published or are still unpublished.
The total number of mothers included in these studies was more than 15,134 (Tables 1, 2, 3 and 4). The data on the socio-demographic profile of the states were taken from the National Family Health Survey (NFHS-2) 1998–99 (2000), Census of India (2001b) and Government of India (2002).
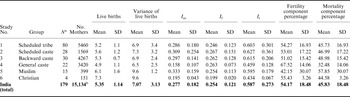
Mean and SD of mortality (I m), fertility (I f) and total selection intensity (I t) components for the Indian population by social group

a N stands for number of populations studied in each religious/social group.
b For 49 populations (out of 179) the number of mothers was not available; therefore the exact number of mothers is more than the figure shown here.
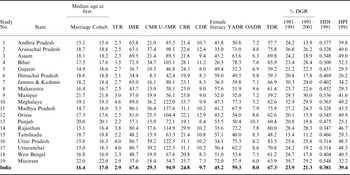
Firstly, the data from different sources were entered into specially designed and validated MS-Excel worksheets. The year of publication or submission (in the case of unpublished theses or reports) was considered as the year of study. This measure was adopted to reduce the extent of error as in many studies the year of study was not mentioned. In most cases there was a 4–8 year difference in the year of study and its publication or submission. The population characteristics, i.e. age at marriage, age at first cohabitation, total fertility rate (TFR), infant mortality rate (IMR), child mortality rate (CMR), under-5 mortality rate (U-5MR), crude birth rate (CBR), crude death rate (CDR), female literacy, young age dependency ratio (YADR), old age dependency ratio (OADR), total dependency ratio (TDR), decadal growth rate or DGR (1981–91 and 1991–2001), human development index (HDI) and human poverty index (HPI), were not available for individual studies and communities, so against the individual Crow's index values, the values of above-stated socio-demographic variables for the state were entered. The state-wise values of these variables are presented in the Table 6. Furthermore, the dependency ratios (YADR, OADR and TDR) were calculated using census data (Census of India, 2001a). After editing, the Excel worksheet was converted into an SPSS data file for further analysis, tabulation and regression.
The index of opportunity for natural selection, or Crow's index (I t), was calculated following Crow (Reference Crow1958) as below:

where

and

Here, I m=index of opportunity for natural selection due to pre-reproductive mortality (mortality from birth to reproductive age, i.e. below 15 years); I f=index of opportunity for natural selection due to fertility; x=average number of live births per women aged 45 years and above who have completed their reproductive life span; V f=variance (average deviation from mean) of number of live births; P d=proportion of pre-reproductive deaths; P s1=proportion of survivors from birth to reproductive ages.
The proportion of pre-reproductive deaths (P d) is calculated from children ever-born to mothers aged 45 years and above (who have completed their fertility) and pre-reproductive deaths, as given below:

The proportions of survivors were calculated by subtracting P d from 1, as given below:

Values for the Human Development Index (HDI) and Human Poverty Index (HPI) were obtained from National Human Development Report 2001 of Planning Commission (Government of India, 2002). Regarding calculation of HDI, Gautam (Reference Gautam2007) may also be referred to.
Results
The indices of fertility (I f), mortality (I m) and total selection (I t), along with number of mothers, mean and variance of live births, and fertility and mortality component percentages, are presented in Table 1. It is evident that I t varies from 0.218 for the Muslims of Assam to 2.250 for the Kota tribe of Tamilnadu. As I t is the outcome of the multiplication of the fertility and mortality indices, the relative contributions of the two components are computed as percentages. The fertility component thus varies from 0.36% for the Muslims of Bihar to 94.6% for the Garia (a scheduled tribe) of Assam.
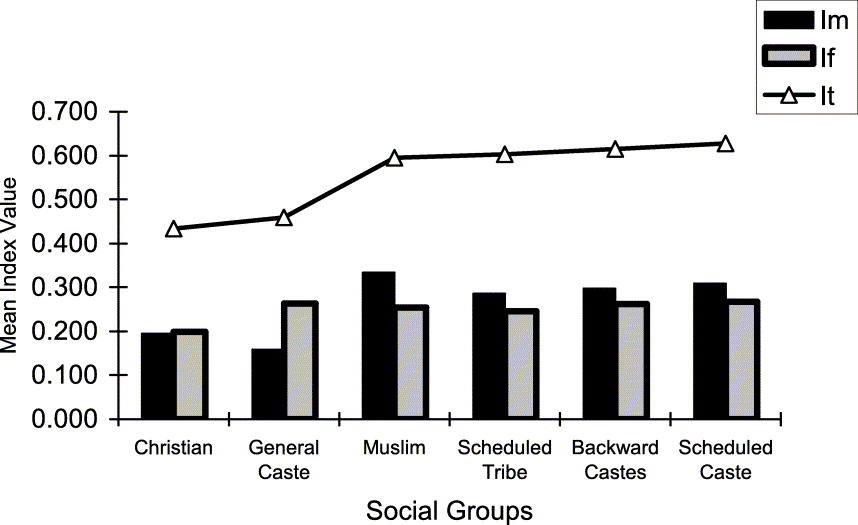
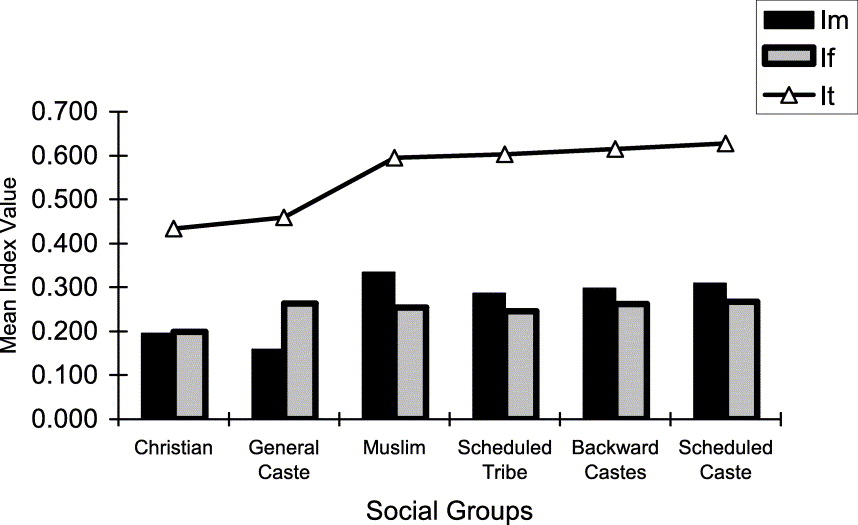
An inter-social group comparison of I t is presented in Table 2. It is highest for the scheduled castes (0.627), followed by backward castes (0.615), scheduled tribes (0.603), Muslims (0.595), general castes (0.469) and Christians (0.437). Further, it is apparent from the comparisons of fertility and mortality indices that the mortality component is higher than the fertility component among Muslims, scheduled tribes, scheduled castes and backward castes; however, the fertility component is higher than the mortality component among general castes and Christians (Fig. 1).
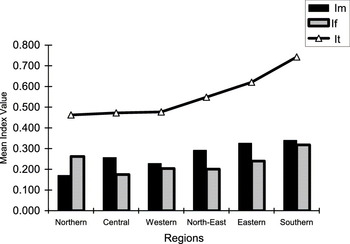
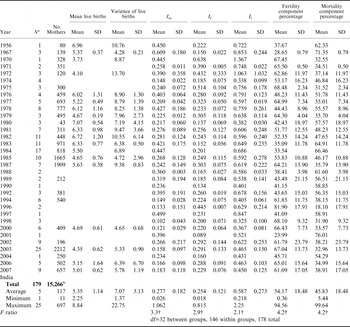
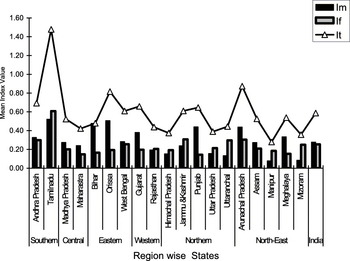
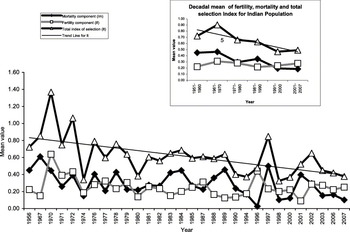
The inter-regional comparison in Table 3 and Fig. 2 shows that I t increases from north to south and from west to east. The inter-state comparison in Fig. 3 indicates that in most states the mortality component is higher than the fertility component. Table 4 presents the year-wise means and standard deviations of I f, I m, I t, live births, variance of live births, fertility and mortality component percentages, along with the number of studies per year and total number of mothers in that year. Figure 4 shows the secular trend of I t across 33 years between 1956 and 2007, which are further grouped into six periods in the inset. The trend line clearly shows a declining trend in I t. In addition, of the 179 populations, 84 (46.92%) had a higher mortality index than fertility index. This tendency was prominent up to the 1990s: of the 108 populations studied up to 1990, 71 (65.74%) were found to have a higher index of mortality than index of fertility, whereas after 1990, of these 71 populations, only fifteen (21.12%) had a higher mortality component than fertility. The decadal graph gives a clear picture of transition: after 1990 the mortality index fell below the fertility index resulting in a declining trend in the fertility, mortality and total selection indices (Fig. 4, inset).
Inter-regional comparisons of fertility, mortality and total index of selection among Indian populations.
Inter-state comparisons of fertility, mortality and total index of selection among Indian populations.

Mean and SD of mortality (I m), fertility (I f) and total selection intensity (I t) component for the Indian population by state and region

a N stands for number of population groups studied per state/region.
b For 49 populations (out of 179) number of mothers was not available; therefore exact number of mothers is more than the figure shown here.
NA=not available;
* Asterisk-marked values are totals; the rest are averages.
† Significant at 1% level.
Mean and SD of mortality (I m), fertility (I f) and total selection intensity (I t) components for the Indian population by year

a N stands for number of population groups studied in that particular year.
b For 49 populations (out of 179) number of mothers was not available; therefore exact number of mothers is more than the figure shown here.
† Significant at 1% level.
Yearly and decadal mean fertility, mortality and total index of selection among Indian populations.

Inter-social-group comparisons of fertility, mortality and total index of selection among Indian populations.

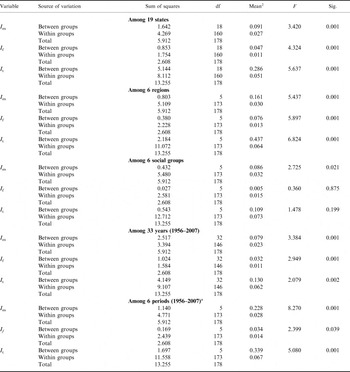
The F ratio indicates the extent of variation among states (Table 3). There is significant variation for the populations of different states in I m (F=3.4), I f (F=4.3) and I t (F=5.6). To find out the secular trend for the Indian population as a whole, the available studies were grouped year-wise as presented in Table 4. Here, the F ratio indicates the extent of variation, across the time span, of I m (F=3.3), I f (F=2.9) and I t (F=2.1). It is apparent that the variation for these indices is higher between states than across the years. Among states, I t has most variation, followed by I f then I m, whereas across the years the variation is higher in I m followed by I f then I t.
In Table 5, one-way ANOVA analysis for I m, I f and I t is presented for the nineteen states, six regions, equal number of social/religious groups and decadal period, and for 33 years. It is apparent that the variation in I f and I t among different social/religious groups is insignificant, whereas significant variation is found for I m. The extent of variation is significantly higher among populations of different regions, than between states. In the same way, the magnitude of variation is significantly higher among the studies of different decadal periods than the years. Again, the dimension of variation of I m is greater during the last six decades as compared with I f.
One-way-ANOVA for mortality index (I m), fertility index (I f) and total selection index (I t) among nineteen states, six regions, six social group, six decadal period and 33 years

a Periods: 1951–1960, 1961–70, 1971–80, 1981–90, 1991–2000, 2001–2007.
Population characteristics and socio-demographic variables by state

Sources: NFHS-2 1998–99 (2000); Census of India (2001); Government of India (2002).
TFR=Total fertility rate, IMR=Infant mortality rate, CMR=Child mortality rate, CBR=Crude birth rate, CDR=Crude death rate, YADR=Young age dependency ratio, OADR= Old age dependency ratio, TDR=Total dependency ratio, HDI=Human Development index, HPI= Human Poverty index, DGR=decadal growth rate.
Fertility and mortality are two opposing processes of population dynamics, which are regulated by a number of factors. For further elucidation the state-wise socio-demographic features and population characteristics are presented in Table 6. The median age of first marriage for women varies from 14.7 years in Madhya Pradesh to 22 years in Mizoram, whereas the age at first cohabitation is found to be lowest for women of Andhra Pradesh (15.4 years) and highest for Mizoram (22 years); in the same way, the median age of first marriage and cohabitation for Indian women was estimated as 16.4 and 17 years respectively. The total fertility rate (TFR) and crude birth rate (CBR) were found to be highest for Meghalaya (4.6 and 35.7 respectively), whereas the lowest TFR was estimated for Himachal Pradesh (2.1) and the lowest CBR was found for Punjab (19.1). For India TFR and CBR were found to be 2.9 and 24.8 respectively. To illustrate the scenario of mortality in the country, the state-wise details of four measures, namely CDR, CMR, U-5MR and IMR, are considered: these are estimated to be 9.7, 29.3, 94.9 and 67.6 respectively for the Indian population, though each of these indicators varies from state to state. As shown in Table 6, the CDR varies from 7.3 in Mizoram to 12.9 in Orissa. The lowest CMR (8.3) was recorded for Himachal Pradesh and the highest CMR (56.4) was found for Madhya Pradesh, whereas the highest U-5MR was found in Uttar Pradesh and Uttaranchal (122.5) and the lowest for Himachal Pradesh (42.4). In the same way, the variation in IMR can be seen for the nineteen states: it was lowest in Himachal Pradesh (34.4) and highest in Meghalaya (89.0). Here, it should be noted that the lowest values for CDR, CMR, U-5MR and IMR are recorded for Kerala, one of the southern states of India (6, 2.6, 18.8 and 16.3, respectively).
For female literacy, the north-eastern state of Mizoram is marching ahead with 72% of women being literate. On the other hand, in Bihar state only 26.3% of the female population are literate, although for the total Indian population the female literacy rate is estimated to be 45.2% (Census of India, 2001a).
To understand the population structure, its diversity and growth, and to find out their correlation with selection intensity indices, three measures of population structure, viz. young age dependency ratio (YADR), old age dependency ratio (OADR) and total dependency ratio (TDR), were calculated from the 2001 census data. In the same way the percentage decadal growth during two inter-censuses, i.e. 1981–1991 and 1991–2001, was considered for further analysis. It is apparent from Table 6 that YADR varies from 78.3 in Bihar to 40 in Tamilnadu, whereas it is estimated to be 59.3 for the total Indian population. On the other hand, the OADR for the Indian population is found to be 8.0, and is highest for Punjab state (10.1) and lowest for Arunachal Pradesh (4.8). The sum of YADR and OADR is known as TDR, which varies from 48.2 in Tamilnadu to 85.9 in Bihar, although it is 67.3 for the total Indian population.
The percentage decadal population growth rate for the total Indian population during 1991–2001 is estimated to be 21.3%; its comparison with 1981–1991 shows that it declined by two and a half per cent. With the exception of four states (i.e. Bihar, Gujarat, Manipur and Uttar Pradesh), in the rest of the nineteen states the percentage decadal growth rate declined during 1991–2001 as compared with 1981–1991. Further, in three states (Andhra Pradesh, Arunachal Pradesh and Mizoram) it declined by more than 10%.
The human development index and human poverty index for India are, respectively, 0.381 and 39.4; these vary from 0.308 for Bihar to 0.548 for Mizoram and 25.1 for Punjab to 52.3 in Bihar, correspondingly.
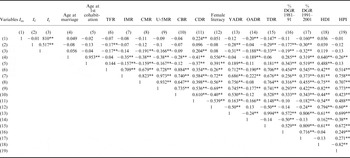
Table 7 shows the Pearson correlation computed for I t, I f, I m and socio-demographic variables (reported for the respective states). It is apparent that most of these variables are significantly correlated with each other, but I m is significantly correlated with only four variables (besides I t), viz. CDR, OADR, TDR and percentage decadal growth rate during 1991–2001. The correlation is positive only with CDR, whereas it is negative with the other three, which infers that an increase in the value of these variables (OADR, TDR and decadal growth rate) will result in a decline in the probability of death of survivors (up to reproductive age). It is natural that if the probability of death declines, the growth rate of a population will increase. In the same way, an increase in OADR means an increase in life expectancy, which will reduce the probability of deaths in that population (especially pre-reproductive death). Total dependency ratio (TDR) is the sum of YADR and OADR, so if I m increases the TDR will decrease due to deaths of young dependants, as the TDR and YADR have a high degree of significant positive correlation (r=0.99). Like I m, I f also has a significant inverse correlation with five variables (besides I t), viz. TFR, YADR, TDR and decadal growth rates (1981–1991 and 1991–2001). The total index of selection (I t) has a significant correlation with eleven variables (including I m and I f); of these, only CDR has a positive correlation with I t.
Correlation metrics of I m, I f, I t and socio-demographic variables

* Significant at 0.05 level;
** significant at 0.01 level (2-tailed).
See footnote to Table 6 for definition of abbreviations.
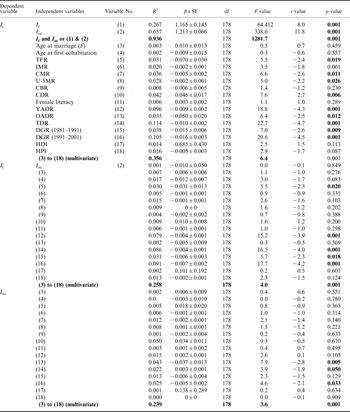
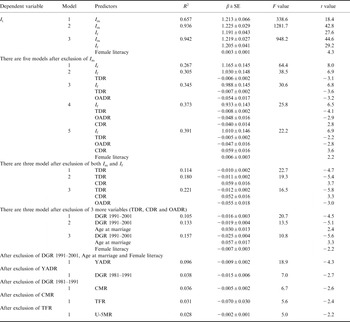
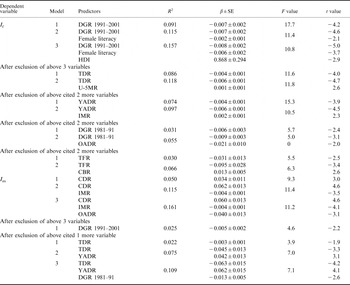
Linear bivariate, linear multivariate and stepwise multivariate regression analyses were computed (Tables 8, 9 and 10). It is evident that I m accounts for the highest variability among the selected variables, amounting to 65.7% of the variability (R 2=0.657) in I t. Next is I f, which accounts for 26.7% of the variability (R 2=0.267) in I t. The two components together account for 93.6% of the variability (R 2=0.936) in I t. Besides I m and I f, sixteen socio-demographic variables (S.Nos 3–18) are taken into consideration. Of these, nine are found to have a significant correlation with I t: TDR, DGR 1991–2001, YADR, CDR, TFR, CMR, U-5MR, OADR and DGR 1981–1991, which account for 11%, 10%, 9%, 4%, 3.1%, 3.6%, 2.8%, 3.5% and 3.8% variability respectively. Furthermore, all of these sixteen socio-demographic variables together account for 35.6% of the variability in I t (Table 8). The stepwise regression analysis (Table 9) provides three models for eighteen predictors of I t. According to the first model it is determined by I m only, which accounts for 65.7% of variability (R 2=0.657). The second model says that there are two predictor of I t, i.e. I m and I f. In the third model, in addition to I m and I f there is third predictor of I t, i.e. female literacy. So, out of sixteen socio-demographic variables selected for analysis, only female literacy is found to be an important predictor of I t. However, if I m is excluded from the analysis the scenario changes. Now it gives five models, according to which there are five predictors of I t, viz. If, TDR, OADR, CDR and female literacy (see Table 9). Again, if both I m and I f are excluded from the analysis, it gives three model according to which the predictors are TDR, CDR and OADR. In this way, one by one, the variables are removed from the analysis and new predictors with different model come into the vista and finally only five variables remain, viz. age at first cohabitation, CBR, IMR, HDI and HPI, which do not show any correlation with I t, and are excluded from analysis as they are entered.
Bivariate (linear) and multivariate regression between I t, I f, I m and other demographic variables

See footnote to Table 6 for definition of abbreviations.
The same exercise is done to find out the best predictors of I f and I m (Table 10). The analysis for I f is started with seventeen variables; firstly it gives three models with three predictors, namely DGR 1991–2001, female literacy and HDI; when these three predictors are removed, there are two models, according to which there are two predictors (TDR and U-5MR). If these two variables are removed, the predictors are YADR and IMR. Again, when these two predictors are removed the DGR 1981–91 and OADR remain as predictors. And, finally it gives two models according to which the predictors are TFR and CBR. Lastly, when these two variables are removed, the rest of the variables are excluded automatically. In the same way the analysis for I m is started with sixteen predictors; firstly it gives three models with three predictors CDR, IMR and OADR; when these are removed from the analysis, it gives one model with the predictor DGR 1991–2001. Again, when this predictor is removed, it gives three models with three predictors (TDR, YADR and DGR 1981–91); when these are removed from the analysis, none of the rest of the variables remains as a predictor; they are excluded automatically as they are entered.
Here it should be noted that decadal growth rate (DGR) is basically the outcome of a selection process operating in the Indian population. Hence the correlation and regression analyses between DGR and I t/I f/I m should be seen vice-versa (Table 8, 9 and 10). Although, the DGR is considered as an independent variable it is a dependent phenomena so the correlation and regression analysis between GDR and I t, I f and I m may be seen conversely.


Contrary to the presumed hypothesis, the correlation between the human development index (HDI), human poverty index (HPI), selection index (I t) and its components (I f and I m) is insignificant, although the rest of the variables are found to have a moderate to high degree of significant correlation with HDI except the decadal growth rates. In the same way, the HPI is also found to have a significant correlation with all the variables, including decadal growth rates, but excluding age at marriage.
Finally, it should be noted that there is a discrepancy in the data from the point of view of representation, as some of the years are presented only by a single study, based on 80 to 100 mothers. The same is true for states. Because of these limitations, it is only possible to show the significance in some of the important statistical processes. Also, the data for socio-demographic variables were not available for every year, so cross-sectional data for states are considered in the analysis, which further hampers its relevance. Due to these limitations HDI and HPI do not show any significant correlation. Yet, female literacy has emerged as one of the important predictors of I t during the course of multivariate stepwise regression analysis, which is also one of the components of HDI and exhibits a significant correlation with all the fertility and mortality indicators included in the present investigation.
Discussion
This study focused on the opportunity for natural selection among contemporary Indian populations. Crow's index and its components seem to be closely related to changes in the socioeconomic and cultural structure of Indian society, which have evidently changed people's attitudes towards reproduction. The demographic transition (radical shift in human reproduction), which started in the late 19th century in Europe (Brogerhoff Mulder, Reference Brogerhoff Mulder1998, p. 266, and Alfanso-Sanchez, Reference Alfanso-Sanchez, Calderon and Pena2004), can be witnessed in the Indian population from the 1990s onward. In the pre-transitional stage, the opportunity for natural selection was mainly determined by differential pre-reproductive mortality (I m), whereas in the post-transitional stage differential fertility (I f) plays a key role. Population transition has had a significant quantitative and qualitative effect on the amount of selective opportunity among the Indian population. These effects can be summarized firstly as a marked reduction in total selection (I t) and in the mortality component (I m) during the 1970s onwards, and secondly, a reversal in the roles of differential mortality (I m) and fertility (I f) on I t from 1990, bringing about a qualitative change in terms of increasing relative contribution of I f to I t. Both these characteristics seem to be the result of a marked decrease in infant mortality rate (IMR) and child mortality rate (CMR). As evident from regression analysis, there is significant correlation between I t and child mortality (CMR and U-5MR); similarly between I f and infant and child mortality (IMR and U-5MR); and between I m and IMR (Tables 9 and 10).
The most obvious cause of the pattern of variation in I m, I f and I t and their considerable decrease after 1970 is the chronology of the reduction in pre-reproductive mortality, for various reasons. For example, the invention and universal use of antibiotics after 1950 followed by the invention of a series of anti-bacterial/viral/protozoan/fungal drugs that reduced the mortality/morbidity due to communicable and non-communicable diseases such as tuberculosis, typhoid, tetanus, kala-azar, mumps, worm infestation, leprosy, dengue, malaria, pneumonia, diarrhoeal diseases, cholera and asthma. Malaria has received specific attention since 1958, smallpox (a leading cause of death) was eradicated in 1977, the ‘green revolution’ facilitated the booming population and reduced fatality due to starvation (although malnutrition has remained widespread), and access to safe drinking water has increased, reducing deaths due to water-borne diseases. Also, India's medical and public health services have improved dramatically since the 1950s. Apart from numerous programmes directed against specific diseases, there has been a considerable expansion in the number of government-maintained hospitals and rural primary health centres. Welfare services have proliferated in number and type, and many programmes have been targeted at specific sections of the population, such as scheduled castes, scheduled tribes, nomadic populations, women, children and the disabled. The implementation of maternal and child health programmes has improved maternal health care, from conception to delivery. Mothers are encouraged to have pre-natal check-ups, immunization, supplementary nutrition and institutionalized delivery. Further, through universal immunization programme, the majority of infants and children are immunized against the major killer diseases, resulting in a radical reduction in infant and child deaths, and eventually pre-reproductive deaths.
The bivariate correlation metrics clearly show that there is strong correlation between fertility and mortality indicators (i.e. TFR, CBR, IMR, CMR, U-5MR). The decreasing trend in mortality at early ages is also a major factor in explaining changes in population fertility, because pre-reproductive mortality is considered a major determinant of the regulation of human fertility (Stinson, Reference Stinson1982; Chandran, Reference Chandran1989; Feeney, Reference Feeney1994; Mace, Reference Mace1998).
The populations included in this investigation were studied in different periods of time, are from different backgrounds, and belong to divergent geo-climatic and socio-cultural milieu. They were at different stages of development; some were still at the pre-industrial stage, and some were even at the pre-agricultural stage, but even so they were all participating in the demographic transition. In industrial societies like those of Europe, urbanization and modernization have accelerated the reduction in mortality risk at early ages and generated a way of life in which children are expensive enough to discourage most parents from having large families (Alfanso-Sanchez, Reference Alfanso-Sanchez, Calderon and Pena2004). This is also true for many urbanized Indian societies.
In the new socioeconomic scenario, the concept of birth control has changed notably; modern post-transitional populations engage in systematic conscious control of marital fertility through family limitation methods, which is a logical consequence of a changing parental demand for children. Thus, among the Indian population too, the voluntary and non-biological limitation of birth has become the largest contributor to the fertility component (I f) of the total selection index (I t). In addition, birth control is imposed on some tribes and scheduled castes, or at least they are encouraged to limit their family size. The author's experience among the Baiga (a primitive tribe of central India), Kinnaura (a polyandrous tribe from the Himalaya), Dhodia (a tribe of Gujarat), Nicobarese (a tribe of Andaman and Nicobar Islands), Mehra and Chamar (scheduled caste of Central India) suggests that these communities are compelled to be sterilized (by vasectomy/tubectomy). It can be easily imagined that if these populations are compelled others may not be exempted. Tribes or scheduled castes are given the benefit of government programmes (like bank loans, subsidies and land ownership) if they adopt family planning (vasectomy/tubectomy) and limit family size to two children. Also, early marriage is restricted by law, and the age at marriage has been made mandatory. Marriage before 18 and 21 years, respectively, for females and males is constitutionally illegal and punishable (although not implemented strictly). Simultaneously, female education is promoted in various ways, such as free education up to 14 years of age, free stationery/books/dress/bicycle (specifically for some rural and tribal areas)/mid-day meal, provision of scholarships and so on. In the same way, women are promoted for higher education and employment, which is also evident from increased female literacy. It was merely 7.9% in 1951, but gradually increased to 45.2% according to the Census of India 2001 (Registrar General & Census Commissioner of India, 2001). In this way, besides a reduction in mortality (infant and child), strong cultural change, compulsion, educational reform and employment chances of women have played a greater role in their reproductive behaviour. The progressive increase in women's education and employment has led to delayed maternity (Breart, Reference Breart1997; Ulizzi et al., Reference Ulizzi, Astolfi and Zonta1998; Astolfi et al., Reference Astolfi, Ulizzi and Zontas2000; Alfonso-Sanchez et al., Reference Alfanso-Sanchez, Calderon and Pena2004). Several tribal groups in India have followed a similar trend (Basu et al., Reference Basu, Kshatriya and Jindal1988; Bhasin & Kshatriya, Reference Bhasin and Kshatriya1990; Kapoor & Kshatriya, Reference Kapoor and Kshatriya2000). They have also emphasized the role of improved public health conditions and awareness.
In the context of the relative contribution of fertility and mortality components to total selection, there has been a gradual change over time. Earlier the mortality index was higher, but after 1990 there was a radical shift. Before 1990 in 65.74% of cases the mortality index was higher than fertility, whereas after 1990 only in 21.12% of studies was the mortality index higher; in 78.88% cases the index of fertility was found to be higher. This is an important observation and contrary to the observation of Reddy & Chopra (Reference Reddy and Chopra1990) for the Indian population and Spuhler (Reference Spuhler and Zubro1976) for world data, but a similar trend was noticed by Kapoor et al. (Reference Kapoor, Kshatriya and Kapoor2003) among 24 Himalayan populations of Asian affinity.
The total index of selection (I t) and fertility index (I f) have been found to have a low degree of inverse correlation with the dependency ratios (i.e. YADR, OADR and TDR), whereas the mortality index (I m) was found to have a positive correlation with YADR and TDR. In this context it should be noted that the negative correlation between mean live births and I t and I f has already been established for the world, Indian and Himalayan data by Spuhler (Reference Spuhler and Zubro1976), Reddy & Chopra (Reference Reddy and Chopra1990) and Kapoor et al. (Reference Kapoor, Kshatriya and Kapoor2003). Since fertility indicators (TFR and CBR) are negatively correlated with I t and I f, it is obvious that TDR and YADR would be inversely correlated with I t and I f. Although before analysis it was hypothesized that there should be positive correlation between I t and TDR, because TDR is exceedingly (99.4%) determined by YADR, and whereas YADR has a significant positive correlation of moderate to high degree with all the fertility and mortality indicators (TFR, IMR, CMR, U-5MR, CBR and CDR), it implies a negative correlation between I t and TDR, I t and YADR, I f and TDR, and I f and YADR.
Conclusion
It is clear from the above discussion that since the mid-1950s India has seen an improvement in standard of living that has led to the control of population dynamics, specifically fertility and mortality. Before 1990 the major contributor to the process of selection among Indian populations was mortality (pre-reproductive death), but since 1990 differential fertility has played a vital role in selection. The secular trend in the selection index (I t) indicates that it declined continually with relative and radical changes in its contributors I f and I m, and this phenomenon will further continue as the demographic and epidemiological transition proceed. As environmental or exogenous factors (epidemics) are already controlled or being controlled, the selection resulting from differential mortality will depend increasingly on strictly endogamous (genetically determined) factors. If genetic diseases such as sickle cell anaemia and thalassaemia are not tackled, this may constrain the goal of achieving a lower index of selection. Also, childhood obesity and life-style diseases, which can be major causes of childhood mortality, may increase. Furthermore, to achieve the minimal value of selection index, which has already been done by some developed countries, identified regions and groups need to receive special attention in the form of welfare, development, education and health care programmes. Scheduled castes, other backward castes, scheduled tribes and Muslims must be given special focus. In the same way, BIMARU states (Gautam Reference Gautam2007), viz. Bihar, Madhya Pradesh, Assam, Rajasthan and Uttar Pradesh, along with the three ‘daughter’ states Jharkhand, Chhattisgarh and Uttaranchal, should be targeted separately and specifically.