1 Introduction
Scholars from a variety of fields have worked on improving the automatic classification of individual objects (where the unit of interest might be a web page, war, person, document, country, social media post, etc.). Social scientists use classifiers too, but they more often focus on aggregate generalizations about populations of objects, such as the percent in each category, rather than any one individual classification, a task that is sometimes called “quantification.”Footnote 1 Indeed, a plausible case can be made that one of the defining characteristics of social science is a focus on population-level generalizations. We discover an interesting puzzle about one election, but try to develop theories that apply to many more. We are interested in the politics of one country, but attempt to understand it as an example of how all countries (or all democracies, or all developing countries, etc.) operate. We survey 1,500 Americans about their political attitudes, but seek to understand how all Americans, or all people, form attitudes. Quantitative social scientists usually leave it to historians or intensive qualitative researchers to analyze particular speeches supporting a policy and focus instead on the percent of all speeches that support the idea.
Applying a simple “Classify-and-Count” approach yields accurate category percentages under a perfect classifier. Perfect classifiers are unrealistic in real applications (Hand Reference Hand2006), but they are unnecessary for aggregate accuracy if individual-level errors cancel. However, choosing a classifier by maximizing the percent correctly classified can sometimes increase the bias of aggregate quantities, unless the one is careful in training the classifier. For example, the decision rule “war never occurs” accurately classifies country-year dyads into war/no war categories with over 99% accuracy, but is misleading for political science research.
Similarly, the proportion of email you receive that lands in your spam folder is a biased estimate of the percent of spam you receive overall, because spam filters are tuned to the fact that people are more annoyed when they miss an important email than when some spam appears in their in-box. This is easy to fix by tuning your spam filter to avoid the bias, or correcting after the fact, but we usually do not know the classifier’s bias. For example, a method that classifies 60% of documents correctly into one of eight categories might be judged successful and useful for classification. For example, if Google or Bing were to provide relevant results in 60% of searches (which is about the 2019 average empirically), we might be quite satisfied, since the low cost of misclassification is to merely choose another search term and try again. However, because the individual category percentages can then be off by as much as 40 percentage points, the same classifier may be less useful to the social scientist interested in learning about aggregate behavior.
The tasks of estimating category percentages (quantification) or classifying individual documents (classification) both begin by analyzing a small subset of documents with (usually hand-coded) category labels. Classification methods normally require these labeled and unlabeled document sets to be drawn from the same population, so the class probabilities can be calibrated. Commonly, however, the labeled set is created in one time period and a sequence of unlabeled sets are collected during subsequent time periods, each with potentially different distributions. For example, scholars may hand-label a set of social media posts about a presidential candidate into the 10 reasons people do or do not like this person. Then, for each day after the hand coding, a researcher may try to estimate the percent of posts in each of these categories using the initial hand-labeled set, with no new coding of documents. The methods of quantification we discuss here are designed to accommodate these situations even though these are the circumstances where the assumptions behind classification methods are violated.
We build on the only nonparametric quantification method developed for estimating multicategory proportions that does not resort to individual classification as a first step. This methodology was developed in King and Lu (Reference King and Lu2008) with survey research applications in public health, and in Hopkins and King (Reference Hopkins and King2010) with applications to text analysis in political science; and it was extended in King, Lu, and Shibuya (Reference King, Lu and Shibuya2010) and King et al. (Reference King, Pan and Roberts2013, Appendix B), with a U.S. Patent issued for the technology (King, Hopkins, and Lu Reference King, Hopkins and Lu2012). Over 2,000 scholarly articles in several scholarly fields have cited these works (according to Google scholar). The method has come to be known by the name “readme,” which is the widely used open-source software that implements it (Hopkins et al. Reference Hopkins, King, Knowles and Melendez2013).
We begin by developing the intuition behind readme’s nonparametric methodology, and highlight situations where it can be improved. We then outline an approach for improving performance via two techniques, both of which involve better representing the meaning of the text. First, our technique allows for changes in the meaning and use of language over time by adapting matching techniques developed from the causal inference literature. Second, we develop an algorithm that chooses a feature space to discriminate between categories with as many nonredundant or independent features as possible.Footnote 2
We summarize the readme estimator and its assumptions in Section 2. Section 3 then introduces our new methodology. In Section 4, we compare our approach to readme in out-of-sample empirical evaluations in 19,710 datasets, derived from subsets of 73 corpora (and repeated with 18 different evaluation protocols). We discuss what can go wrong and how to avoid it in Section 5. Our approach will not necessarily perform better in every dataset (the “ping pong theorem” applies here too; Hoadley Reference Hoadley2001), but in unusually extensive empirical tests, we find it normally outperforms other approaches in real data, under the real-world conditions we describe below. Section 6 concludes; proofs, simulations, illustrations, and other supporting information appear in Appendices A–D in the Supplementary Material.
2 Readme: Estimation without Classification
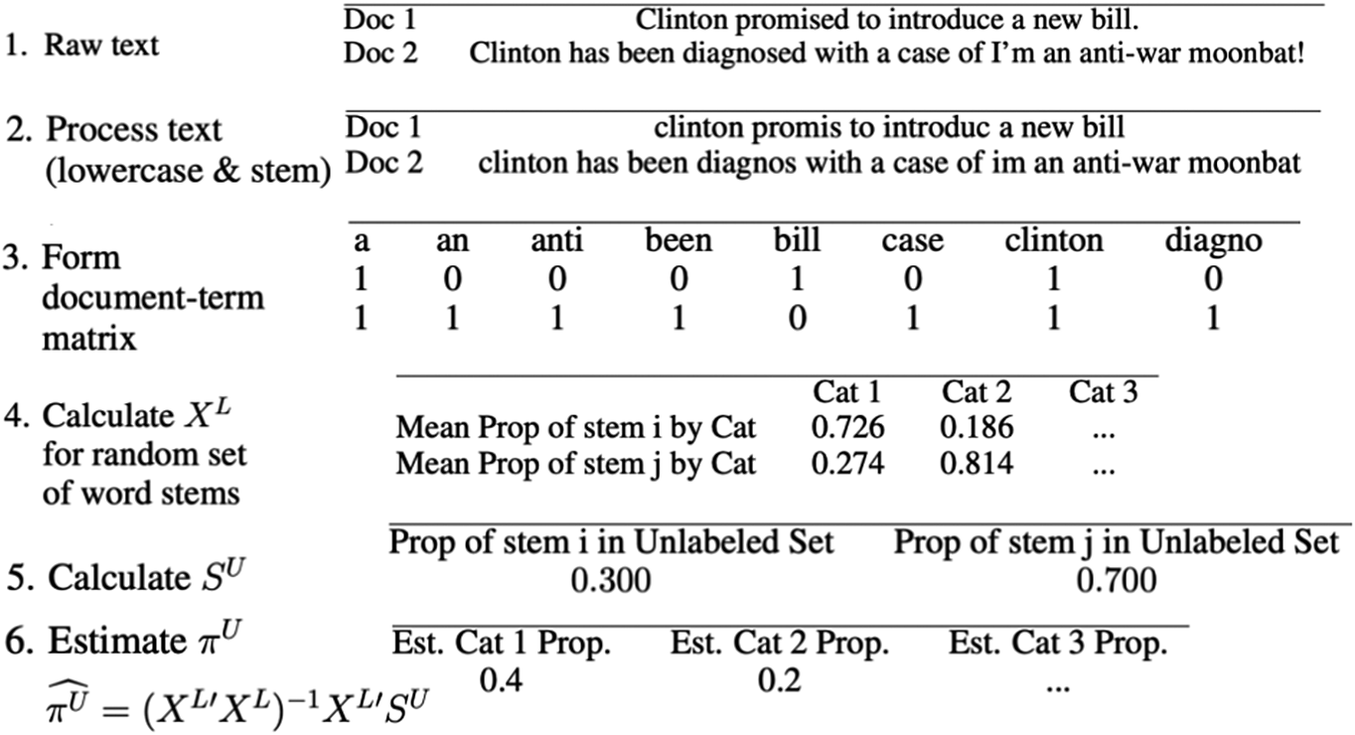
We now describe readme, laying the groundwork for our subsequent improvements. Figure 1 gives a schematic summary that may help guide the discussion as we introduce each component.
Summary schematic of readme.

2.1 Notation
Consider two sets of textual documents—L, which includes
 $N^{\text {L}}$
documents labeled with a category number, and U, which includes
 $N^{\text {U}}$
unlabeled documents—where
 $N=N^{\text {L}}+N^{\text {U}}$
. When there is no ambiguity, we use i as a generic index for a document in either set and N as a generic description of either set size. Each document falls into category c in a set of mutually exclusive and exhaustive categories (
 $c\in \{1,\dots ,C\}$
), but the category label is only observed in the labeled set. We write
 $D_i = c$
to denote that document i falls into category c. Denote
 $N_c^{\text {L}} = \sum _{i=1}^{N^{\text {L}}} \mathbf {1}(D_i = c)$
as the number of documents in category c in the labeled set,
 $N^{\text {U}}_c$
as the (unobserved) number in c in the unlabeled set, and
 $N_c$
generically for either set in category c.
The proportion of unlabeled documents in category c is
 $\pi ^{\text {U}}_c=\operatorname {mean}_{i\in U}[\mathbf {1}(D_i = c)]$
(where for set A with cardinality
 $\#A$
, the mean over i of function
 $g(i)$
is
 $\operatorname {mean}_{i\in A}[g(i)]=\frac {1}{\#A}\sum _{i=1}^{\#A}g(i)$
). The vector of proportions
 $\pi ^{\text {U}}\equiv \{\pi _1^{\text {U}},\dots ,\pi _C^{\text {U}}\}$
, which represents our quantity of interest, forms a simplex, that is,
 $\pi ^{\text {U}}_c \in [0,1]$
for each c and
 $\sum _{c=1}^C \pi _c^{\text {U}} = 1$
. We also define the analogous (but observed) category proportions for the labeled set
 $\pi ^{\text {L}}$
.
2.2 Text to Numbers
In this first step, we map the entire labeled and unlabeled corpora, with the document as the unit of analysis, into a constructed space of textual features with the definition of the rows (taking the place of the unit of analysis) a choice to be optimized. Many ways of performing this mapping can be created; we propose one optimized for quantification. For readme, Hopkins and King (Reference Hopkins and King2010) begin with a set of k unigrams, each a binary indicator for the presence (coded 1) or absence (0) of a chosen word or word stem in a document. The number of possible strings of these zeros and ones, called a word stem profile, is
 $W=2^k$
.
The readme approach then computes a
 $W\times 1$
feature vector, denoted
 $S^{\text {L}}$
, by sorting the labeled documents into the W mutually exclusive and exhaustive word stem profiles, and computing the proportion of documents that fall in each. To make the definition of
 $S^{\text {L}}=\{S_w^{\text {L}}\}$
more precise and easier to generalize later, begin with the
 $N^{\text {L}}\times W$
document-feature matrix
 $F=\{F_{iw}\}$
with rows for documents, and columns for features which in this case are unique word stem profiles. Each element of this matrix,
 $F_{iw}$
, is a binary indicator for whether document i is characterized by word stem profile w. Then, elements of
 $S^{\text {L}}$
are column means of F:
 $S_w^{\text {L}}=\operatorname {mean}_{i\in L}(F_{iw})$
. Then, the same procedure is applied, with the same word stem profiles, to the unlabeled set, which we denote
 $S^{\text {U}}$
.
We also define a
 $W\times 1$
conditional feature vector as
 $X_c^{\text {L}}=\{X_{wc}^{\text {L}}\}$
, which results from the application of the same procedure within category c in the labeled set, and
 $X_c^{\text {U}}=\{X_{wc}^{\text {U}}\}$
within category c in the unlabeled set (
 $X_c^{\text {U}}$
is unobserved, because c is unknown in the unlabeled set). These can be computed from
 $F^c$
, a document-feature matrix representing only documents in category c. We then collect these vectors for all categories into two
 $W\times C$
matrices,
 $X^{\text {L}}=\{X_1^{\text {L}},\dots ,X_C^{\text {L}}\}$
and
 $X^{\text {U}}=\{X_1^{\text {U}},\dots ,X_C^{\text {U}}\}$
, respectively.
2.3 Assumptions
We require two assumptions. First, because the unlabeled conditional feature matrix
 $X^{\text {U}}$
is unobserved, Hopkins and King (Reference Hopkins and King2010) assume
 $$ \begin{align} X^{\text{L}}=X^{\text{U}}. \end{align} $$
Although Assumption 1 is quite restrictive, we can relax it. Begin by supposing that the documents in L are drawn from the same distribution giving rise to U—which is equivalent to the assumption necessary for individual classification.Footnote 3 It turns out we can relax this further: in readme, we could assume that the conditional distribution of features given categories is the same, which is much less restrictive. But we go even further and avoid specifying the full probabilistic model entirely by assuming only that the conditional expectation is the same, or in other words that the labeled conditional feature matrix is an unbiased estimator of the unlabeled conditional feature matrix. That is, we replace Assumption 1 with:
 $$ \begin{align} E(X^{\text{L}}) = X^{\text{U}}. \end{align} $$
Second, we must assume that matrix
 $X^{\text {L}}$
is of full rank, which translates substantively into (a) feature choices with
 $W>C$
and (b) the lack of perfect collinearity among the columns of
 $X^{\text {L}}$
. Assumption (a) is easy to control by generating a sufficient number of features from the text. Assumption (b) is only violated if the feature distributions in documents across different categories are identical, which is unlikely with a sufficient number of coded documents. (We prove below that high but not perfect collinearity, which can result if categories are weakly connected to the features or documents are labeled with error, can exacerbate the bias of the readme estimator.)
2.4 Estimation
Our goal is to estimate the vector of unlabeled set category proportions
 $\pi ^{\text {U}}=\{\pi _1^{\text {U}}, \dotsc , \pi _C^{\text {U}}\}$
given
 $S^{\text {L}}$
,
 $S^{\text {U}}$
, and
 $X^{\text {L}}$
. Begin with an accounting identity (i.e., true by definition),
 $ S_w^{\text {U}} = \sum _{c=1}^C X_{wc}^{\text {U}}\pi _c^{\text {U}},\; \forall \; w$
, or equivalently in matrix form:
 $$ \begin{align} S^{\text{U}}=X^{\text{U}}\pi^{\text{U}}, \end{align} $$
which is a linear regression, but where the linearity is a property rather than assumption. Then, readme estimates
 $\pi ^{\text {U}}$
by the least-squares estimator
 $$ \begin{align} \widehat{\pi^{\text{U}}} = (X^{\text{L}^{\prime}}X^{\text{L}})^{-1}X^{\text{L}^{\prime}}S^{\text{U}} \end{align} $$
(or a modified version that explicitly preserves the simplex constraint).Footnote 4
2.5 Properties
In the classic errors-in-variables linear regression model, with random measurement error only in the explanatory variables, least squares is biased and inconsistent. However, in readme, the dimensions of
 $X^{\text {L}}$
remain fixed as
 $N^{\text {L}}$
grows, and so Assumption 2 also implies measurement consistency:
 $\lim _{N^{\text {L}}\to \infty } X^{\text {L}} = X^{\text {U}}$
. This means that the readme estimator in Equation (4), which is also a linear regression with random measurement error in the explanatory variables, is statistically consistent: as we gather and code more documents for the labeled set (and keep W fixed, or at least growing slower than n), its estimator converges to the truth:
 $$ \begin{align*}\lim_{N^{\text{L}}\to\infty}\widehat{\pi^{\text{U}}} = \lim_{N^{\text{L}}\to\infty}(X^{\text{L}^{\prime}}X^{\text{L}})^{-1}X^{\text{L}^{\prime}}S^{\text{U}}=(X^{\text{U}^{\prime}}X^{\text{U}})^{-1}X^{\text{U}^{\prime}}S^{\text{U}}=\pi^{\text{U}}.\end{align*} $$
This is a useful result suggesting that, unlike classic errors-in-variables, labeling more observations can reduce bias and variance. It also suggests that, to improve readme, we should focus on reducing finite sample bias rather than consistency, which is already guaranteed.
3 Improvements
We outline issues that affect readme’s performance conceptually in Section 3.1 and analyze them mathematically, along with proposed solutions, in Section 3.2.
3.1 Issues to Address
Readme is affected by three issues that arise in practice. First is a specific type of “concept drift” (Gama et al. Reference Gama2014) that we refer to as semantic change—the difference in the meaning of language between the labeled and unlabeled sets. Authors and speakers frequently morph the semantic content of their prose to be clever, get attention, be expressive, curry political favor, evade detection, persuade, or rally the masses. For these or other purposes, the content, form, style, and meaning of every symbol, object, or action in human language can always evolve.
We address two types of semantic change that impact readme: emergent discourse, where new words and phrases, or the meanings of existing words and phrases, appear in the unlabeled set but not the labeled set, and vanishing discourse, where the words, phrases, and their meanings exist in the labeled set but not the unlabeled set. “Russian election hacking” following the 2016 U.S. presidential election is an example of emergent discourse, language which did not exist a few years before, whereas “Russian Communism” is an example of vanishing discourse, a usage that has been disappearing in recent decades. However, emergent and vanishing discourse can reverse their meanings if the researcher swaps which set is labeled. For example, in analyzing a large historical dataset, a researcher may find it more convenient to read and label a contemporary dataset and infer to the historical datasets (e.g., as they are recovered from an archive); to label documents at the start of the period and infer to subsequent periods; or to code a sample spread throughout the period and to infer to the full dataset. Either vanishing or emergent discourse can bias readme, but only if such discourse is present in a specific way (we describe below) across the categories.
Second is the lack of textual discrimination, where the language used in documents falling in different categories or across features is not clearly distinguishable. For clarity, we divide textual discrimination into two separate concepts that, in the readme regression, are related to the minimal requirement in least squares that, to reduce variance and model dependence, X must be of full rank and, ideally, far from degeneracy. Since X represents categories as variables and features of the text as rows, we refer to these two variables as category distinctiveness (CD) and feature distinctiveness (FD), respectively.
The lack of textual discrimination may arise, because the conceptual ideas underlying the chosen categories or features are not distinct. Hand coding errors can also lead to this problem, which is commonly revealed by low levels of intercoder reliability. The problem can also occur because of heterogeneity in how authors express information or a divergence between how authors of the documents express this information and how the analyst conceptualizes the categories or codes the features. Also common is where the analyst begins with distinct and well-defined conceptual definitions for the set of C categories, with examples of documents that fall unambiguously into each one, but where it turns out upon large-scale coding that large numbers of documents can only be described as falling into multiple categories. Adding categories to represent these more complicated expressions (so that the resulting set is still mutually exclusive and exhaustive) is a logical solution, but this step often leads to a more cognitively demanding hand-coding problem that reduces intercoder reliability.
A final problematic situation for readme occurs due to interactions with the other two problems. This issue is proportion divergence, when the category proportions in the labeled set (
 $\pi ^{\text {L}}$
) diverge from those in the unlabeled set (
 $\pi ^{\text {U}}$
). To understand this issue, consider a dataset with massive semantic change and no textual discrimination—so the document texts are largely uninformative—but where
 $\pi ^{\text {L}}\approx \pi ^{\text {U}}$
, such as when the labeled set is a random sample from the unlabeled set. In this situation, readme will return the observed proportion vector in the labeled set,
 $\pi ^{\text {L}}$
, which is a good estimate of
 $\pi ^{\text {U}}$
. This means that we can sometimes protect ourselves from semantic change and the lack of textual discrimination by selecting a labeled set with a similar set of category proportions as the unlabeled set. This protective measure is impossible to put into practice in general, as it requires a priori knowledge of category membership, but it can be useful in some cases when designing training sets, and we show below that it can be corrected for.
3.2 Analytical Solutions
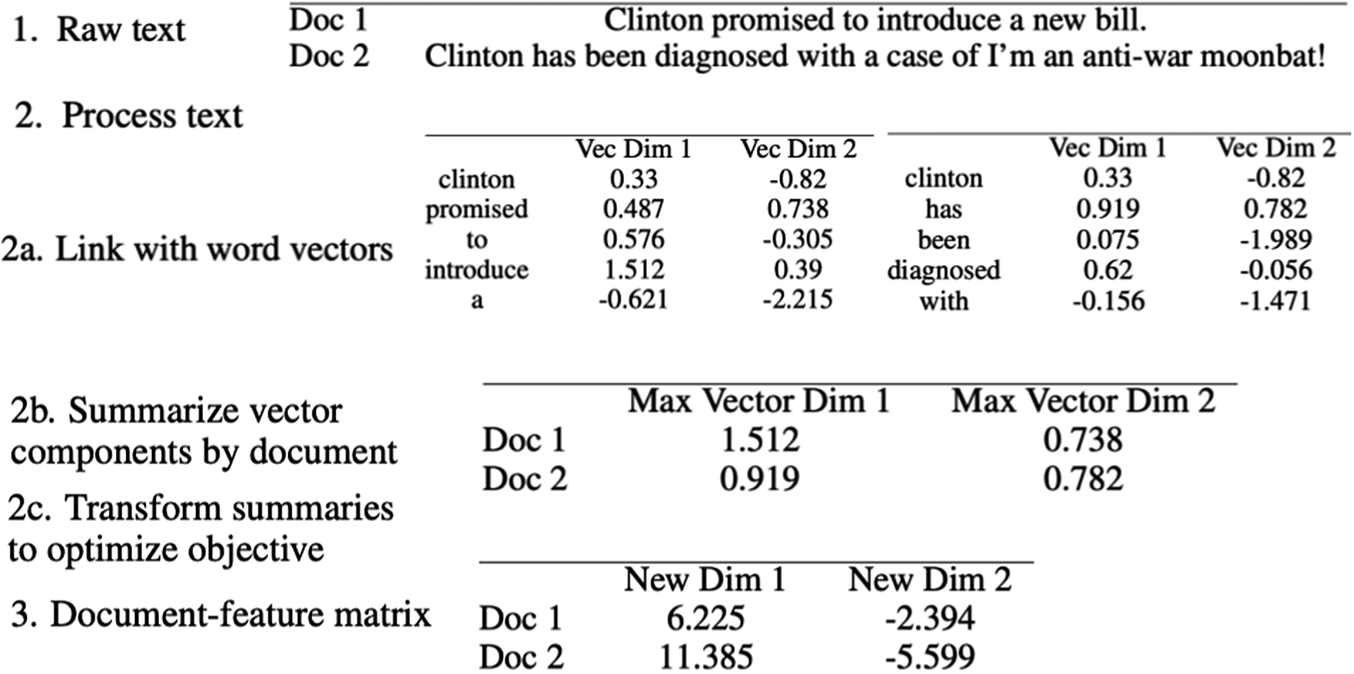
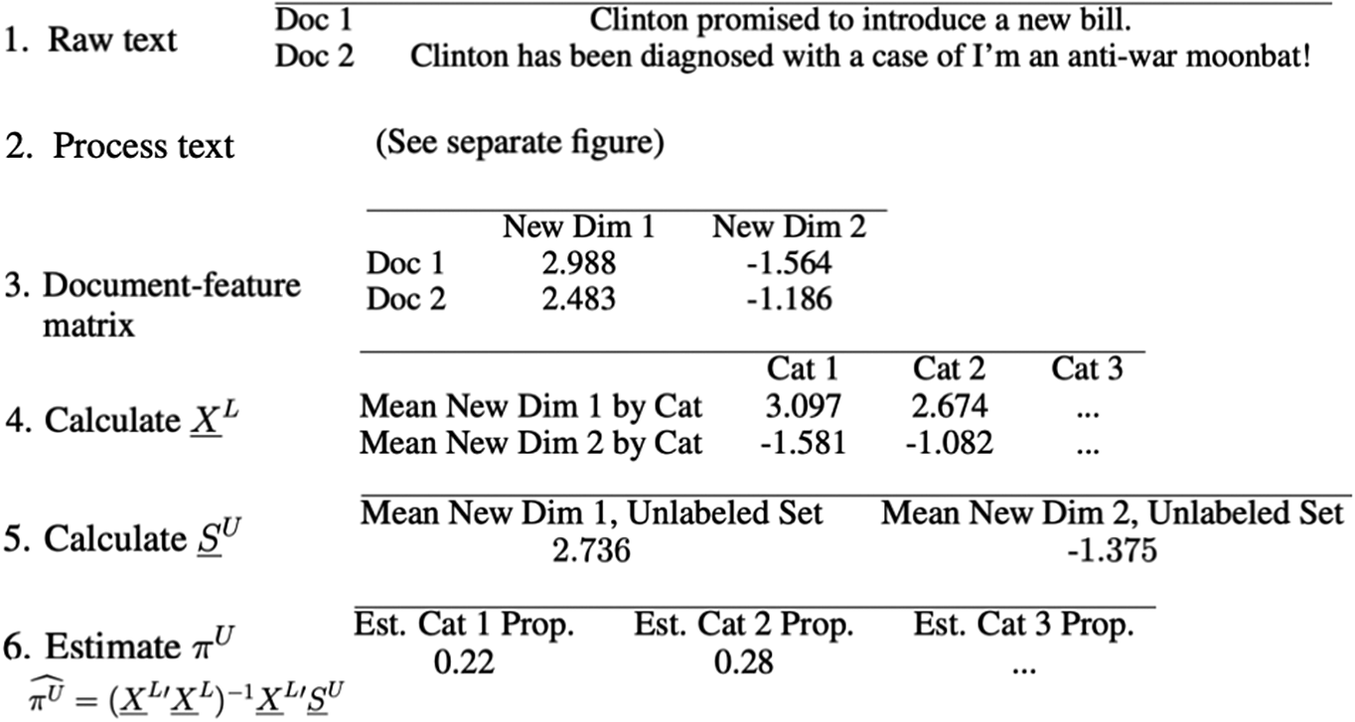
We now propose improvements to readme, including (1) a dimension reduction technique for direct estimation of category proportions (analogous to techniques that have been used for improving classifier performance; e.g., Brunzell and Eriksson Reference Brunzell and Eriksson2000; Vincent et al. Reference Vincent, Larochelle, Lajoie, Bengio, Manzagol and Bottou2010) and (2) an adaptation of matching methods for causal inference. (We also show in Appendix D in the Supplementary Material how the methods developed here may have uses in the causal inference literature.) Figure 2 gives a schematic summary of step (1), and Figure 3 summarizes the whole algorithm including step (2).
Summary schematic of the quantification-targeted text processing in readme2.

Summary schematic of readme2. See Figure 3 for details of step (2). The matching step is done prior to the formation of
 $\underline {X}^L$
.

3.2.1 Dimension Reduction
Dimension reduction is especially important here, because numerical representation of text documents can have an outsized impact on the results (see Denny and Spirling Reference Denny and Spirling2018; Levy, Goldberg, and Dagan Reference Levy, Goldberg and Dagan2015). The idea behind our dimension reduction approach is that even if large numbers of individual features perform poorly, lower-dimensional linear combinations of features may do considerably better. We begin with the
 $N\times W$
document-feature matrix F defined in Section 2. Our goal then is to project this matrix to a lower-dimensional
 $N\times W^{\prime }$
document-feature matrix
 , where
 $\Gamma $
is a
 $W \times W^{\prime }$
matrix of transformation weights defined below and
 $W'\ll W$
. Once we obtain
 , we can take conditional expectations of the features given the category labels to generate the readme regression matrix as before. We denote conditional regression matrix obtained from
 as
 , in parallel to notation F and X.Footnote 5
The key question, then, is how to define
 $\Gamma $
to choose among the many possible lower-dimensional
 matrices and thereby reduce readme’s bias? To answer this question, we develop intuition by studying readme’s bias in simplified data with only two categories. Because of the simplex constraint, the unlabeled set category proportions can then be characterized by a single parameter,
 $\pi ^{\text {U}}_1$
. The accounting identity for each feature mean w,
 $S_w^{\text {U}}$
, can be written as
 $S_w^{\text {U}} = X_{w2}^{\text {U}} + B_w^{\text {U}}\pi ^{\text {U}}_1$
, where
 $$ \begin{align} B_w^{\text{U}}=X_{w1}^{\text{U}} - X_{w2}^{\text{U}} \end{align} $$
quantifies the systematic component of textual discrimination between the two categories. The readme estimator is then the least-squares estimator of
 $\pi ^{\text {U}}_1$
(see Appendix A in the Supplementary Material for proofs of all propositions in this section).
Proposition 1. The two-category readme estimator is
 $$ \begin{align*} \widehat{\pi^{\text{U}}_1} = \frac{\sum_{w=1}^W B_w^{\text{L}}\left(S_w^{\text{U}} - X_{w2}^{\text{L}}\right)} {\sum_{w=1}^W (B_w^{\text{L}})^2}. \end{align*} $$
If
 $X^{\text {L}} = X^{\text {U}}$
, the above expression equals
 $\pi ^{\text {U}}_1$
and readme is unbiased. We can relax this assumption by making Assumption 2, which we express as
 $X_{wc}^{\text {L}} = X_{wc}^{\text {U}} + \epsilon _{wc}$
, where
 $\epsilon _{wc}$
is a random variable with mean zero and variance inversely proportional to
 $N_c$
. We then write the readme estimator in terms of
 $X^{\text {U}}$
, the true unlabeled set category proportion
 $\pi _1^{\text {U}}$
, and the sample category size
 $N_c^{\text {L}}$
, which we can use to obtain the approximate bias.
Proposition 2. The approximate bias of the readme estimator is
 $$ \begin{align*} \text{Bias}\left(\widehat{\pi^{\text{U}}_1}\right) \approx \frac{\sum_{w=1}^W \left[\text{Var}(\epsilon_{w2}) - \text{Cov}(\epsilon_{w1}, \epsilon_{w2})\right] (1 - \pi_1^{\text{U}}) - \left[\text{Var}(\epsilon_{w1}) - \text{Cov}(\epsilon_{w1}, \epsilon_{w2})\right]\pi_1^{\text{U}}} {\sum_{w=1}^W \left[(B_w^{\text{U}})^2 + \text{Var}(\nu_w)\right]}, \end{align*} $$
with combined error variance
 $\nu _w=\epsilon _{w1} - \epsilon _{w2}$
.
Proposition 2 suggests several factors to consider when defining
 $\Gamma $
. As the systematic component of textual discrimination,
 $B_w^{\text {U}}$
, increases relative to the variance of the error terms,
 $\epsilon _{w1}$
and
 $\epsilon _{w2}$
, the bias approaches
 $0$
. In other words, readme works better with distinct language across categories. We should therefore define
 $\Gamma $
to maximize CD, the difference in conditional means across categories. We do this by directly generalizing to C categories Equation (5):

where the inequalities in the summations prevent double-counting. This expression is simply the sum of all the absolute values of all the
 $B_w^{\text {U}}$
terms.
Proposition 2 also suggests defining
 $\Gamma $
to increase FD, which involves making the rows of our regression matrix

closer to independent. To see why, consider how the numerator of the approximate bias contains the sum across all the features of the difference in the differences between the error variance of the categories and the covariance between the error variances (we can call this latter difference “excess variance”). If the features all were to capture the same latent quality, we would encounter a situation where the differences in excess variance would tend to go in the same direction (either all positive or all negative) across the features. Dependencies between one feature and another would increase the bias. However, when the features capture distinctive latent qualities of the text, the differences in excess variance between the categories will sometimes be positive and sometimes negative—so their sum will be closer to 0. We define this criterion, in parallel to CD, as follows:

where again the inequalities in the summations prevent double-counting.
We then choose
 $\Gamma $
by optimizing both CD and FD:
 $$ \begin{align*} \Gamma^* = \underset{\Gamma \in \mathbb{R}^{W \times W'}}{\text{arg max}} \;\; \text{CD}(\Gamma) + \text{FD}(\Gamma). \end{align*} $$
As Appendix B in the Supplementary Material demonstrates, using only one of these two criteria alone does not optimize as desired. Thus, although we can apply readme in any feature space summary of the documents, using the lower-dimensional feature space defined by
 $\Gamma $
should reduce bias in readme.
3.2.2 Adapting Matching Methods for Text Analysis
Finally, we add one last insight by considering the special case of independence of measurement errors across categories (i.e.,
 $\text {Cov}(\epsilon _{w1}, \epsilon _{w2}) = 0$
). In this situation, readme bias is minimized when the following relationship holds between the labeled and unlabeled set category proportions.
Proposition 3. When measurement errors are independent across categories, the bias of readme is minimized at
 $$ \begin{align*} \pi_1^{\text{L}} = \frac{\pi_1^{\text{U}} \sum_{w=1}^W \sigma^2_{w1}}{\pi_1^{\text{U}}\sum_{w=1}^W \sigma^2_{w1} + (1 - \pi_1^{\text{U}})\sum_{w=1}^W \sigma^2_{w2}}. \end{align*} $$
Thus, when the measurement error variances are roughly equivalent across categories, the bias of readme is minimized when proportion divergence is smallest.
We use this result to simultaneously reduce the biasing effect of vanishing discourse and to reduce proportion divergence. We do this borrowing the idea of matching from the causal inference literature (Ho et al. Reference Ho, Imai, King and Stuart2007; Iacus, King, and Porro Reference Iacus, King and Porro2012). In causal inference, matching “prunes” control observations from the data that have covariate values far from treated observations. In our case, we fix the unlabeled set and selectively prune the labeled set to remove documents with covariate profiles far from those in the unlabeled set.
To implement this idea, we search the labeled set L for a matched subset,
 $\mathcal {M}$
, that more closely resembles the unlabeled set. We do this without any information from the category labels (since they are unobserved in the unlabeled set). The goal is to remove observations from the labeled set that are so far in their content from the observations in the unlabeled set that they likely come from an entirely different data-generating process. If the texts of the documents are meaningful, exact one-to-one matching of documents in this way will eliminate all error, since it will mean that we have a hand code for each unlabeled document. In practice, approximate matching is usually needed, and any labeled unmatched documents are pruned and not used further. Our matching is in a space (of the transformed word vector summaries) designed for our specific problem; aligning the space of matching and the goals of the analysis are, of course, also key in matching for causal inference (King and Nielsen Reference King and Nielsen2017). Finally, we recompute
 and the matched
 , which we denote
 , and apply the readme regression.
As a result, the assumption in Equation (2) now needs only to hold in the matched subset of the labeled set rather than for the entire labeled set:
 $$ \begin{align} E[X^{\text{L}_{\mathcal{M}}}] = X^{\text{U}}. \end{align} $$
Matching thus considerably weakens the assumptions necessary for readme estimation and predictably reduces its bias.
4 Evaluation
4.1 Design
We performed 18 large-scale evaluations of our methodology, each following a different design protocol for allocating documents to membership in the labeled and unlabeled sets. Prior approaches in the literature have almost always used a single evaluation design, as compared to our 18, and only a few datasets, compared to our 73. The resulting 19,710 empirical evaluations in our replication data and code thus increase the rigor which future scholars can bring to bear on new methods developed to improve on those proposed here.
For each design protocol, we estimate readme2 and 32 alternative statistical methods that can be used to estimate category proportions (including readme). Each method is analyzed on 19,710 (
 $=73 \times 15 \times 18$
) datasets, because we have
 $73 $
corpora,
 $15 $
iterations per corpora per design, and 18 designs. The total number of method-design observations is therefore
 $630,720 $
(
 $=19,710 \times 32$
).
The 32 alternative methods of estimating category proportions are of five types. The first four types comprise six classifiers each run within each of the four possible combinations of (a) a discrete or continuous feature space and (b) a classification of whole documents and counting or averaging continuous probability estimates to yield estimates of the category proportions. The six classifiers include SVMs, random forests, Naive Bayes, and L1- and L2-regularized multinomial regression (James et al. Reference James, Witten, Hastie and Tibshirani2013), and an ensemble of these classifiers based on an average of classifiers within each of the two cells of (b). The fifth type of alternative method includes eight methods tuned for quantification. Among these, only readme is designed for more than two categories. We adapt the remaining seven—Friedman, Adjusted Counts, HDX, Median Sweep, Mixture HPMF, Mixture L1, and Mixture L2 (each detailed in Firat Reference Firat2016)—to multiple categories via estimation of repeated dichotomizations of the set of categories. When a method has adjustable parameters, we either optimized over them or used the software default.
Each of the 19,710 datasets we analyze, constructed as a subset of 1 of our 73 corpora, has a labeled out-of-sample test set that plays the role of the unlabeled set, except that we are able to use its labels after estimation to evaluate performance. The 73 corpora include three used in Hopkins and King (Reference Hopkins and King2010): (1) 1,426 emails drawn from the broader Enron Corporation corpus made public during the Federal Energy Regulatory Commission’s investigation of the firm’s bankruptcy and hand-coded by researchers into five categories; (2) a set of 462 newspaper editorials about immigration (with 3,618 word stems and 5 categories); and (3) a set with 1,938 blog posts about candidate Hillary Clinton from the 2008 presidential election (with 3,623 word stems and 7 categories). We also include 11,855 sentences (with 5 categories and 3,618 word stems) from the Stanford Sentiment Treebank (Socher et al. Reference Socher2013). Finally, we include 69 separate social media datasets (most from Twitter and a few from diverse blogs and Facebook posts), each created by a different political candidate, private company, nonprofit, or government agency for their own purposes, covering different time frames and categorization schemes (see Firat Reference Firat2016); these data cover 150–4,200 word stems, 3–12 categories, and 700–4,000 documents. (All data are in our replication dataset, except that for privacy reasons the raw text of the last set has been coded as numbers.)
Nearly all documents in the 73 corpora are labeled with a time stamp. For the empirical design, we randomly select a time point and pick the previous 300 documents as the labeled set and the next 300 documents as the out-of-sample evaluation set (wrapping in time if necessary). For each corpus, we repeat this process 50 times. This procedure keeps the evaluation highly realistic while also ensuring that we have many types of datasets with variation in proportion divergence, textual discrimination, and semantic change. The joint distribution of these quantities is crucial in determining the overall error dynamics, so accurately simulating this distribution is of the utmost importance in this exercise.
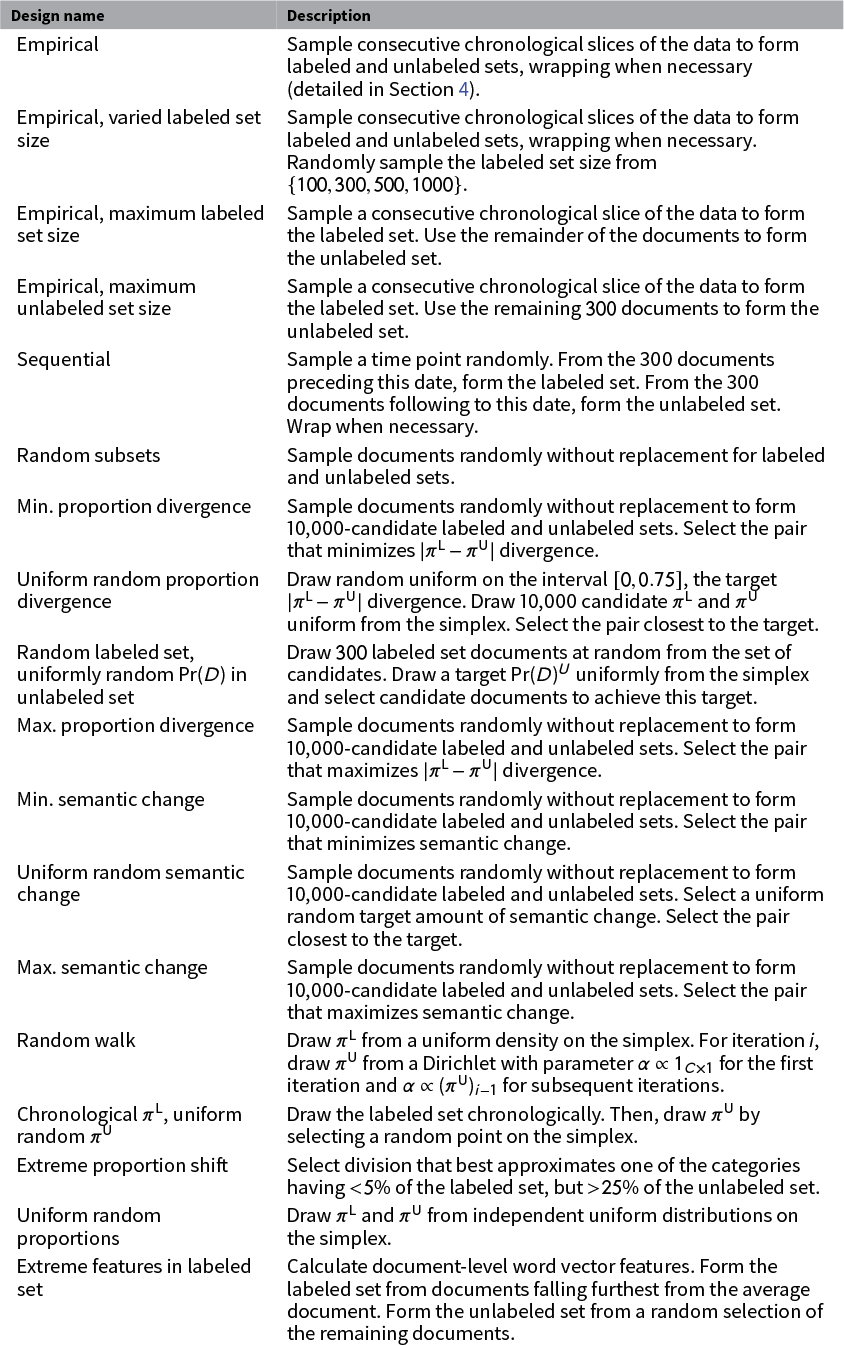
Although the empirical design emphasizes realism about what we see in practice, we replicate this analysis across the 18 designs described in Table 1 which make different assumptions about the joint distribution. Each of the 18 evaluation designs offers a different way of generating 19,710 datasets as subsets of the 73 corpora described in Section 4. Each dataset is divided into a labeled set as well as a test set that serves the purpose of the unlabeled set during estimation, but can also be used for evaluation, since all its document labels are observed.
Alternative evaluation designs.

4.2 Implementation Details
For word embeddings, we use the 200-dimensional global word vector (“GloVe”) model, estimated from about 2 billion Twitter posts with a vocabulary of about 1.2 million terms. We follow standard approaches by summarizing the vectors, in our case with the
 $10{\text {th}}$
,
 $50{\text {th}}$
, and
 $90{\text {th}}$
quantiles of each dimension (Templeton and Kalita Reference Templeton and Kalita2018), resulting, for any given corpus, in F with
 $W = 200 \times 3 = 600$
unique features observed for each document. Because we are optimizing over these factors, we do not require the preprocessing steps for textual data (removing stop words, punctuation, etc.); instead, we are only constrained by the choice of the preprocessing for the original word embedding training, which in the case of GloVe means making the text all lower case. For optimization, we use stochastic gradient descent with momentum, minimizing overfitting with dropout, gradient clipping, normalizing
 to mean zero and variance
 $1$
, and using a standard confidence penalty (King, Gebbie, and Melosh Reference King, Gebbie and Melosh2019; Kingma and Ba Reference Kingma and Ba2017; Pereyra et al. Reference Pereyra2017; Srivastava et al. Reference Srivastava2014). We set the number of final features,
 $W^{\prime }$
, to
 $20$
, although performance does not greatly depend on this parameter as long as it is much smaller than the number of input features W.
4.3 Results
We present results across our numerous evaluations in three ways.
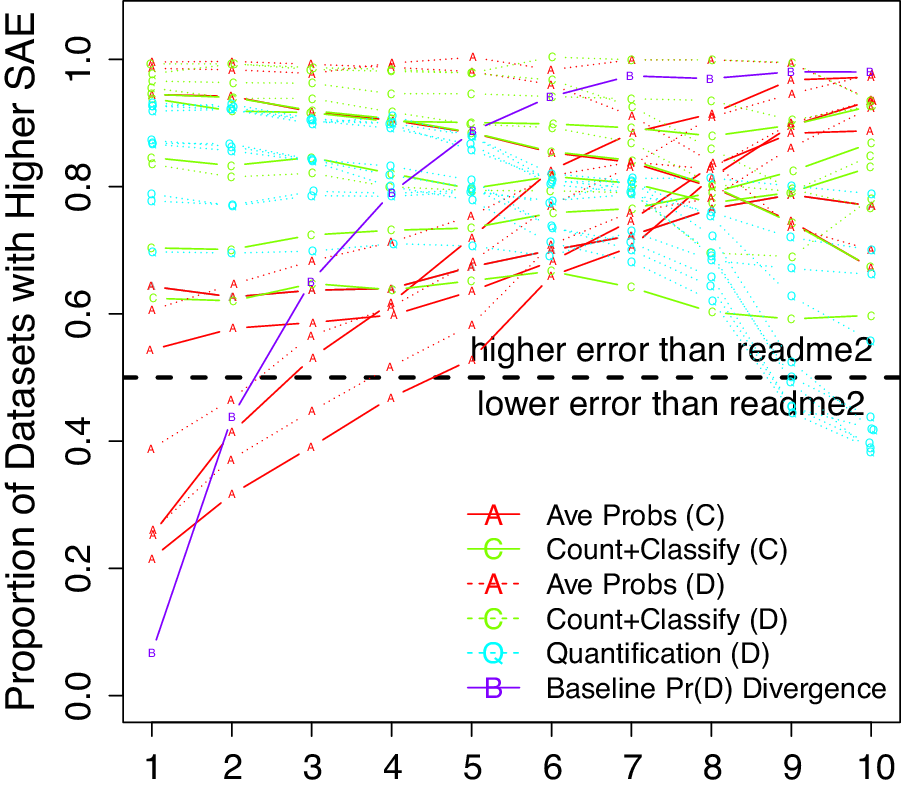
First, Figure 4 compares the performance of readme2 to the 32 alternative methods across all 18 designs. For each method, we compute the proportion of datasets with higher error than readme2 vertically by the proportion divergence in quantiles horizontally. Our new approach outperforms the best classifier (in these data, a support vector machine (SVM) model run in the continuous feature space) in
 $98.6\%$
of corpora. Many of the 32 methods are outperformed by readme2 in 100% of the cases, as indicated by appearing at the top of the graph. Relative performance remains excellent across the different levels of category proportion divergence between labeled and unlabeled sets. The new method’s relative performance improves when proportion divergence is high (at the right, with more substantial changes between labeled and unlabeled sets), which makes sense, since ours is the only approach to directly address semantic change. The different types of methods (represented as lines) follow three basic patterns in relative performance: (a) classifiers with averaged probabilities (in black and green) have higher sum of absolute error (SAE) relative to readme2 as divergence increases, due to their assumption that test and training sets are drawn from the same distribution; (b) quantification methods (in light blue) approach readme2’s performance only with high levels of divergence, since they are designed for this situation; and (c) the remaining methods perform relatively poorly overall regardless of proportion divergence.
The proportion of corpora with higher error than our approach (vertically) by quantile in proportion divergence (horizontally), with 32 different methods color-coded by type (described in the text, with feature space “D” for discrete and “C” for continuous).

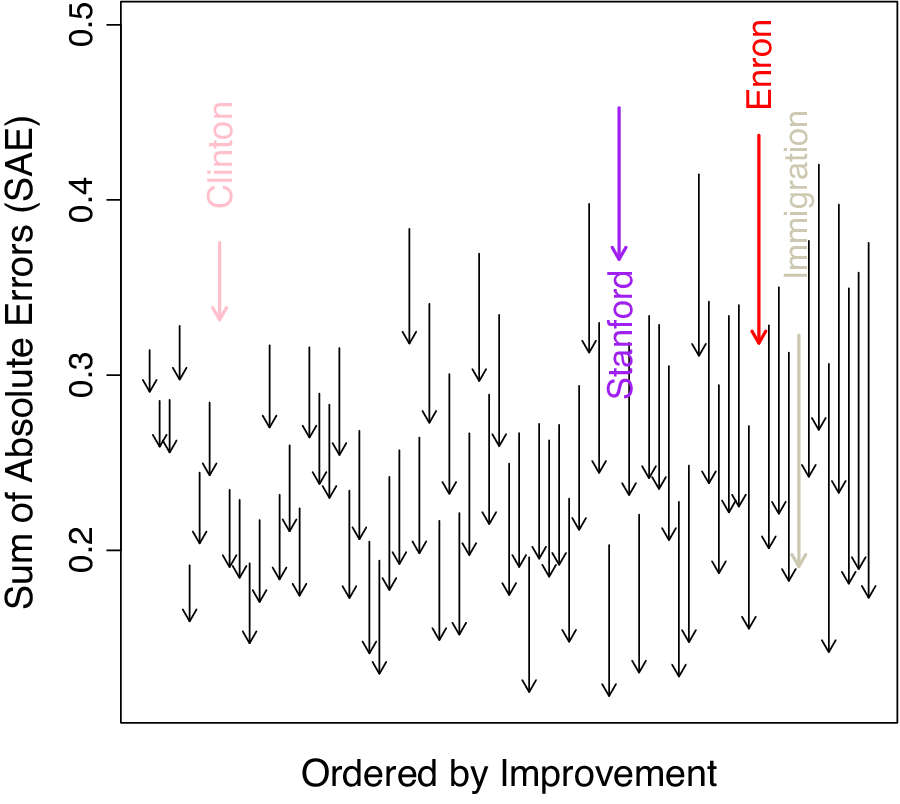
Second, we provide a more detailed comparison of the performance of readme to readme2, the primary goal of this paper. In the empirical design, which we argue is particularly important in practice, we find a 34.3% average corpus-wide improvement over readme, which in terms of SAE is a substantial 8.6 percentage points. Figure 5 plots estimation error (vertically) for readme compared to our new approach (ordered horizontally by size of the improvement). The length of each arrow represents the average improvement over subsets of each of the 73 corpora, with one arrow for each. In all cases, the arrows face downward, meaning that in every corpus, our new method outperforms readme on average. Our new approach performs better in all three of the datasets used in Hopkins and King (Reference Hopkins and King2010), and also the Stanford Sentiment dataset (the colored arrows).
Average error reduction: readme to readme2, in analyses of 50 subsets of each of the 73 datasets. The length of each arrow indicates the change in performance, with downward arrows indicating how SAE is reduced by our new methodology. Colored arrows refer to the four publicly available datasets, three of which were used in Hopkins and King (Reference Hopkins and King2010).

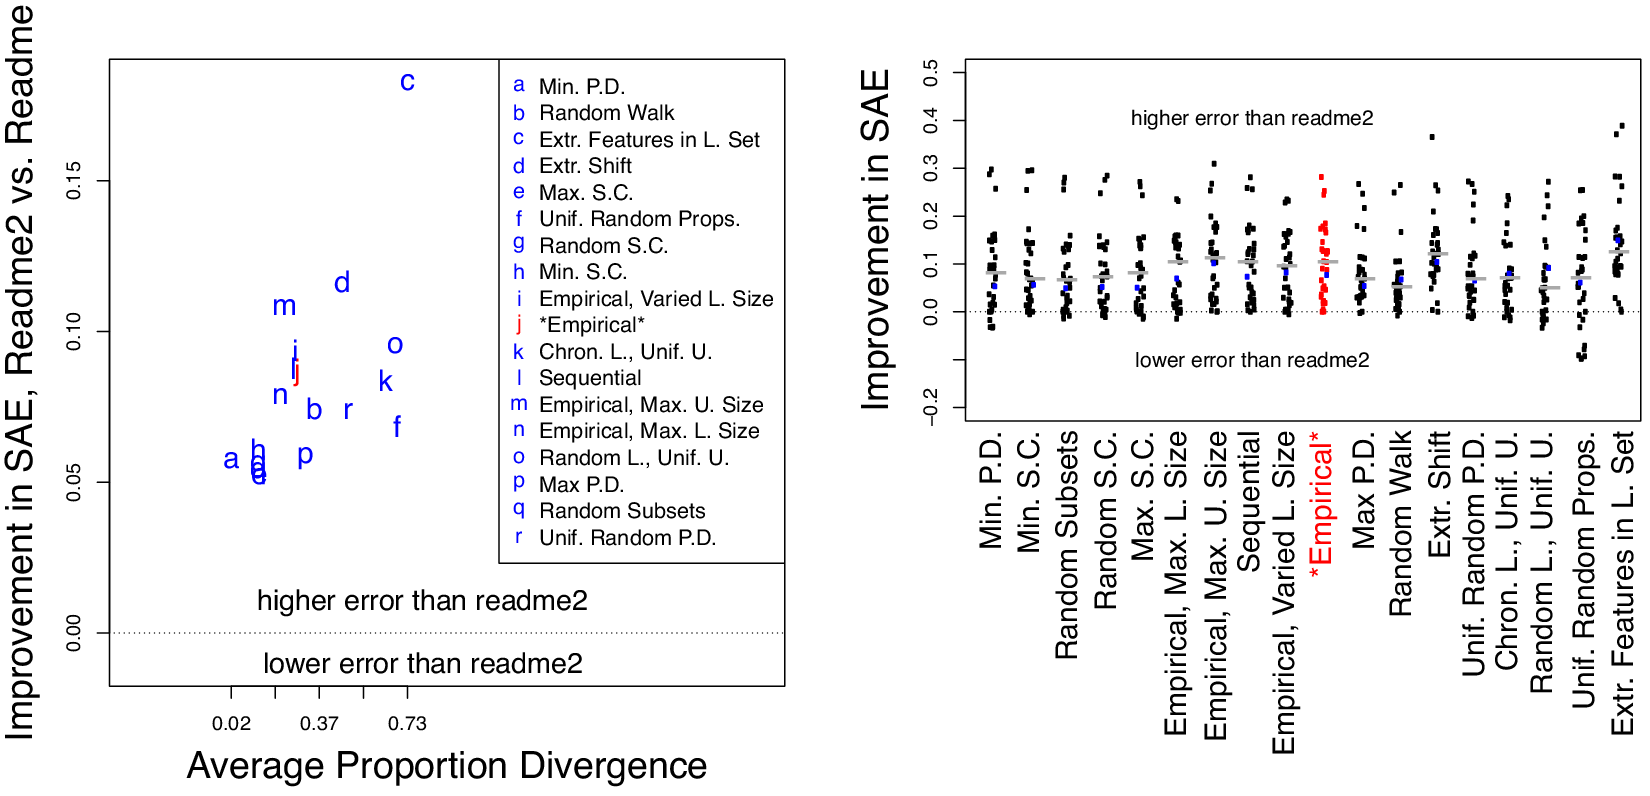
Next, we show that our results are robust across our 18 diverse simulation designs (described in Table 1). The left panel of Figure 6 compares average performance over simulations and reveals that readme2 outperforms readme for every simulation design (as indicated by being above the dotted horizontal line). The empirical analysis, noted in red, is the substantively most meaningful design described above. Then, the right panel of Figure 6 illustrates how, across the 18 simulation designs, readme2 outperforms not only readme, but all 32 alternative methods in a large fraction of cases. Readme2’s average rank is 3.11, whereas the next best algorithm’s average rank is 5.94. Median performance (indicated by the horizontal gray bar for each design) is always improved.
Average error reduction by simulation design, relative to readme (left panel) and to 32 alternative methods (right panel). The simulation marked Empirical in both is the one described above in the text; the others are described in Table 1. Items above the dotted horizontal line in both panels indicate that readme2 reduced SAE compared to a competing method. The gray horizontal line for each set of simulations in the right panel is the median. (“P.D.” stands for “Proportion Divergence”; “S.C.” stands for “Semantic Change”; “L.” stands for “Labeled”; “U” stands for “Unlabeled.”)

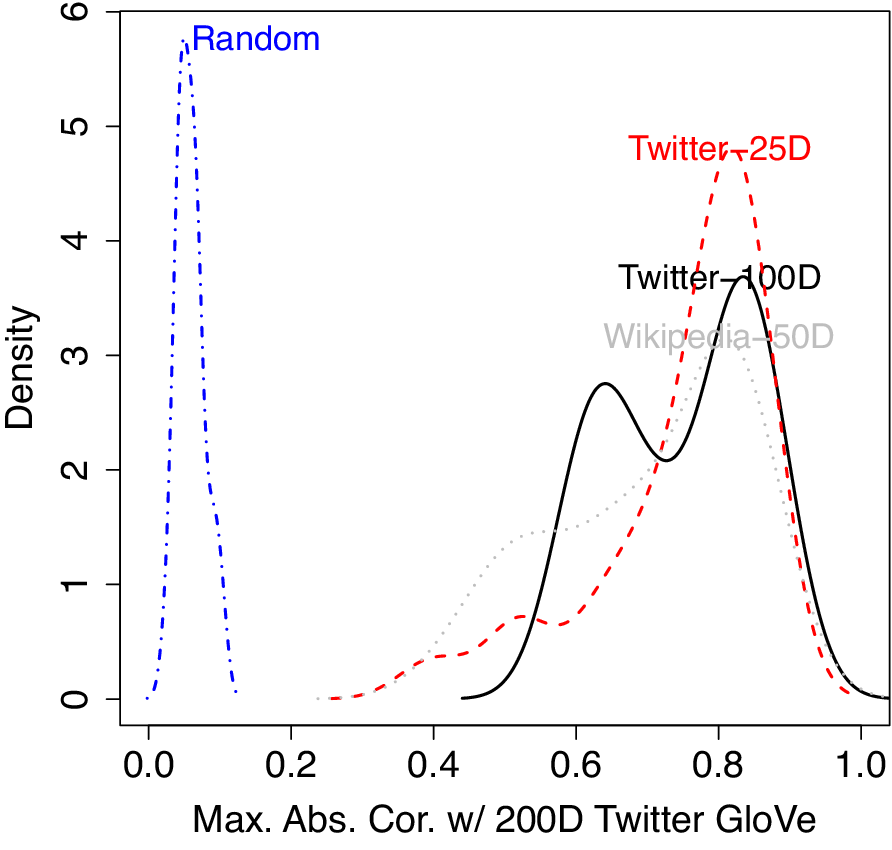
We performed a final check to assess the sensitivity of our analysis to the vector representation of the words. We re-analyzed the Clinton blogs’ data using a labeled/unlabeled split from our “Empirical” design. We generated the quantification-tuned features using the 200-dimensional GloVe embeddings from Twitter (used in our main simulation results). We then generated features using
 $25$
- and
 $100$
-dimensional GloVe embeddings from Twitter, as well as the
 $50$
-dimensional embeddings trained on a 2014 Wikipedia corpus. We find that each of the
 $20$
synthetic features from the
 $200$
-dimensional GloVe embeddings has close counterparts in each of the other cases. The maximum absolute correlation for each feature is above 0.60, and most are above 0.80. These results, illustrated in Figure 7, show that the readme2 algorithm described here is quite robust to the choice of vector representation for the words. The “random” line in blue indicates the density of maximum absolute correlations we would see if there were no relationship between the transformed 200-dimensional Twitter vector summaries and the transformed summaries from other vector sources.
Comparison of readme2 results from different word embeddings. For comparison, “Random” displays the maximum absolute correlations we would obtain with 20 randomly generated features.

In sum, our new methodology would seem to be preferable to readme and other existing methods across a wide array of corpora, datasets, and evaluation protocols. It is also worth noting that readme2 is computationally fast due to its use of batch sampling and efficient differentiable programming libraries. Estimation on a dataset with a labeled set size of 1,000 and an unlabeled set size of 500, with 5 categories and 600 raw features, takes about 11.5 seconds on a CPU with a 2.7 GHz processor and 8 GB of memory (while estimation via SVM, e.g., takes 10.5 seconds and via lasso-regularized regression takes 7.3 seconds).
5 Current Issues and Future Research
The methods introduced here appear to be clear improvements over readme and other approaches in a wide variety of circumstances, category types, and datasets. We focus in this section on the three situations where our approach may not help and further research may be productive. In addition, increasing computational power and data availability may open up the possibility of other improvements, such as by optimizing over fixed choices we have made or, for example, simultaneously training word embeddings with our approach.
First, when we use matching in continuous space, we generally reduce proportion divergence and the effects of vanishing discourse. However, emerging discourse not only can cause bias in any method, but this bias can sometimes be induced by the analyst in the process of dealing with vanishing discourse. In addition, although readme2 is the only method that has been proposed to reduce the effects of vanishing discourse, it is of no help if all the relevant discourse vanishes within a category. This is akin to a violation of the common support assumption in causal inference and so must rely on risky extrapolations. Unlike with classifiers, our methodology does not need to assume that the labeled and unlabeled sets are drawn from the same distribution, but we do require that the conditional distributions have some overlap. If one suspects that meaning or language is changing dramatically, the easiest fix is to code additional observations from later points in time.
Second, if the original feature space is highly sparse (as in a regression with a large number of irrelevant covariates), then our optimization algorithm may have difficulty arriving at a stable solution for
 $\Gamma $
. This can happen with highly uninformative text, categories with labels that may be more meaningful to investigators than the authors of the text, or error-ridden hand coding. If the word vectors used to generate the raw features were trained on an inappropriate corpus, performance would also be expected to deteriorate, as the relationship between the text and numbers would be more tenuous. Our word vectors are from Twitter, and so we recommend swapping these out with another set if the text being analyzed differs substantially from tweets. Fortunately, many types of pretrained word vectors are now available, including in many languages.
Finally, our approach relies on meaningful text in each document, conceptually coherent and mutually exclusive and exhaustive categories, and a labeling effort that validly and reliably codes documents into the right categories. These may seem like obvious criteria, but they always constitute the most important steps in any automated text analysis method, including ours. In our experience, most of the effort in getting an analysis right involves, or should involve, these preliminary steps.
6 Concluding Remarks
We improve on readme, a popular method of estimating category proportions, which is a task of central interest to social scientists and others. We do this without having to tune or even use the often model-dependent methods of individual classification developed for different quantities of interest. We prove properties and provide intuition about readme and then build our alternative approach. We have tested our analysis in 73 separate datasets, 19,710 data subsets, and 18 evaluation protocols, with encouraging results. Overall, our approach weakens the key assumptions of readme while creating new, more meaningful numerical representations of each of the documents specifically tuned to reduce the mean square error of multicategory, nonparametric quantification.
We can identify several ways of building on our work to further improve performance. These include methods for optimizing the raw continuous textual representations used in readme2. In this analysis, we use document-level summaries of word vectors for the raw features, but there is no quantitative principle implying that this choice is optimal and so could be improved. Indeed, our results suggest that the quantitative features used in readme greatly improve performance. It is natural, then, to consider continuous document-level representations directly from the labeled (and unlabeled) sets, or possibly using categorywise information from the labeled set or with smoothing toward word vectors created from giant corpora such as that we use from Twitter. With these additions, the estimation process could be more fully optimized for quantification. Finally, further work could explore more systematically the application of these ideas to other nonparametric methods.
Acknowledgment
We would like to thank Neal Beck, Chris Bingham, Aykut Firat, and Ying Lu for data and many helpful comments.
Data Availability Statement
Easy-to-use open source software that implements all the methods described in the paper is available at github.com/iqss-research/readme-software. All information necessary to replicate our results is available in the Harvard dataverse at Jerzak, King, and Strezhnev (Reference Jerzak, King and Strezhnev2021).
Supplementary Material
For supplementary material accompanying this paper, please visit https://doi.org/10.1017/pan.2021.36.