
Introduction
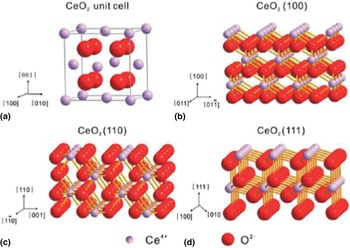
Cerium oxide (CeO2) is a typical fluorite-structured compound containing a cubic close-packed array of metal atoms with eight coordinate Ce4+ and four coordinate O2− as shown in Fig. 1(a). The {111} surface is terminated by threefold-coordinated oxygen atoms and sevenfold-coordinated cerium atoms; the {110} surface is terminated by a CeO2 plane with threefold oxygen and sixfold cerium atoms; and the polar {100} surface is terminated by twofold-coordinated oxygen atoms.[ Reference Li and Shen 1 ] Significantly, the lattice oxygen in CeO2 can be considerably lost under reducing atmosphere at elevated temperatures to form oxygen vacancies without destructing its fluorite crystal structure. However, the oxygen vacancy could be recovered by exposure to an oxidizing condition. Compared with the {111} plane, the {100} and {110} planes of ceria are more active due to the facile migration of lattice oxygen in these planes.[ Reference Zhou, Wang, Sun, Peng and Li 2 – Reference Wu, Li and Overbury 5 ] The high mobility of oxygen vacancies and the reversible valence couple in Ce4+/Ce3+ make ceria a very important oxygen storage material with a wide array of applications in catalysts, fuel cells, oxygen sensors, and ion batteries. Undoubtedly, as a key material component of exhaust emission controlling system in automobiles, the utilization of CeO2 constitutes its vital economic and technological importance, therefore has attracted significant attention over the past few decades.
Atomic configurations of the unit cell and the {100}, {110}, and {111} facets of CeO2. Reprinted with permission from Ref. Reference Li and Shen1, copyright 2014 American Chemical Society.

In this Prospective, we focus on the current research development and understanding of nanostructured CeO2, including synthetic approaches, characterization and application in energy and the environment fields. Specifically, various nanostructured ceria with different related fabrication methods are introduced in detail. We also survey the latest progress of nanostructured ceria applications in energy and environmental catalysis. By providing this perspective, we hope to transpire an improved understanding of nanostructured CeO2 and offer new opportunities to promote their research and applications in the future.
CeO2 nanostructures
Since the successful application of ceria in the catalytic converters for automotive emission control, this significant rare-earth oxide has attracted enormous interest over the past few decades. With growing tendency toward the fabrication of nanomaterials, more and more researches have been focused on the CeO2 nanostructures such as nanocrystals (NCs), spherical and hollow structures, porous structures, hierarchical, and monolithic structures. It is noted that the nanostructured ceria has shown many attractive properties, such as high surface areas, tunable pore sizes, abundant defects, and adjustable surface chemistry, which greatly expand their potential applications in energy and environmental catalysis. As following, a series of cerium-based nanostructures will be introduced with a focus on their preparation methods and characterization.
Nanocrystals
Controllable and scalable synthesis of inorganic nanoparticles (NPs) with specific shape and small size is one of the most important challenges in the field of advanced materials, but with a plenty of promises to offer toward real-world impact due to their unique shape-dependent properties. CeO2 is well known for their more active surfaces in {100} and {110} than {111}. Particularly, {100} surface is a less-stable “type III” polar surface with an electrostatic dipole moment.[ Reference Tasker 6 , Reference Conesa 7 ] So, the NC CeO2 enclosed by the selected facets may exhibit lower free energy and be more active. In the past few years, an increasing number of research efforts have been made on studying the shapes of CeO2 such as nanocubes, nano-octahedrons, nanorod, and nanopolyhedra.[ Reference Mai, Sun, Zhang, Si, Feng, Zhang, Liu and Yan 3 , Reference Yang and Gao 8 – Reference Younis, Chu, Kaneti and Li 13 ] As shown in Fig. 2(i), the colloidal CeO2 with an average edge length of 6.7 nm was prepared by a hydrothermal method, and this kind of CeO2 NCs with predominant {200} facets were truncated at the corners exposing {111} octahedral facets and at the edges {220} dodecahedral facets.[ Reference Kaneko, Inoke, Freitag, Hungria, Midgley, Hansen, Zhang, Ohara and Adschiri 11 ] Similarly, single-crystalline and uniform nanostructured CeO2 in the forms of polyhedra, rods, and cubes with different crystallographic facet exposures were prepared by adjusting the NaOH concentrations and hydrothermal reaction temperature in Mai's study.[ Reference Mai, Sun, Zhang, Si, Feng, Zhang, Liu and Yan 3 ] Lin et al. prepared several ceria nanocrystals by the hydrothermal method and explained the detailed growth mechanism starting from the formation of CeO2 nuclei followed by the subsequent hydrothermal process.[ Reference Lin, Fu, Tan, Tan, Ng and Teo 12 ] The nucleation process includes the precipitation of Ce(OH)3 NPs and the transition from Ce(OH)3 to 2–3 nm CeO2 nuclei based on an oxidation and rapid dehydration process. The hydrothermal process gives rise to an oriented attachment of nuclei through a lattice-matched surface, and subsequently an Ostwald ripening results in the growth of CeO2 NCs. Yang and Gao introduced a solvothermal method to synthesize ceria NPs, where both shape and size of ceria could be tuned conveniently by changing the concentration of the reactants, the amount of oleic acid (OLA), and the water/toluene ratio in the multiphase reaction system [Fig. 2(ii)].[ Reference Yang and Gao 8 ] With the assistance of OLA and toluene, another kind of indium-doped CeO2 NCs were also obtained by the solvothermal process in Younis’ study, and more surface oxygen vacancies were generated in the ceria lattice, which increases the lifetime of electron–hole separation for enhanced photocatalytic performances.[ Reference Younis, Chu, Kaneti and Li 13 ] Figure 2(iii) shows several ceria nanoplates with high theoretical surface-area to volume ratios with desired {100} surfaces, which were prepared by thermal decomposition of cerium acetate at 320–330 °C in the presence of stabilizers such as OLA and oleylamine, and mineralizers such as sodium diphosphate or sodium oleate.[ Reference Wang, Kang, Doan-Nguyen, Chen, Küngas, Wieder, Bakhmutsky, Gorte and Murray 14 ] The morphologies of nanoplates depend on the synthesis parameters such as concentration, reaction time, and reactant ratio. The mineralizer in this method plays an important role in accelerating the crystallization process and controlling the morphology.
(i) TEM images of CeO2 nanocrystals. Reprinted with permission from Ref. Reference Kaneko, Inoke, Freitag, Hungria, Midgley, Hansen, Zhang, Ohara and Adschiri11, copyright 2007 American Chemical Society. (ii) TEM and high-resolution TEM (HRTEM) images of ceria nanocubes. Reprinted with permission from Ref. Reference Yang and Gao8, copyright 2006 American Chemical Society. (iii) TEM and HRTEM images of square ceria nanoplates (general, stacking, elongated and stacking elongated). Reprinted with permission from Ref. Reference Wang, Kang, Doan-Nguyen, Chen, Küngas, Wieder, Bakhmutsky, Gorte and Murray14, copyright 2011 WILEY-VCH Verlag GmbH & Co. KGaA, Weinheim.

As stated earlier, through hydro(solvo)-thermal processes, the preparation of ceria NCs with different morphologies has been achieved successfully and the specific exposed facets can be controlled by tuning the synthetic conditions. However, there are still some challenges based on the hydro(solvo)-thermal techniques. Firstly, the black-box reaction under high temperature and pressure is not well understood so far and more detection methods need to be developed to fully investigate the reaction process. On the other hand, it is difficult to achieve large-scale synthesis of ceria NCs because of the low concentration of cerium precursor and harsh condition usually used in the synthesis.
Spherical and hollow structures
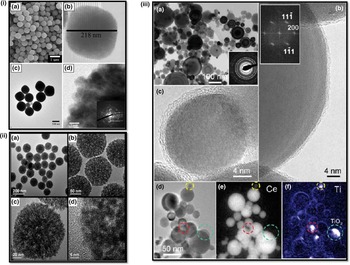
As is known, the characteristic surfaces of face-centered-cubic (FCC) structured CeO2 in {100}, {100}, and {100} planes have different surface energies, leading to different growth rates of crystal planes upon a kinetically driven condition. Generally, with assistance of specific surfactants, kinetic growth effect can be suppressed, leading to the CeO2 growth into sphere-like crystallites.[ Reference Zhou, Zhao, Xu and Yuan 15 – Reference Wang, Wang, Liao, Shen, Liu and Chen 17 ] Both Phokha et al.[ Reference Phokha, Pinitsoontorn, Chirawatkul, Poo-arporn and Maensiri 16 ] and Wang et al.[ Reference Wang, Wang, Liao, Shen, Liu and Chen 17 ] have developed hydrothermal methods to synthesize monodisperse CeO2 nanospheres by using Cerium(III) nitrate hexahydrate as precursor and polyvinylpyrrolidone as a surfactant, as shown in Fig. 3(i). The polyvinylpyrrolidone used in the process plays a crucial role in facilitating the oriented attachment and aggregation of small CeO2 NPs into nanospheres.
(i) Field-emission scanning electron microscope (FE-SEM) and TEM images of CeO2 nanospheres. Reprinted with permission from Ref. Reference Phokha, Pinitsoontorn, Chirawatkul, Poo-arporn and Maensiri16, copyright 2012 Springer. (ii) TEM and HRTEM images of CeO2 mesoporous spheres. Reprinted with permission from Ref. Reference Munoz, Acuña, Albornoz, Leyva, Baker and Fuentes19, copyright 2008 American Chemical Society. (iii) Microstructure of CeO2 nanospheres doped with 12 at.% of Ti. Reprinted with permission from Ref. Reference Feng, Sayle, Wang, Paras, Santora, Sutorik, Sayle, Yang, Ding and Wang20, copyright 2006 American Association for the Advancement of Science.

However, without using any surfactant, Li and co-workers[ Reference Liang, Xiao, Chen and Li 18 ] introduced a solvothermal method to get uniform ceria nanospheres [Fig. 3(ii)]. In their typical synthesis, Cerium(III) nitrate hexahydrate was dissolved in glycol and a certain amount of C2H5COOH was added for further solvothermal reaction. The as-prepared ceria spheres by this facile one-step strategy have high specific surface areas, uniform size distributions, and well-defined pore topologies. Recently, Fuentes and co-workers [ Reference Munoz, Acuña, Albornoz, Leyva, Baker and Fuentes 19 ] introduced a novel microwave-assisted hydrothermal homogeneous precipitation method to achieve lanthanide-doped ceria spheres. The nanostructured mixed oxide spheres were found to have a cubic crystal structure and be composed of NPs with an average crystallite size of about 10 nm. The lanthanide doping makes an increase in lattice parameters due to the reduction of Ce4+ and Pr4+ cations to Ce3+ and Pr3+, which have larger radii, and due to the associated increase in oxygen vacancy concentration.
Up to now, most researches have been reported on the fabrication of polycrystalline ceria spheres with only a few studies achieved on single-crystal ceria nanospheres. Because of their FCC structure, pure CeO2 NCs tend to be faceted and possess sharp edges, corners, and apexes. As an important polishing agent used in chemical mechanical polishing (CMP) of Si wafers, CeO2 NCs are more prone to scratch the silicon wafers and limit the CMP rates.[ Reference Feng, Sayle, Wang, Paras, Santora, Sutorik, Sayle, Yang, Ding and Wang 20 ] Wang and co-workers[ Reference Feng, Sayle, Wang, Paras, Santora, Sutorik, Sayle, Yang, Ding and Wang 20 ] developed a flame spray pyrolysis method with a mixed solution of cerium and titanium precursors dissolved in flammable solvent alcohol to fabricate single-crystal ceria nanospheres [Fig. 3(iii)]. With the assistance of molten 1–2 nm titania shell under the synthetic condition, the single-crystal ceria without faceting can be obtained because the crystallization would be completely encapsulated by titania shell. The large-scale synthesis of single-crystal ceria nanospheres can reduce the polishing defects by 80% and increase the silica removal rate by 50%, facilitating precise and reliable mass-production of chips for electronics.
Hollow-structured ceria-based materials have attracted increasing attention because of their unique features such as well-defined morphology, uniform size, large surface area, low density, and potential useful space. Template method is the main method for getting hollow structure, where three steps are generally applied including the preparation of template, coating precursor on the surface of the template to form a core@shell structure, and removal of template by calcination or wet chemical etching. The template can be polymer latex colloids,[ Reference Chen, Chen and Chen 21 , Reference Chen and Lu 22 ] silica particles,[ Reference Strandwitz and Stucky 23 ] and carbon spheres.[ Reference Li, Chen, Lu, Ni, Zhao and Chen 24 , Reference Qi, Zhao, Li, Gao, Zhao, Yu and Tang 25 ] As displayed in Fig. 4(i), silica spheres[ Reference Strandwitz and Stucky 23 ] were selected as hard template and the size of hollow structure and shell layer can be controlled by using different size of hard template and different coating process. Besides, carbonaceous spheres with rich surface hydrophilic functional groups (–OH and –COOH) were usually used as hard templates for fabrication of ceria hollow spheres, which have good affinity to Ce3+ ions and abundant accessible pore channels.[ Reference Li, Chen, Lu, Ni, Zhao and Chen 24 , Reference Qi, Zhao, Li, Gao, Zhao, Yu and Tang 25 ] Interestingly, single-, double-, triple-, and even quadruple-shell hollow ceria nanospheres can be successfully achieved by controlling calcination at different heat ramp in the template removal process, as shown in Fig. 4(ii).[ Reference Xu, Yu, Ren, Zong, Chen and Xing 26 ] During the calcination, the redistribution and penetration of cerium species lead to assembly of these different ceria hollow structures. Higher heat ramp rate facilitated the spreading of the cerium species in the spheres before causing any combustion of the organic species, which allowed deeper penetration of the cerium species and finally more shell formation.[ Reference Xu, Yu, Ren, Zong, Chen and Xing 26 ] However, considering the removal procedure of the templates (calcination or etching), there are still some challenges in the template method because of their usually complicated and energy-consuming process. Fortunately, recent progresses proved that the template-free method can be applied to prepare ceria hollow spheres, which can be carried out in one step. Cao et al. developed a microwave-assisted hydrothermal method to synthesize ceria hollow nanospheres with environmentally benign precursors such as cerium nitrate, urea, and water.[ Reference Cao, Cui, Chen, Song and Cai 27 ] An Ostwald ripening mechanism coupled with a self-templated, self-assembly process was used to explain the formation of the hollow structures, in which amorphous solid spheres were converted to crystalline NCs and the latter self-assembled into hollow structures.[ Reference Cao, Cui, Chen, Song and Cai 27 ] Similarly, the hollow ceria spheres can also be successfully obtained by other hydro-/solvothermal methods without any templates.[ Reference Han, Liu, Li, Li, Li, Zhang and Yao 28 – Reference Yang, Han, Ma, Liang, Liu and Yang 30 ]
(i) TEM images of SiO2 templates (A, B), SiO2@CeO2 (C, D), @CeO2 (E, F) spheres. Reprinted with permission from Ref. Reference Strandwitz and Stucky23, copyright 2009 American Chemical Society. (ii) (a–d) TEM images of ceria hollow nanospheres. Reprinted with permission from Ref. Reference Xu, Yu, Ren, Zong, Chen and Xing26, copyright 2014 Royal Society of Chemistry.

Porous structure
The materials with porous structures have attractive properties such as tunable pore size and shape, nanoscale walls, robust structure, controllable composition, redox active internal surfaces, connected pore networks, and high surface area. These porous structures have found many applications such as supercapacitors, fuel cells, sensors, adsorption, separation, catalysis, and sensing. As shown earlier, most of the sphere-like especially hollow-structured ceria is assembled by numerous NPs, which leads to the formation of porous feature. Besides, another kind of porous ceria can be obtained by nanocasting with hard templates. In this method, cerium precursor was firstly filled in the pore space provided by the templates, which were selectively removed subsequently. Ji et al. used MCM-48 molecular sieves as a hard template to prepare highly ordered mesoporous CeO2 with similar cubic Ia3d symmetry such as MCM-48, as shown in Fig 5(i).[ Reference Ji, Zhang, Chen and Anpo 31 ] Compared with the non-porous material, a blue shift in light absorption was found in the mesoporous ceria, which had more surface vacancies because of the special porous structure. For dye decolorization reaction, the ordered mesoporous ceria exhibited much higher activity than a non-porous sample and a standard reference TiO2. Moreover, uniform colloidal particles such as silica and polymer were also applied to serve as a hard template to construct three-dimensional (3D) meso-/macro-porous structures. Voskanyan et al. recently employed colloidal SiO2 as a template synthesize a crystalline mesoporous CeO2 with tailored porosity, where the size and amount of colloidal particles can tune the porosity of the CeO2 nanostructure as well as alter the heat transfer and heat balance of combustion [Fig. 5(ii)].[ Reference Voskanyan, Chan and Li 32 ] By changing the size of colloidal particles, the porosity of ceria can be controlled successfully. Zhang et al. prepared a three-dimensionally ordered macroporous (3DOM) Au/CeO2 catalysts by using assembly of three-dimensionally ordered polystrene colloidal crystal templates.[ Reference Zhang, Jin, Li, Shen, Han, Hu, Di and Liu 33 ] The as-prepared materials possess well-defined 3DOM structures with adjustable pore sizes from 80 to 280 nm and interconnected networks of spherical voids, which displayed superior activity for in-door formaldehyde oxidation.
(i) TEM, HRTEM, and selected area electron diffraction (SAED) images of the template-free CeO2 sample. Reprinted with permission from Ref. Reference Ji, Zhang, Chen and Anpo31, copyright 2008 American Chemical Society. (ii) (A) TEM images of initial colloidal SiO2 and ceria-3. Reprinted with permission from Ref. Reference Voskanyan, Chan and Li32, copyright 2016 American Chemical Society.

Hierarchical structure
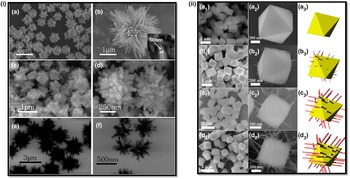
Hierarchical nanostructures with building blocks in multiple length scales at different levels get a lot of attention for both fundamental research and technical applications. Besides the basic physicochemical nature of their building blocks, the synergy among different size components could affect the properties of such materials significantly. Through controlling the accessibility of functional components, curvature of interfaces, and style of the internal organizations, the properties of materials can be greatly tailored. In the past few years, much effort has been made to synthesize ceria-based hierarchical nanostructures. Tang et al. develop a template-free sol–gel chelating method to construct a hierarchical layer-stacking CeO2 nanostructure.[ Reference Tang, Li, Shan, Wu and Chen 34 ] Both spindle- and flower-like particles were assembled by many porous nanoflakes that were organized by numerous ceria NPs, and it exhibited much better performance in CO oxidation than commercial CeO2 NPs. In Yu's study, another CeO2 hierarchical architectures with well-aligned nanorods prepared through a simple Na3PO4-assisted hydrothermal reaction without any templates.[ Reference Yu, Yan, Zheng, Chen and Xing 35 ] Similarly, Wei et al. obtained 3D urchin-like CeO2 hierarchical structures through the thermal decomposition of cerium formate precursors prepared by a solvothermal method, as shown in Fig. 6(i).[ Reference Wei, Yang and Yang 36 ] Li et al. synthesize a similar 3D hierarchical flower-like CeO2 microspheres assembled with 1D nanowires, which was constructed through an aggregation of 0D NPs.[ Reference Li, Lu, Li, Wang, Guo and Guo 37 ] The prepared flower-like CeO2 exhibits more surface-capping oxygens, higher concentrations of Ce3+ and O vacancy, and more {100} lattice planes because of the unique structure and hierarchical morphology, leading to its higher catalytic activity for CO oxidation than general bulk ceria. He et al. introduced CO into the hydrothermal reaction and achieved a novel globin-like hierarchical CeO2 nanostructure assembled by rod-like building blocks.[ Reference He, Liang and Chen 38 ] Moreover, Li et al. recently developed a solution-based epitaxial growth method to prepare a novel crystal facet-based CeO2 homojunction consisting of hexahedron prism-anchored octahedron with exposed prism surface of {100} facets and octahedron surface of {111} facets, as shown in Fig. 6(ii).[ Reference Li, Zhou, Zhao, Xu, Wang, Xiao and Zou 39 ] This single-crystal hierarchical CeO2 nanostructure was firstly reported, which exhibited much better activity in phototocatalytic reduction of CO2 into methane because growth of the prism arm on octahedron allows to activate inert CeO2 octahedron.[ Reference Li, Zhou, Zhao, Xu, Wang, Xiao and Zou 39 ]
(i) SEM and TEM images of the urchin-like and coral-like Ce-(HCOO)3 precursors. Reprinted with permission from Ref. Reference Wei, Yang and Yang36, copyright 2011 Royal Society of Chemistry. (ii) SEM images of hierarchical CeO2 nanostructures. Reprinted with permission from Ref. Reference Li, Zhou, Zhao, Xu, Wang, Xiao and Zou39, copyright 2015 American Chemical Society.

Monolithic structure
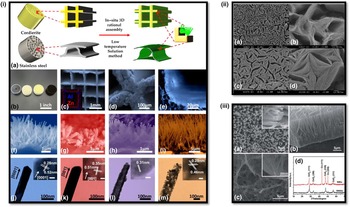
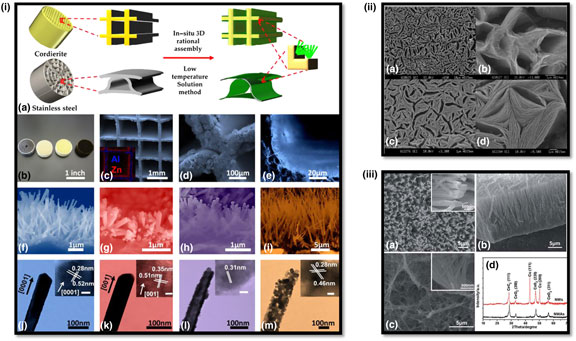
At present, most of researches are still focused on synthesis of CeO2 particles, while industrial applications of ceria particles in catalysis need further processing such as pelletizing and wash-coating process. Some challenges exist for the processes of pelletizing and wash-coating: (a) the rough assembly technologies cannot make full use of materials especially those used in extreme condition (high space velocity); (b) the lack of well-defined structural and geometrical configurations compromises the activity and materials utilization efficiency; and (c) the favorable properties of nanostructured ceria may be reduced because of inevitable damages during the process. Fortunately, monolith structures integrating functional nanostructures onto 2D and 3D substrates provide a perfect solution to solve these problems in the traditional powder-based industries. For example, our group developed a series of in situ technologies to grow various arrays of nanostructures such as nanorods, nanowires, and nanotubes onto 3D channeled monolithic substrates.[ Reference Guo, Ren, Xiao, Liu, Sharma, Gao, Mhadeshwar and Gao 40 – Reference Guo, Zhang, Ren, Gao and Gao 47 ] Instead of wash-coat-based catalysts, the nano-array integrated monoliths have well-defined structures and good uniformity. The superior properties of nanostructured materials can be fully kept on the monolith and give much higher materials utilization efficiency. As shown in Fig. 7(i), typical nano-array-based monolithic structures, including ZnO, TiO2, CeO2, and Co3O4 were fabricated by the in situ growth process invented in our group.[ Reference Guo, Ren, Xiao, Liu, Sharma, Gao, Mhadeshwar and Gao 40 ] For CeO2-based monolith, the tunable structure was prepared by a ZnO array-templated method. This induced CeO2 nanotube array displayed lower thermal and mechanical stability than other array structures due to the polycrystalline nature of the nanotubes and their non-uniform tube wall thickness along the nanotube length.[ Reference Guo, Ren, Xiao, Liu, Sharma, Gao, Mhadeshwar and Gao 40 , Reference Wang, Zhang, Zhang and Hua 48 ] Another integrating CeO2 approach is electrochemical deposition process, which was reported from the Tong's group.[ Reference Li, Qu, Yu and Tong 49 , Reference Lu, Zheng, Gan, Liu, Liang, Liu and Tong 50 ] By controlling the Ce3+ concentration of solution and current density, they successfully deposited two typical array nanostructures (nanosheets and nanowires) on the Cu foil, as shown in Fig. 7(ii) and (iii).[ Reference Li, Qu, Yu and Tong 49 , Reference Lu, Zheng, Gan, Liu, Liang, Liu and Tong 50 ] However, due to the difficulty in controlling electrochemical deposition process, it still remains a challenge for the large-scale production of to scale up the 3D ceria array-based monoliths.
(i) Schematic illustration of 3D configurated nano-array catalysts, and typical morphology and structure of metal oxide (left to right: ZnO nanorod arrays on stainless steel, and TiO2 nanorod arrays, CeO2 nanotube arrays, and Co3O4 porous nanowire arrays) nano-arrays on monoliths. Reprinted with permission from Ref. Reference Guo, Ren, Xiao, Liu, Sharma, Gao, Mhadeshwar and Gao40, copyright 2013 Elsevier. (ii) SEM images of porous CeO2 deposits. Reprinted with permission from Ref. Reference Lu, Zheng, Gan, Liu, Liang, Liu and Tong50, copyright 2008 American Chemical Society. (iii) SEM images and x-ray diffraction (XRD) pattern of porous CeO2 NWAs. Reprinted with permission from Ref. Reference Wu, Li, Mullins and Overbury51, copyright 2010 Royal Society of Chemistry.

Application in environmental catalysis and energy
Compared with bulk ceria, the decrease of particle size to the nanoscale will have a great impact on the physical and chemical properties of nanostructured ceria in different applications. For instance, the catalytic activities can be tailored by controlling the morphologies of ceria NPs, where different active facets can be selectively exposed.[ Reference Wu, Li and Overbury 5 , Reference Wu, Li, Mullins and Overbury 51 , Reference Mann, Wu, Calaza and Overbury 52 ] Here we highlight a few applications of nanostructured ceria in energy and environmental catalysis.
CO oxidation
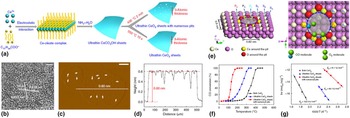
The catalytic oxidation of CO to CO2 over CeO2 has been extensively studied based on its oxygen storage ability through a Ce3+/Ce4+ cycle under operation condition while maintaining the fluorite crystal structure. In the automotive exhaust aftertreatment system, cerium is an important component of the three-way catalysts, which promotes the oxidation of CO by absorbing and releasing oxygen.[ Reference Trovarelli 53 ] Generally, it is true that the oxygen storage capacity (OSC) of ceria follows the order of nanocubes > nanorods > nanopolyhedra, indicating that the low-indexed plane has a higher OSC.[ Reference Mai, Sun, Zhang, Si, Feng, Zhang, Liu and Yan 3 ] Therefore, single-crystalline CeO2 nanostructures with selectively exposed planes will have a distinct catalytic performance. Zhou et al. proved that the CeO2 nanorods with predominantly exposed planes of reactive {001} and {110} is more active than irregular CeO2 NPs with stable {111} plane for CO oxidation,[ Reference Zhou, Wang, Sun, Peng and Li 2 ] which are also observed from Tana et al.’s study.[ Reference Tana, Zhang, Li, Li, Li and Shen 4 ] However, the activity for CO oxidation on the general CeO2 NCs still needs to be improved especially at low-temperature region. One of the promising methods is building novel nanostructures such as hierarchical structures and porous structures, which can provide more active sites and more porous space for a reaction process and reactant diffusion. Rao et al. recently developed a facile carbonate-assisted formaldehyde hydrothermal approach to build a hierarchical porous CeO2 nanobundles without using templates and surfactants.[ Reference Rao, Yang, Li, Dong, Fang and Zhang 54 ] The nanobundles assembled by numerous nanorods performed with much better activity for CO oxidation than other ceria nanostructures such as nanorods, nanowires, and NPs. Similarly, He et al. prepared a globin-like mesoporous CeO2 by using CO-assisted synthetic approach based on hydroxide carbonate precursors, where CO helps the formation of the globin-like mesoporous precursors as the carbon source because of its preferential adsorption on Ce3+ under the hydrothermal conditions, as shown in Fig. 6(v).[ Reference He, Liang and Chen 38 ] The as-prepared globin-like CeO2 spheres assembled by rod-like building blocks shows much better performance in CO oxidation than ordinary CeO2 NPs. Moreover, the activities of ceria can be significantly enhanced by controlling the exposed active sites on the surface. Sun et al. constructed a novel three-atomic-layer thin sheets with approximately 20% surface-confined pits occupancy through an “ultrafast open space transformation” strategy, as shown in Fig. 8.[ Reference Sun, Liu, Gao, Cheng, Lei, Sun, Jiang, Su, Wei and Xie 55 ] The pits-abundant ceria exhibited superior activity for CO oxidation at low temperature because the highly coordination-unsaturated pit-surrounding Ce sites brought about the increased hole carrier density and hence assured fast CO diffusion along the 2D conducting channel of surface pits.
(a) Schematic illustration for the formation of ultrathin CeO2 sheets with numerous surface pits and intact ultrathin CeO2 sheets. (b–d) HRTEM and AFM images. (e) Overhead and top views of schematic structures for the three-atom-thick CeO2 sheets with a pit size of 0.90 nm × 0.82 nm; the CO molecules prefer to adsorb at P2 site, while the O2 molecules tend to adsorb and dissociate at the adjacent P1 sites. (f–g) Catalytic performance for CO oxidation. Reproduced with permission from Ref. Reference Sun, Liu, Gao, Cheng, Lei, Sun, Jiang, Su, Wei and Xie55, copyright 2013 Nature Publishing Group.

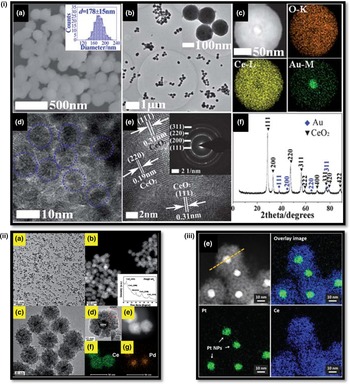
Noble metal-based catalysts have been applied widely in many heterogeneous catalytic processes, where the particle size, preparation approach, treated condition, dispersion level, and support play vital roles in the final performance. Particularly, the choice of support material is highly important, which will have a great effect on the activities of the catalysts. Compared with traditional supports (SiO2, Al2O3, and TiO2), ceria is a promising material for loading noble metal catalysts because it can be active and offers strong metal–support interactions. In terms of CO oxidation, the ignition temperature over on ceria-based catalysts can be greatly lowered to ambient temperature through supporting noble metals such as Ag,[ Reference Liang, Xiao, Chen and Li 18 , Reference Kang, Sun and Li 56 ] Au,[ Reference Kim, Lee and Henkelman 57 – Reference Chen, Luo, Jiang and Huang 63 ] Pd,[ Reference Zhou, Lawrence, Wu, Liu, Kent, Soo and Cheung 64 – Reference Guo, He, Wang, Liu, Yang, Wang, Huang and Wei 67 ] and Pt.[ Reference Wang, Liu, Song and Zhang 68 – Reference Meher, Cargnello, Troiani, Montini, Rao and Fornasiero 70 ] However, the dispersed noble metal generally tends to agglomerate into large particles during sintering, which is a serious problem in practical applications such as automotive emission control. It is found that ceria can be an excellent support for maintaining highly dispersed noble metal at higher temperature, which significantly leads to a much longer catalyst lifetime.[ Reference Kim, Lee and Henkelman 57 , Reference Meher, Cargnello, Troiani, Montini, Rao and Fornasiero 70 , Reference Ke, Zhu, Jiang, Si, Wang, Li, Jin, Liu, Song and Yan 71 ] Moreover, a novel core@shell structure has been developed for preventing noble metal NPs from sintering at extremely high temperature, in which nanosized noble metals are surrounded by polymerized ceria. As shown in Fig. 9(i)–(iii), the typical Au@CeO2, Pd@CeO2, and Pt@CeO2 were synthesized for CO oxidation, which performed much better than general M/CeO2 catalysts with excellent resistance for sintering treatment.[ Reference Qi, Chen, Li, Li, Gao and Tang 60 , Reference Wang, Liu, Li, Zhen, Wang and Zhang 65 , Reference Lee, Seo and Jung 72 ]
(i) (a) SEM, TEM, high-angle annular dark field (HAADF)–STEM, HRTEM, and XRD mapping images of Au@CeO2 microspheres. Reprinted with permission from Ref. Reference Qi, Chen, Li, Li, Gao and Tang60, copyright 2012 Royal Society of Chemistry. (ii) (a), (c), and (d): TEM images; (b) inside; (b) and (e) STEM image; (f) and (g) mapping analysis of the as-obtained Pd@CeO2 core@shell nanospheres. Reprinted with permission from Ref. Reference Wang, Liu, Li, Zhen, Wang and Zhang65, copyright 2015 Royal Society of Chemistry. (iii) HAADF–STEM images with the corresponding mapping profile of Pt@CeO2 nanocomposite. Reprinted with permission from Ref. Reference Lee, Seo and Jung72, copyright 2016 Royal Society of Chemistry.

Ceria-supported noble metal catalysts exhibit high activity for CO oxidation at low temperature; however, it is still a challenge to apply widely in industrial process due to some drawbacks such as sintering effect, susceptibility to poisoning, volatility, and high cost. Therefore, exploring “noble metal-free” catalysts with promising catalytic properties is highly desirable. Fortunately, recent studies reveal that the physical and chemical properties of ceria can be promoted by introducing foreign component to construct doping structure or solid solution. Until now, many components such as Zn,[ Reference Xie, Zhao, Guo, Lu, Zhang, Wang, Chen and Peng 73 , Reference Zhong, Zhang, Wang, Huang, Fan and Xu 74 ] Cu,[ Reference Chen, Li, Hu, Huang, Li, Xu, Zuo and Li 75 – Reference Qin, Lu, Cao and Hu 80 ] Co,[ Reference Liu, Wu, Peng, Binder, Chai and Dai 81 – Reference Binder, Toops, Unocic, Parks and Dai 83 ] Mn,[ Reference Zhang, Wei, Yang, Liu, Liu, Zhang and Yang 84 – Reference Venkataswamy, Rao, Jampaiah and Reddy 87 ] and Sn[ Reference Sasikala, Gupta and Kulshreshtha 88 – Reference Ayastuy, Iglesias-González and Gutiérrez-Ortiz 90 ] have been applied to dope ceria, which enhance the catalytic CO oxidation performance significantly. With the doping effect, the OSC of ceria can be improved by increasing the number of oxygen vacancies due to the low valence states of doped metal ions, which will greatly enhance the oxygen mobility and low-temperature reducibility, in turn, lead to much better catalytic performances. Among them, it seems that Cu is a promising component to promote activities of ceria, including general and preferential CO oxidations. Recently, Elias et al. proved that the active phase responsible for low-temperature CO oxidation in nanoscale CuO/CeO2 catalysts was surface-substituted Cu y Ce1−y O2−x .[ Reference Elias, Artrith, Bugnet, Giordano, Botton, Kolpak and Shao-Horn 91 ] Through in situ x-ray absorption spectroscopy, they found that the copper ions in Cu y Ce1−y O2−x remain at high oxidation states (Cu3+ and Cu2+) under oxygen-rich catalytic conditions, which preferentially segregate to the surface of the Cu y Ce1−y O2−x NP.[ Reference Elias, Artrith, Bugnet, Giordano, Botton, Kolpak and Shao-Horn 91 ]
Hydrocarbon combustion
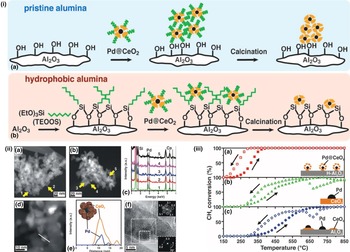
As with CO oxidation, catalytic combustion of hydrocarbons has been paid considerable attention nowadays for developing new technological solutions for abatement of emissions. Wang et al. found that the complete oxidation of toluene could be achieved at 240 °C with use of CeO2 catalyst.[ Reference Wang and Lin 92 ] Comparing the different preparation methods, ceria with smallest crystal size and largest Brunauer-Emmett-Teller (BET) surface area performed as the most active catalyst, which was best able to adsorb both toluene and O2.[ Reference Wang and Lin 92 ] However, for pure ceria material, it is still difficult to get promising performances for hydrocarbon combustion especially for low carbon-number hydrocarbons such as methane and propane. Accordingly, supporting noble metals can meet the problem and reduce the ignition temperature significantly.[ Reference Cargnello, Jaén, Garrido, Bakhmutsky, Montini, Gámez, Gorte and Fornasiero 93 – Reference Herrmann, Hoang-Van, Dibansa and Harivololona 95 ] Fornasiero and co-workers recently demonstrated a supramolecular approach to synthesize Pd@CeO2/Al2O3, in which single units composed of a palladium (Pd) core and a ceria (CeO2) shell are pre-organized in solution and then homogeneously deposited onto a modified hydrophobic alumina as shown in Fig. 10(i) and (ii).[ Reference Cargnello, Jaén, Garrido, Bakhmutsky, Montini, Gámez, Gorte and Fornasiero 93 ] The Pd cores can remain isolated even after heating the catalyst to 850 °C, and this novel core–shell structure has exceptionally high methane oxidation activity below 400 °C [Fig. 10(iii)] and outstanding thermal stability under demanding conditions because of the enhanced metal–support interactions. Besides ceria-supported noble metals catalyst, ceria-based composite materials are also widely applied in catalytic total oxidation of hydrocarbons. Among them, the composite oxides such as Mn–Ce–O,[ Reference Azalim, Franco, Brahmi, Giraudon and Lamonier 96 – Reference Tang, Wu, Liu, Li, Li, Li and Chen 101 ] Cu–Ce–O,[ Reference Delimaris and Ioannides 102 – Reference Aranda, Aylón, Solsona, Murillo, Mastral, Sellick, Agouram, García and Taylor 105 ] and Co–Ce–O[ Reference Binder, Toops, Unocic, Parks and Dai 83 , Reference Carabineiro, Chen, Konsolakis, Psarras, Tavares, Órfão, Pereira and Figueiredo 106 ] show good activities, where the strong synergistic effect can be promoted by their lattice contact or doping function.
(i) Schematic representation of the agglomeration of Pd@CeO2 structures when using the pristine alumina (a) and their deposition as single units after treatment of the same support with triethoxy(octyl)silane (TEOOS) (b). (ii) TEM investigations of Pd@CeO2 core–shell structures dispersed on hydrophobic alumina. (a) HAADF–STEM image after calcining to 500 °C for 5 h and (b) to 850 °C for 5 h. (c) EDS spot analysis of the indicated particles. (d) High magnification HAADF–STEM image of the Pd@CeO2/H-Al2O3 catalysts calcined to 500 °C and (e) the corresponding EDS line profile together with a model. (f) HRTEM image of a single Pd@CeO2 structure on the Pd@CeO2/H-Al2O3 catalysts calcined to 500 °C. (iii) CH4 conversion against the temperature for the three catalyst formulations used. Reproduced with permission from Ref. Reference Cargnello, Jaén, Garrido, Bakhmutsky, Montini, Gámez, Gorte and Fornasiero93, copyright 2012 American Association for the Advancement of Science.

Soot combustion
With emissions of NO x , CO, and unburned hydrocarbons, soot particle is another important undesired by-product in a diesel combustion process, which is one of precursors of photochemical smog and highly toxic for human's health.[ Reference Dickerson, Kondragunta, Stenchikov, Civerolo, Doddridge and Holben 107 , Reference Ammann, Kalberer, Jost, Tobler, Rössler, Piguet, Gäggeler and Baltensperger 108 ] Diesel particulate filters (DPF) are generally efficient for removing soot particles and the regeneration of DPF with combustion of the deposited soot is very important. Because of high ignition temperature of soot in air (>500 °C), a catalyst is highly desirable for promoting soot combustion at lower temperature especially at an exhaust temperature range of ~150–450 °C. In the past few years, it has been found that ceria alone or mixed with other components is active for catalytic combustion of soot particles and supposed to be a kind of promising candidate catalysts for practical application.[ Reference Muroyama, Hano, Matsui and Eguchi 109 – Reference Aneggi, Wiater, de Leitenburg, Llorca and Trovarelli 113 ] Aneggi et al. investigated the behavior of a series of CeO2 catalysts in soot combustion reaction and found nanodomains of reduced ceria in the form of Ce6O11 developed during reaction under oxygen-containing atmosphere, supporting the idea that the reaction between CeO2 and carbon particulate results in the formation of a reduced ceria phase.[ Reference Aneggi, Divins, de Leitenburg, Llorca and Trovarelli 111 ] This combustion reaction takes place at interfaces between catalysts and soot, which requires its redox activity and ability to deliver active oxygen from lattice to surface of carbon soot particles. Meanwhile, they compared the activity for soot combustion over different shapes of ceria such as conventional polycrystalline particles, single-crystalline ceria nanorods, and nanocubes and found that the activity is largely influenced by the exposed surface and surface area.[ Reference Aneggi, Wiater, de Leitenburg, Llorca and Trovarelli 113 ] Based on the same surface area, the nanocubes with predominately exposed {100} surface and nanorods with predominately exposed {100} and {110} surfaces exhibited higher activity than the polycrystalline ceria octahedral particles with predominately exposed {111} surface. Moreover, the truncation of the edges and corners can be obtained by thermal aging (T > 773 K), which generates more surfaces with higher index plane exposure and increases the specific activity especially on polycrystalline ceria.
NO x decomposition and reduction
Nitrogen oxides (NO x ) emitted from combustion have a great impact on human health and global environment, and it is highly desirable to remove NO x from emission gas. Until now, two methods have been applied to eliminate NO x : one is direct decomposition and another is reduction with urea or ammonia. Non-stoichiometric CeO2 has been proved to be effective for NO decomposition because of the formation of oxygen defects by suitable reduction treatment.[ Reference Daturi, Bion, Saussey, Lavalley, Hedouin, Seguelong and Blanchard 114 , Reference Haneda, Kintaichi and Hamada 115 ] Daturi et al. found NO can be decomposed when it was introduced to pre-reduced CeO2, where the amount of oxygen vacancies on the surface played an significant role in the decomposition reaction.[ Reference Daturi, Bion, Saussey, Lavalley, Hedouin, Seguelong and Blanchard 114 ] In most practical reactions, excess O2 is presented, thus selective catalytic reduction (SCR) of NO x using urea or ammonia is needed. Fang et al. recently prepared highly dispersed ceria NPs on carbon nanotubes (CNTs) for SCR of NO with NH3 and found a strong interaction between the ceria NPs and the CNTs.[ Reference Fang, Zhang, Shi, Gao, Li, Ye and Zhang 116 ]. The best CeO2/CNTs catalyst showed a good NH3-SCR activity at the temperature range of 150–380 °C as well as outstanding stability and good SO2 or H2O resistance. Moreover, ceria is one of the most important components, which can provide a significant amount of oxygen vacancies to adsorb and activate molecular oxygens to form active oxygen species during the SCR reactions. A series of composite oxides such as Cu–Ce–O,[ Reference Yao, Gao, Yu, Qi, Tang, Dong and Chen 117 , Reference Chen, Si, Wu and Weng 118 ] Ni–Ce–O,[ Reference Maitarad, Han, Zhang, Shi, Namuangruk and Rungrotmongkol 119 ] W–Ce–O,[ Reference Peng, Li, Chen, Chen, Han, Zhang and Han 120 ] and Mn–Ce–O[ Reference Xiong, Liao, Xiao, Dang and Yang 121 , Reference Yang, Liao, Xiong, Qi, Dang, Xiao and Li 122 ] have been developed for SCR reaction, most of which perform with a highly efficient conversion of NO by the SCR process at low temperature.
Photocatalysis
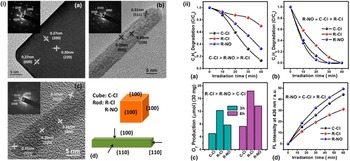
To date, photocatalysis has been considered as a promising technique for sustainable energy generation, air pollutant removal and water treatment. Recently, Jiang et al. compared the heterogeneous photoreactivity of CeO2 NCs with well-defined crystal facets in a series of reactions, such as photocatalytic oxidation of volatile organic compounds, O2 evolution, and ·OH generation, as shown in Fig. 11.[ Reference Li and Shen 1 Reference Strandwitz and Stucky 23 ] They proved that surface defects such as Ce3+ ions and oxygen vacancies were the dominant surface factor in determining the final photoreactivity orders, which greatly influence the activation of reactants as well as the mobility of surface lattice oxygen. Moreover, a novel crystal facet-based CeO2 homojunction consisting of hexahedron prism-anchored octahedron with an exposed prism surface of {100} facets and octahedron surface of {111} facets was synthesized through solution-based epitaxial growth by Li et al. recently.[ Reference Li, Zhou, Zhao, Xu, Wang, Xiao and Zou 39 ] As displayed in Fig. 12, the growth of the ceria prism arm significantly promoted the activity of inert octahedron for photocatalytic reduction of CO2 into methane, which is attributed to a synergistic effect of three factors: electrons and holes are driven by band alignment of the {100} and {111} to octahedron and prism surfaces, respectively; the coherent interfacial lattice alignment between two units of homojunction provides convenient and fast channels for the photogenerated carrier transportation; different effective mass of electrons and holes on (100) and {111} faces leads to high charge carrier mobility, facilitating the charge separation.[ Reference Li, Zhou, Zhao, Xu, Wang, Xiao and Zou 39 ] This kind of facet-based ceria homojunction provides a new concept for the efficient separation and fast transfer of photoinduced charge carriers and promoting activities of photocatalysts.
(i) HRTEM images of C-Cl (a) view along [001], R-Cl (b), and R-NO (c) view along [110]. Insets are corresponding SAED patterns. Geometric models of CeO2 nanocubes and nanorods (d). (ii) Photocatalytic degradation of propane (a) and propene (b). Oxygen evolution from water in the presence of AgNO3 (c). Temporal evolution of fluorescence intensity at 426 nm (d). The notes inside each panel are the apparent reactivity orders before normalized by the BET surface areas. Reproduced with permission from Ref. Reference Jiang, Wang, Zhang, Zheng and Wang123, copyright 2015 American Chemical Society.

Specific CH4 evolution activities of CP0, CP1, CP2, and CP3 (0.5 %wt Pt, 0.5 %wt MnO x loaded) (a); CH4 and O2 generation rates of CP0, CP1, CP2, and CP3 with 0.5 %wt Pt loaded (b). Reproduced with permission from Ref. Reference Li, Zhou, Zhao, Xu, Wang, Xiao and Zou39, copyright 2015 American Chemical Society.

Solid oxide fuel cells (SOFCs)
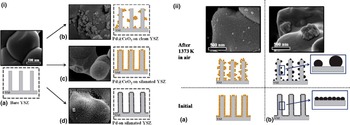
SOFCs have attracted numerous attention because of high-efficiency conversion of chemical fuel into electric power, much lower emissions of sulfur and nitrogen oxides and hydrocarbon pollutants compared with traditional power plants, and reduced green house gas emissions. It holds a great potential for power generation in both stationary and portable, as well as transportional applications given the increasing demand for sustainable energy resources.[ Reference Adler 124 , Reference Ormerod 125 ] The whole process of SOFC includes reduction of O2, diffusion of O2− and oxidation of fuel, which generally need to be operated at high temperature to enable diffusion of O2− and activate fuel molecules. However, the by-products such as carbon deposited on the anode greatly influence the process of SOFC. Ceria-based materials have been found to be resistant to carbon deposition and promote catalytic activity for the oxidation of fuels significantly.[ Reference Gorte, Park, Vohs and Wang 126 – Reference He, Gorte and Vohs 130 ] Gorte and co-workers used a composite anode of copper-doped ceria (or samaria-doped ceria) for a SOFC at 973 and 1073 K, which can directly electrochemically oxidize a series of hydrocarbons such as methane, ethane, 1-butene, n-butane, and toluene into water and CO2.[ Reference Park, Vohs and Gorte 127 ] The ceria-based anode used in their study exhibited a high sulfur tolerance and good redox stability, which is attributed to the superior activity of CeO2.[ Reference He, Gorte and Vohs 130 ] Under the SOFC operating condition, the loss of activity due to sintering of metal NPs becomes a great issue in the practical applications. As mentioned in the CO oxidation section, ceria can be used as an active protecting layer for preventing the metal NPs from sintering. As shown in Fig. 13, Adijanto et al. designed an active Pd@CeO2 nanocomposites with a Pd NP core coated with a porous CeO2 shell for SOFC anodes, which showed good electrochemical performance when operating with either H2 or CH4 fuels at 973 K and also high stability even after annealing the anode in air at 1173 K.[ Reference Adijanto, Sampath, Yu, Cargnello, Fornasiero, Gorte and Vohs 131 ]
(i) SEM images along with schematic representations of the bare YSZ matrix (panel A), Pd@CeO2 nanoparticles deposited on a clean YSZ porous electrode (panel B) and silanated YSZ porous electrode (panel C). Uncoated Pd nanoparticles (2 nm) deposited on silanated YSZ porous electrode (panel D). All samples calcined at 973 K in air, and the magnification is the same in all the images. (ii) SEM images, with the schematic representation of the agglomeration of Pd@CeO2 (panel A) and 2 nm uncoated Pd (panel B) nanoparticles deposited on silanated YSZ porous electrode after samples calcined at 1373 K in air. Reproduced with permission from Ref. Reference Adijanto, Sampath, Yu, Cargnello, Fornasiero, Gorte and Vohs131, copyright 2013 American Chemical Society.

Chemical sensors
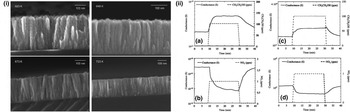
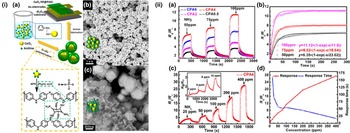
Solid-state gas sensing devices have been extensively applied in many industrial areas, which detect the targeted gas by means of selective chemical reaction with suitable reagents.[ Reference Korotcenkov 132 ] In the past few decades, ceria has been promised as a good candidate material for oxygen and water vapor gas sensors.[ Reference Fu, Wang, Yu, Wang and Wang 133 – Reference Zhang, Gao, Cai, Liu, Guo and Gao 136 ] Barreca et al. reported a simple catalyst-free chemical vapor deposition process for preparation of supported columnar ceria nanostructures at low temperature (623 K), as shown in Fig. 14(i).[ Reference Barreca, Gasparotto, Maccato, Maragno and Tondello 137 ] The deposited nanostructured ceria thin films were used to detect gaseous ethanol and nitrogen dioxide. Figure 14(ii) shows the isothermal conductance variation for a representative columnar ceria nanostructure and continuous ceria layer specimen upon exposure to CH3CH2OH and NO2 at 200 °C. The sensor response of nanostructured columnar ceria is much higher than the continuous CeO2 thin film especially at the relatively low working temperature.[ Reference Barreca, Gasparotto, Maccato, Maragno, Tondello, Comini and Sberveglieri 138 ] Recently, a core–shell nanocomposites of CeO2 NPs conformally coated by cross-linked PANI hydrogel was developed for a room-temperature NH3 gas sensor with high response and great long-term stability by Wang et al.[ Reference Wang, Huang, Xiao, Cai, Liu, Liu, Wang, Wang, Li and Wang 139 ] Fig. 15 shows the basic schematics of fabrication, morphologies of core–shell nanocomposites and the response of NH3 exposure under different concentrations at room temperature. This novel core–shell composite sensor exhibited an excellent response to a wide range of NH3 and the detection limit of NH3 concentration can be as low as 2 ppm, which could be ascribed to the rough PANI shell with large specific surface area and thus enhanced contact area with gas, together with the existence of p–n junctions by CeO2 NPs and PANI shell.[ Reference Wang, Huang, Xiao, Cai, Liu, Liu, Wang, Wang, Li and Wang 139 ]
(i) Selected cross-section FE-SEM micrographs of CeO2-based specimens obtained at different substrate temperatures. Reprinted with permission from Ref. Reference Barreca, Gasparotto, Maccato, Maragno and Tondello137, copyright 2006 American Chemical Society. (ii) Response of columnar ceria nanostructures deposited on Al2O3 at 400 °C to: (a) CH3CH2OH; (b) NO2. In both cases, the working temperature and relative humidity were 200 °C and 40%, respectively. Response of a continuous ceria layer deposited on Al2O3 at 400 °C to: (c) CH3CH2OH; (d) NO2. In both cases, the working temperature and relative humidity were 200 °C and 40%, respectively. Reprinted with permission from Ref. Reference Barreca, Gasparotto, Maccato, Maragno, Tondello, Comini and Sberveglieri138, copyright 2007 IOP publishing.

(i) (a) Schematics of the fabrication of PANI hydrogel/CeO2 core/shell gas sensors. (b) SEM image of CPA4 shows well-defined core/shell structure in proper CeO2/aniline ratio. (c) SEM image of CPA0.5 exhibits three-dimensional network structure by existing homogeneously grown PANI hydrogel. (ii) (a) Response curves of CPA0.5 to CPA6 upon sequential exposure of 50, 75, and 100 ppm of NH3. (b) Fitted curves (solid lines) and experimental results (scattered points) of CPA4 to 50, 75, 100 ppm of NH3. (c) Reversible and reproducible responses of CPA4 to different concentrations of NH3. Inset is transient response of sequential exposure to 2, 4, 8, and 16 ppm of NH3. (d) Response and response time of CPA4 to various NH3 concentrations. Reproduced with permission from Ref. Reference Wang, Huang, Xiao, Cai, Liu, Liu, Wang, Wang, Li and Wang139, copyright 2014 American Chemical Society.

Conclusions and perspectives
As an advanced support materials, ceria is a good candidate for dispersing and stabilizing active noble metal NPs in many catalyst systems. On the other hand, it can function as an active component through participating in reactions with lattice oxygens, which has attracted a lot of attentions. While significant progress has been made in the fabrication of nanostructured ceria-based materials, a diverse array of related applications has also been extensively developed. Considering the future, some good opportunities and challenges lie ahead for materials scientists and engineers to further understand the structural and chemical evolutions of ceria-based materials, and explore their new applications. Critically the challenges involve various important aspects such as defect manipulation, scale-up synthesis, as well as monolithic device enabling, which may have great implications toward various energy and environmental applications.[ Reference Montini, Melchionna, Monai and Fornasiero 140 – Reference Paier, Penschke and Sauer 143 ]
Defect control and retainment
It is known that the point defects such as oxygen vacancies in ceria play an important role in various energy and environmental catalysis applications. Through controlling the density and the characteristics of point defects, the reactivity of ceria-based materials can be tailored. Some successful approaches have been reported for creating abundant defects in the ceria nanostructures, such as low-pressure thermally annealed ceria nanostructures,[ Reference Lawrence, Brewer, Wang, Wu, Wells-Kingsbury, Ihrig, Wang, Soo, Mei and Cheung 144 ] pits confined in an ceria thin sheet,[ Reference Sun, Liu, Gao, Cheng, Lei, Sun, Jiang, Su, Wei and Xie 55 ] and hierarchical porous structure.[ Reference Ji, Zhang, Chen and Anpo 31 , Reference Voskanyan, Chan and Li 32 , Reference Li, Zhou, Zhao, Xu, Wang, Xiao and Zou 39 , Reference Rao, Yang, Li, Dong, Fang and Zhang 54 ] In pure nanostructured ceria, although it could be rich in defects and superior in performance, a dramatic loss of defect enabled properties over time is a common setback in the relevant industrial application. Therefore, the stability especially the retainment (or readily recovery) of defects (density and states) is still a great challenge for practical applications such as catalytic converters in automotive industry, which usually work under high-temperature and long-time operation harsh environment. As a promising strategy, doping or formation of solid solutions with transition and/or rare earth metals seems to be able to mitigate or address this problem.[ Reference Bao, Zhao, Dai, Lin, Jin, Wang and Muhammad 82 , Reference Binder, Toops, Unocic, Parks and Dai 83 , Reference Ayastuy, Iglesias-González and Gutiérrez-Ortiz 90 , Reference Wang, Shen, Li, Liu, Wang and Chen 100 , Reference Delimaris and Ioannides 102 , Reference Peng, Li, Chen, Chen, Han, Zhang and Han 120 ] In the meantime, it may provide additional benefits such as the boost of redox properties as the introduction of cations with different ionic radii into the ceria lattice induces structural disorder and synergy that produces excess defects and facilitates oxygen release.
Scale-up fabrication
As discussed earlier, while the well-controlled ceria nanostructures usually display excellent properties, the scale-up fabrication remains a challenge for their future application. A series of typical processes, such as hydrothermal, solvothermal, template, electrodeposition and high-temperature chemical vapor deposition methods, haven been used for preparing ceria-related nanostructures. For example, the hydro/solvothermal technique has been applied to get uniform ceria nanostructures such as nanorods, nanowires, hierarchical spheres, and hollow structures, but it is still far from a full understanding of the synthetic process and scale-up of this process is still a challenge. On the other hand, novel core–shell structures with noble metal NPs as cores and ceria as shells exhibited excellent catalytic performances and also may address or mitigate the sintering issue of noble metal NPs.[ Reference Qi, Chen, Li, Li, Gao and Tang 60 , Reference He, Zhao, Zeng, Wang and Han 61 , Reference Wang, Liu, Li, Zhen, Wang and Zhang 65 , Reference Wang, Liu, Song and Zhang 68 ] However, these encouraging results were displayed in a lab scale, developing scalable and cost-effective synthetic processes is desired and essential for industrial applications.
Monolithic devices
Traditionally, application of ceria-related materials involves synthesis of ceria powders first and then assembly into catalyst modules through either pelletizing or wash-coating procedures. In the past few years, novel monolithic devices have been developed by directly integrating functional nanostructures onto 2D planar platforms and 3D configurated substrates.[ Reference Guo, Ren, Xiao, Liu, Sharma, Gao, Mhadeshwar and Gao 40 – Reference Guo, Liu, Ren, Piyadasa and Gao 42 , Reference Ren, Wu, Song, Xiao, Guo, Ding, Suib and Gao 45 , Reference Cai, Zhang, Shi, Xu, Zhang, Huang, Li and Zhang 145 ] Compared with traditional powder-based devices, these devices are cost-effective, robust, multi-functional with better performance. The latest progresses for fabricating ceria-based monolithic devices include columnar CeO2 nanostructures on Si(100),[ Reference Barreca, Gasparotto, Maccato, Maragno and Tondello 137 ] porous CeO2 nanowire arrays on Cu foil[ Reference Lu, Zheng, Gan, Liu, Liang, Liu and Tong 50 ] and CeO2 nanotube arrays on ITO,[ Reference Wang, Zhang, Zhang and Hua 48 ] etc. These nanostructured ceria materials were grown on 2D planar substrates and it is yet to introduce the ceria nanostructure into 3D monolithic substrates. Our group successfully integrated ceria nanotube arrays into 3D monolithic honeycomb through a ZnO nanorod template method, and the resulting monolithic devices showed good performance for CO oxidation but relatively low thermal and mechanical stability.[ Reference Guo, Ren, Xiao, Liu, Sharma, Gao, Mhadeshwar and Gao 40 ] Consequently, it still presents a challenge to develop a cost-effective process for integrating the ceria nanostructure into monolithic platforms.
In summary, ceria is a versatile material, which can be used widely in environmental catalysis and energy. Designing suitable nanostructured ceria has proved to be a promising approach to control its physicochemical properties and then tune its activities. In the near future, more advanced nanostructured ceria-based materials and devices are expected and in need for the practical applications with more in-depth understanding of their underlying chemistry, physics, and engineering.
Acknowledgments
The authors are grateful for the financial support from the US National Science Foundation (Award No. CBET-1344792), and the US Department of Energy (Award Nos. DE-EE0006854 and DE-FE0011577).