Introduction
Overcrowding of the lower frequency bands (like S, C, and Ku bands) for satellite communication and growing future information-driven communication requirements demands exploration of huge bandwidth resource provided by higher frequency bands. In particular, the Q–V band (35–50 GHz) seems to offer very promising perspectives.
High-performance narrow-band band-pass filters having high selectivity and linear phase response consistent with minimum weight and volume will be the key element in high-frequency satellite communication systems. At Q-band, waveguide-based filters are widely being used because of their high Q which in turn provides less insertion loss. But the kind of tolerance required to fabricate these waveguide filters are very much stringent; and invar or super invar materials were used for achieving good thermal compensation of frequency drift over temperature which makes it bulkier. Thus, filters with high Q, compact configuration, and stable performance over temperature are desired.
In [Reference Ishikawa, Hiratsuka, Yamashita and Iio1, Reference Hiratsuka, Sonada, Sakamoto and Ishikawa2], dielectric resonator (DR)-based planar filters at millimeter wave are presented. These filters have Q = 1500, suitable for realizing relatively wideband filters like in receiver where requirement is of rejecting harmonics generated in frequency conversion. Their amplifier can be used for compensating filter loss. The DR [Reference Kobayashi and Minegishi3, Reference Liang and Blair4] operating in TE01δ/TM01δ are widely being used for high-Q filter realization. But at millimeter wave frequencies, these modes are having inferior spurious performance as well as challenges in the fabrication of small-size cylindrical shape. In [Reference Enokihara, Nanba, Nakamura, Ishizaki and Uwano5], DR in rectangular shape operating in TM11δ is presented and having unloaded Q = 2600. Teflon is filled inside cavity for supporting DR, which decreases overall Q. The inline configuration of resonators was introduced but the method for realizing quasi-elliptic filters is not reported. Due to filled Teflon, tunability in filter for resonances and coupling through tuning elements cannot be achieved which in turn required high precision fabrication and assembly. The stability of the filter response over temperature was not stated in the existing literature.
The new filter structure comprising rectangular DR operating in TM11δ mode at Q-band is proposed in this paper. Low dielectric support material is used for holding the DR inside the cavity. Low loss epoxy is used for bonding the support and DR, which provides rigidity to the resonators from the vibration point of view. Tuning screws for tuning resonances and coupling between resonators are introduced to absorb mechanical and electrical tolerances. By proper material selection of DR and precise adjustment in support height, highly stable filter response over temperature is achieved in proposed filter structure.
First, the configuration of resonator, its mode of operation, and unloaded Q measurement in single cavity is described. In Q-band filter section, three-dimensional (3D) electromagnetic (EM) simulation of an eight-pole cross-coupled filter at 38.5 GHz is presented. Measured result and environmental test for satellite application like temperature cycling and vibration test results are described in detail.
Rectangular DR structure
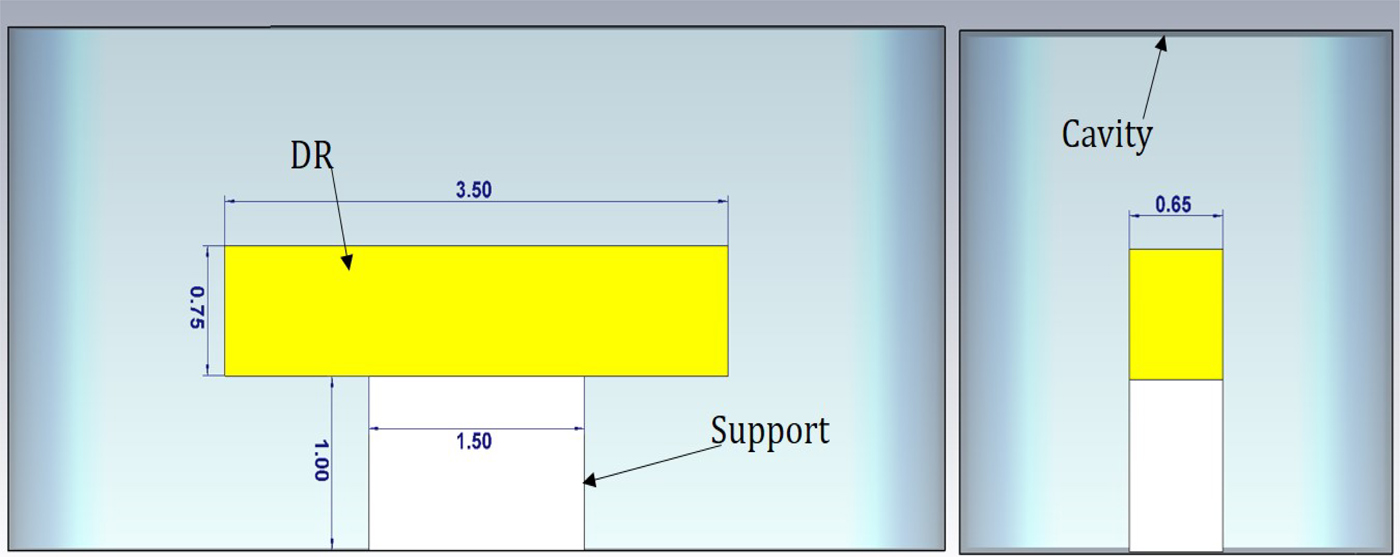
The basic structure of rectangular DR operating in TM11δ mode is shown in Fig. 1. It consists of cavity, rectangular DR, rectangular support, and pedestal. Cavity dimensions are selected such that it provides a cut-off at required frequency band [Reference Enokihara, Nanba, Nakamura, Ishizaki and Uwano5]. For resonance at 38.5 GHz, cavity size comes out to 3 mm × 3 mm × 6 mm. DR material used is BMT ceramic having εr = 24 and tanδ = 0.0002. Support is made of any low dielectric material, fused quartz in the present case. Dimension of rectangular DR is 0.65 × 0.75 × 3.5 mm, while for quartz support, it is 0.65 × 1 × 1.5 mm. Gold plated KOVAR pedestals are used for holding DR and support inside a cavity. Pedestal dimensions are 2.5 × 5 × 2.5 mm and has a groove for holding support. The bottom geometry of pedestal is designed to mount these pedestals from bottom side of the filter without opening the filter cover.
Cross-sectional and side view of rectangular DR.

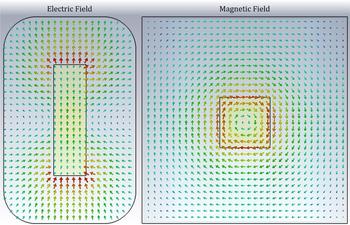
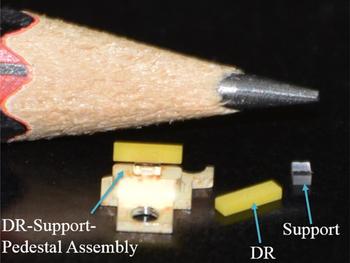
Electric and magnetic field distribution of TM11δ mode in rectangular DR enclosed in the cavity is plotted in Fig. 2. As per field distribution, resonator is more suitable for realizing wideband couplings since more E field are available for realizing couplings. The EM simulation shows unloaded, Q U = 3800 at 38.5 Ghz and next higher order mode is TE01δ at 41.2 GHz. Figure 3 shows the DR–support–pedestal assembly configuration. Individual DR and support are bonded together by low loss space grade epoxy. Special high accuracy alignment zigs were used for aligning DR–support axis. DR–support assembly is further bonded with pedestal using same epoxy.
H- and E-field distribution of TM11δ mode in rectangular DR.

DR–support–pedestal assembly configuration.

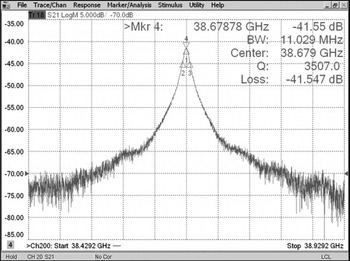
Unloaded Q-factor measurement of epoxy-captured DR–support–pedestal assembly in sliver-plated cavity is presented in Fig. 4. The cavity is exited with low coupling value so as to have minimum effect of external Q factor. The measured result is shown for the unloaded DR–support–pedestal assembly, Q U = 3500 at 38.68 GHz. These DR–support–pedestal assemblies are used for realizing full filter at Q-band.
Measured result for Q of rectangular DR in single cavity.

Q-band filter
Electrical design
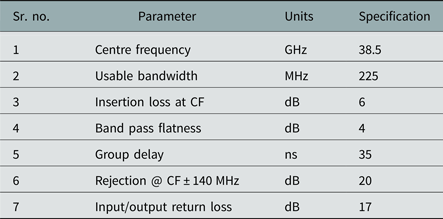
Most of satellite payloads consist of bank of narrow band input filters after Low Noise Amplifiers. Key parameters for the design of input filters are adjacent channel rejection, in-band flatness, and group delay. The target characteristics of Q-band input filter to be realized are shown in Table 1. Using standard synthesis procedure [Reference Cameron6], an eight-pole quasi-elliptic filter with two out-of-band transmission zeros is found more suitable for complying target specifications. The unloaded-Q of filter is required to be >3000. Synthesized filter response considering Q into account is shown in Fig. 5.
Theoretical response of (8-2-0) filter.

Target specification of the filter

Filter configuration
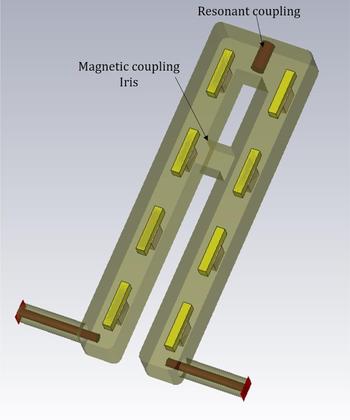
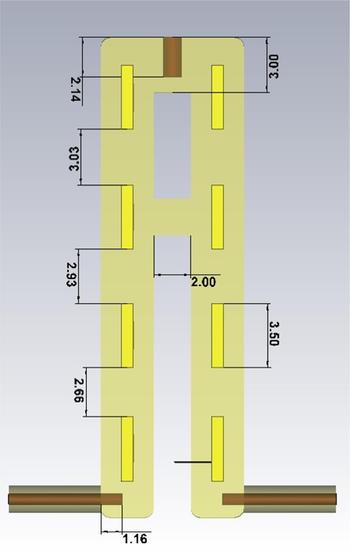
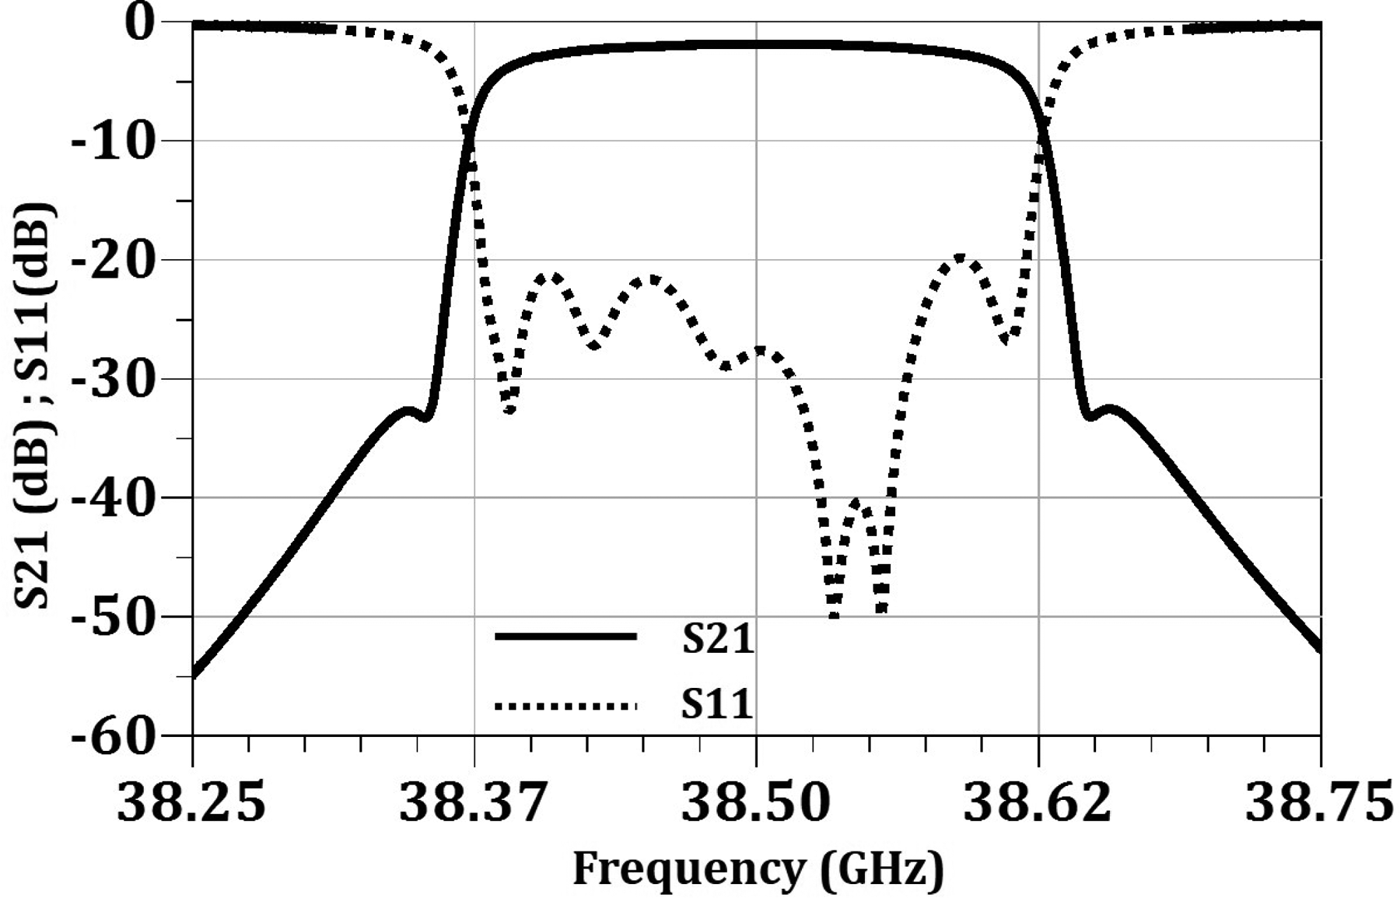
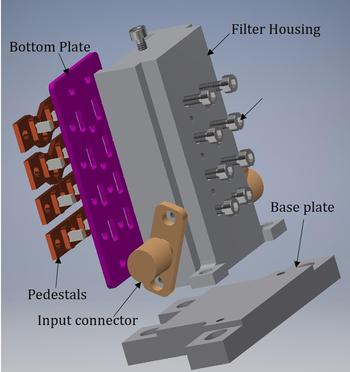
Input filter for Q-band satellite communication link is designed using rectangular TM11δ mode DR. Three-dimensional EM model of an eight-pole cross-coupled filter using rectangular DR is shown in Fig. 6. One cascaded quadruplet [Reference Cameron6] is used for realizing out-of-band transmission zeros. Folded filter topology is implemented to have compact size. The input coupling is realized using coaxial probe which couples electric field of the first resonator. Coupling between inline adjacent resonators is realizing using E-field since the maximum E-filed is concentrated at the resonator ends as shown in Fig. 2. The electric coupling between resonators can be controlled by adjusting spacing between resonators. Negative non-adjacent coupling between resonators is realized using H-field. Magnetic coupling between resonators is controlled by adjusting opening between resonators. Various coupling mechanisms were investigated for realizing the opposite nature coupling in rectangular TM11δ DR like open probe, grounded probe, resonance coupling. Resonance coupling is found more suitable due to its capability to realize wide range of coupling. Here, resonant coupling is tuned to realize electric field coupling. The method presented in [Reference Soni, Ghadiya and Shukla7] is used for identifying the nature of coupling through resonance coupling. Implementation of resonant coupling for realizing opposite nature coupling to have cross-coupled filter configuration in rectangular TM11δ mode DR is reported for the first time. Inter-resonator spacing and magnetic coupling iris dimensions are shown in Fig. 7. Filter housing is symmetric around the axis of resonant coupling element. Simulated response of the filter is presented in Fig. 8. Mechanical CAD model of full filter showing pedestals, bottom plate, I/O connectors, and tuning screws is shown in Fig. 9.
Three-dimensional EM model of Q-band filter.

Dimensional drawing of filter.

Simulation result of Q-band filter.

Mechanical CAD model of filter.

Measurement results
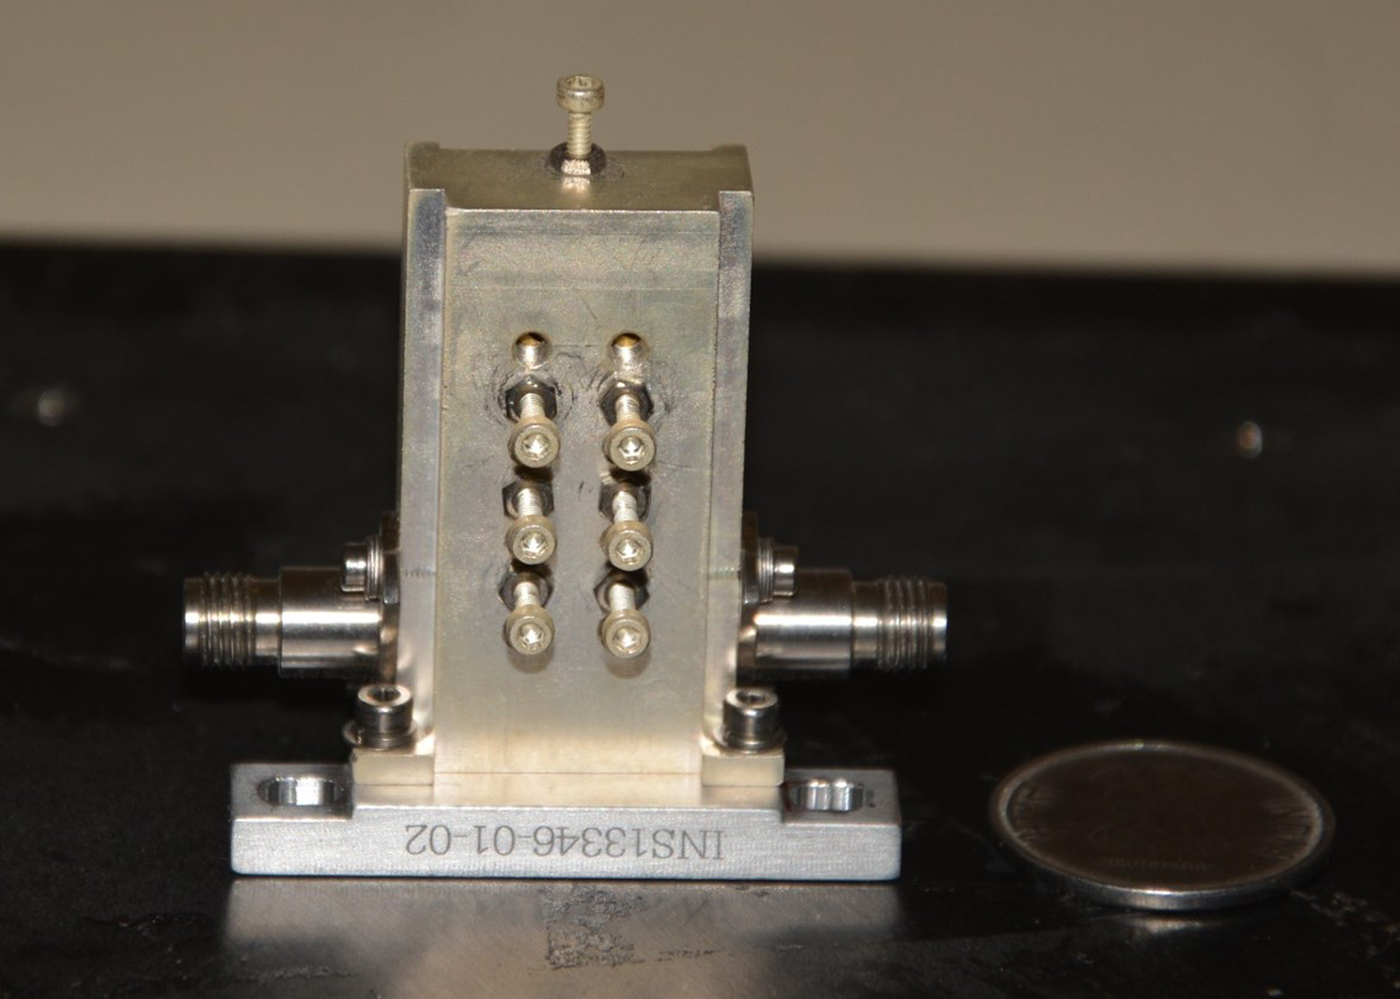
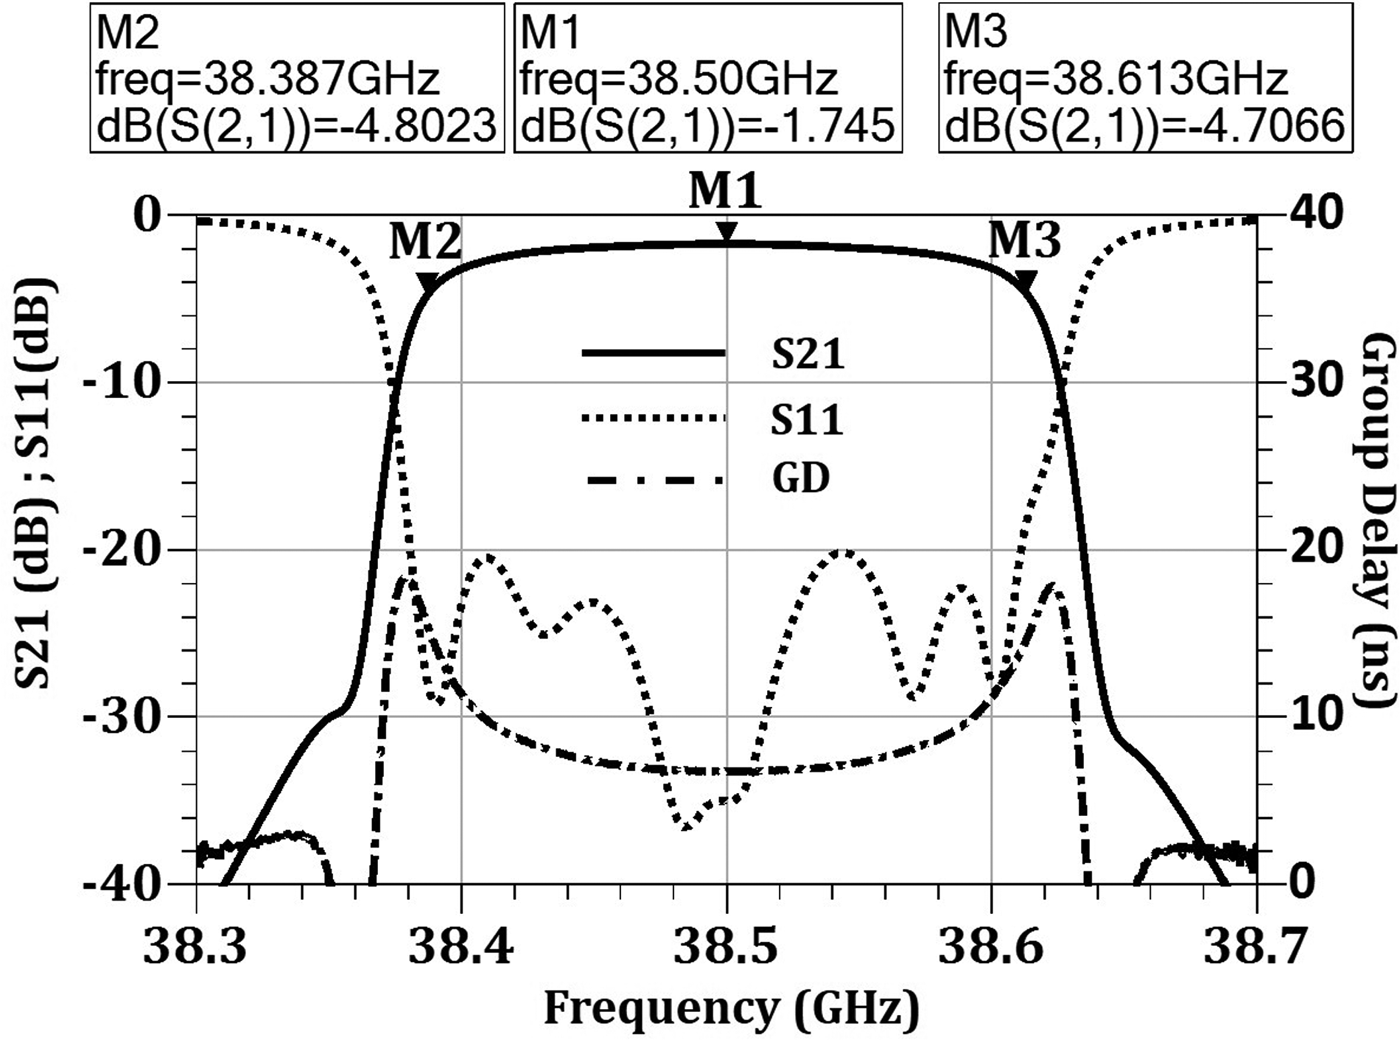
The fabricated filter is shown in Fig. 10. Silver-plated tuning elements are used for resonance and inter-resonator coupling tuning, which relaxes the accuracies required in manufacturing and assembly. The measured filter characteristic of the filter is shown in Fig. 11.
Q-band filter.

Q-band filter measured response.

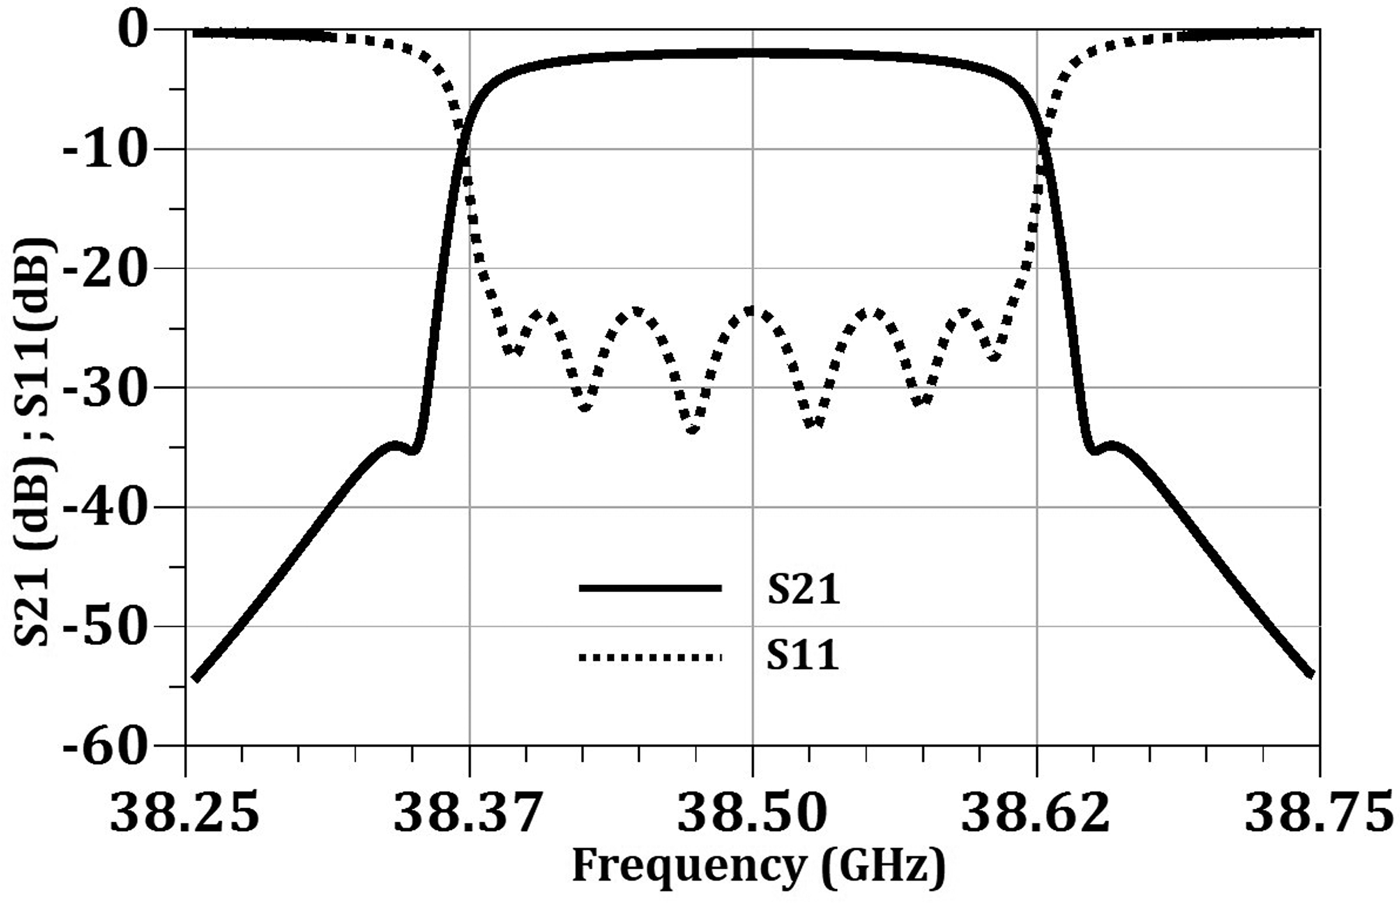
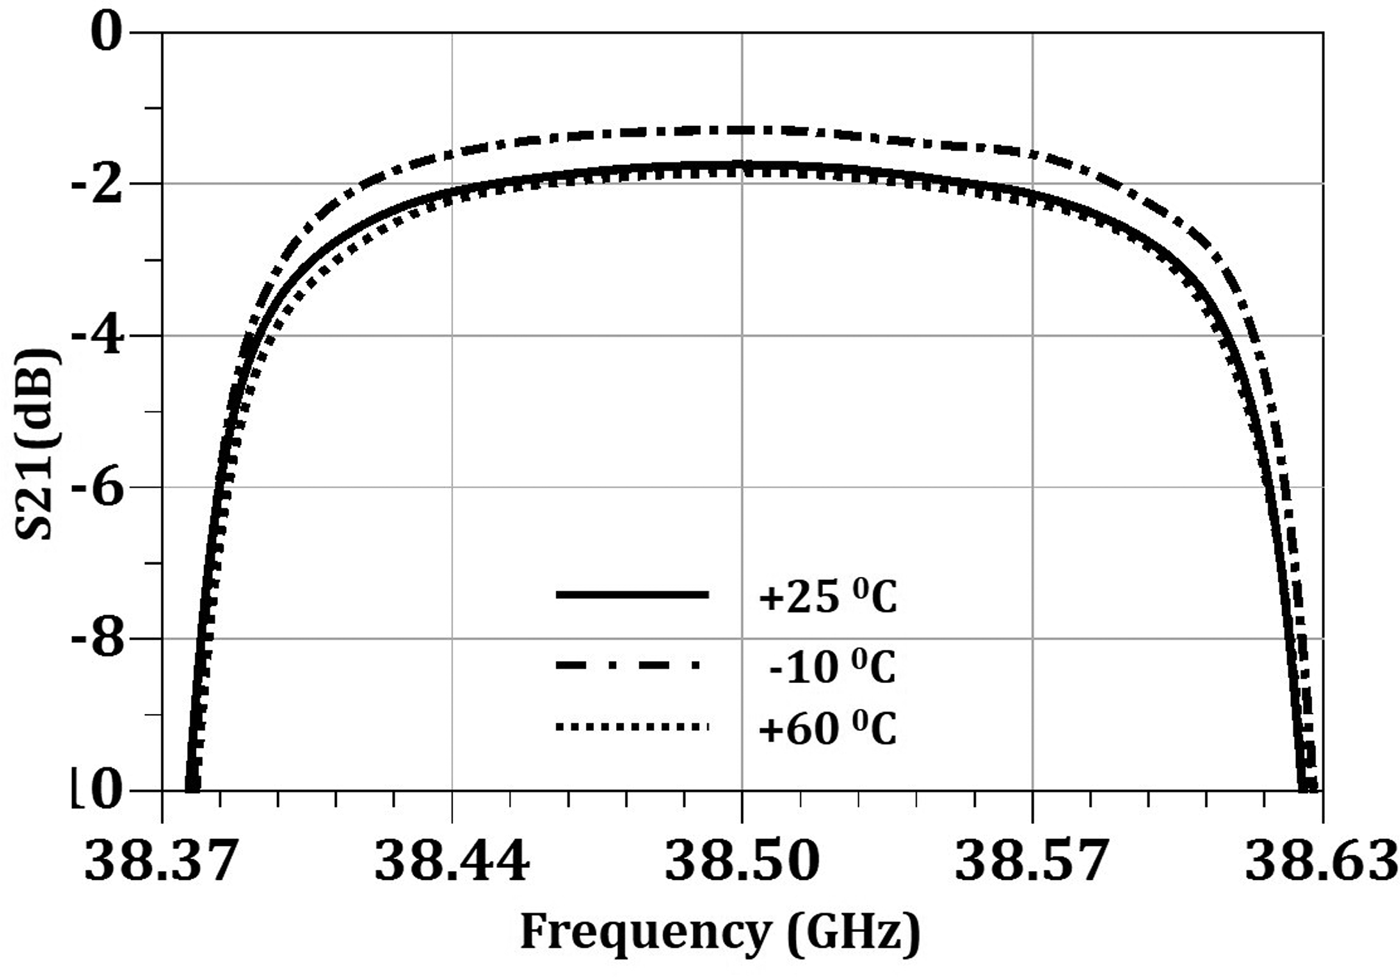
Filter met all the target specifications with good margin. Since the filter is designed for satellite application, it must have good thermal stability over temperature so as to meet the specifications over specified temperature range. Based on the analysis, in rectangular TM11δ mode DR, there are two ways for achieving better thermal stability. One is using appropriate ceramic material having required temperature coefficient of frequency (TCF), and second through proper adjustment in the height of support inside the cavity. Primarily, the frequency drift over temperature is minimized based on proper material selection. But due to tolerances in fabricated mechanical housing, dielectric constant and TCF of ceramic material initially measured frequency drift was 3 ppm/°C. To further reduce frequency drift over temperature, support height in resonator assemblies were accurately adjusted. As the height of support inside the cavity increases, frequency drift over temperature decreases. Temperature characteristic of the filter over −10 °C to +60 °C is shown in Fig. 12. Achieved frequency stability over temperature is <2 ppm/°C. Support height at which required frequency compensation achieved is 1.1 mm.
Temperature characteristic of Q-band filter.

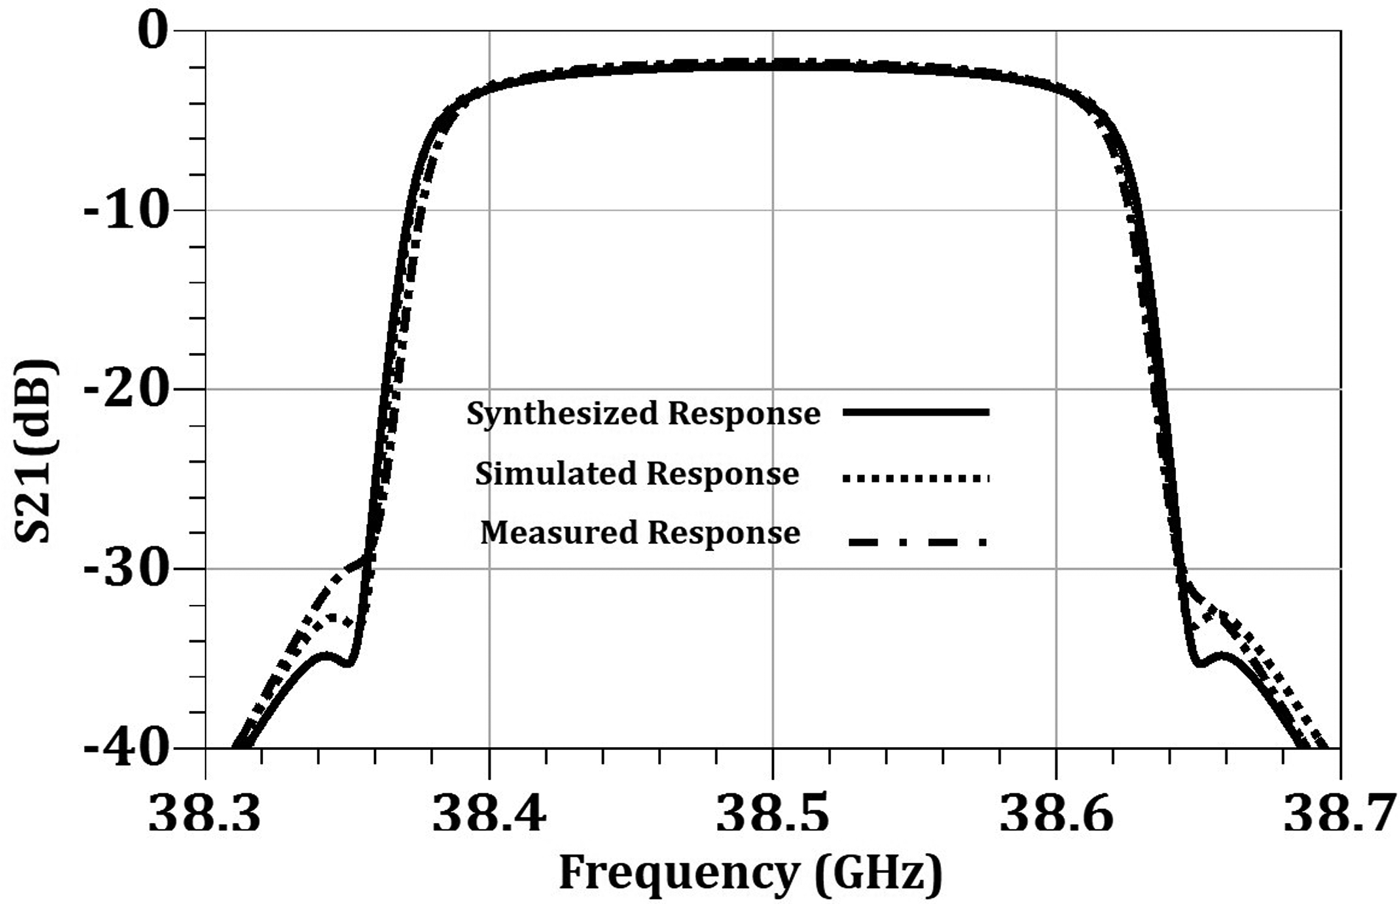
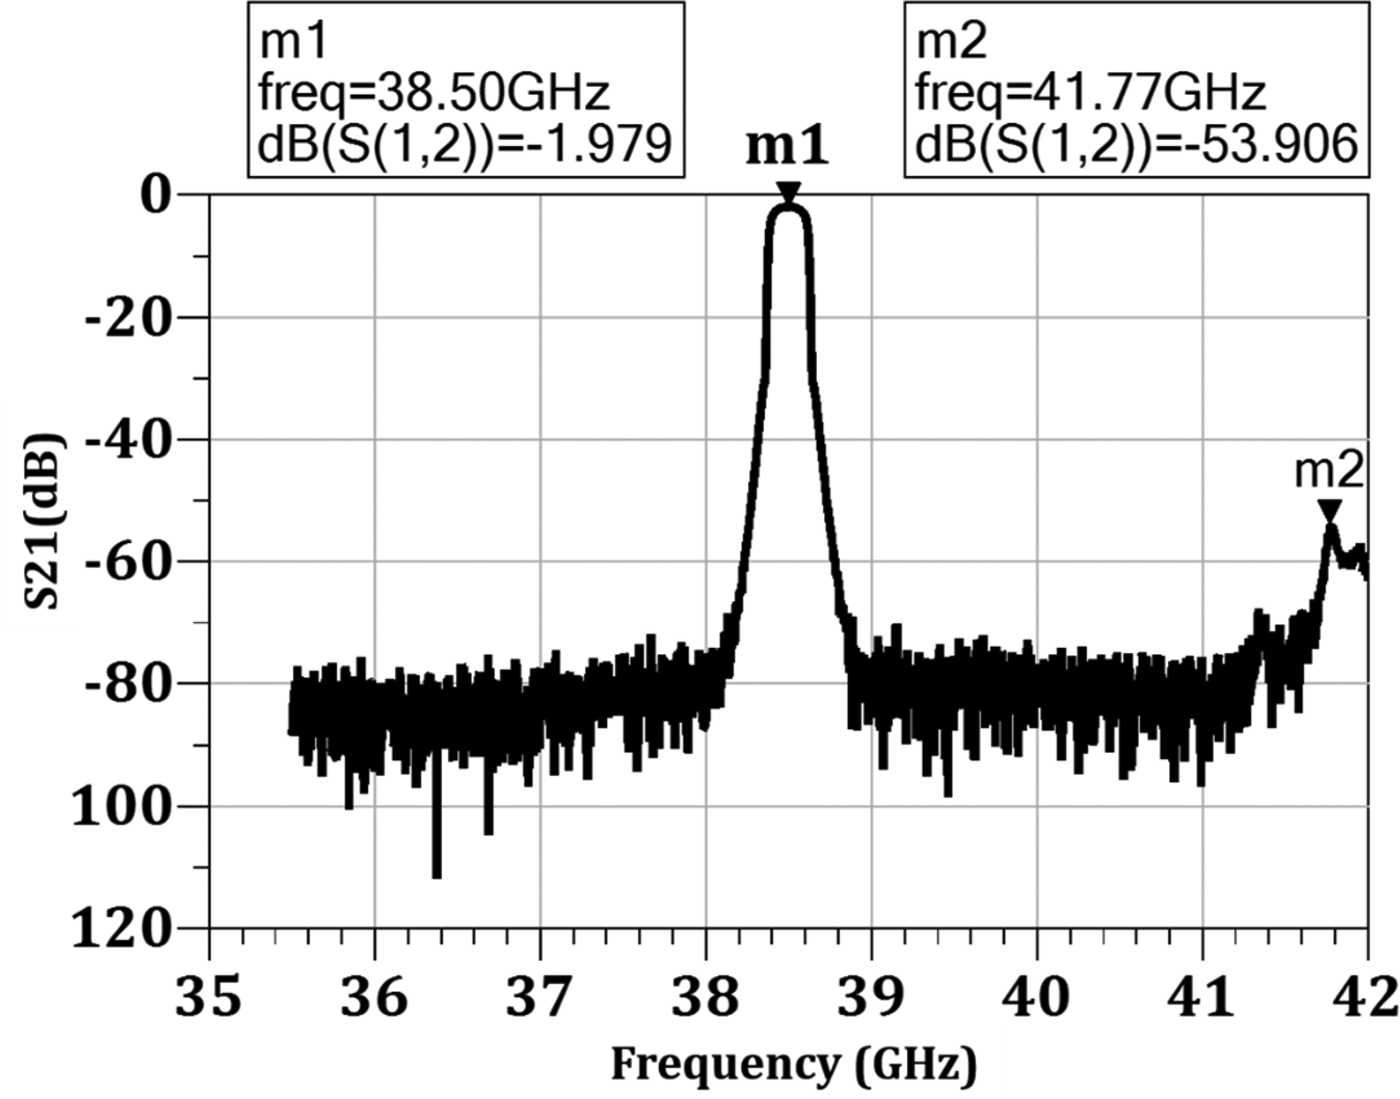
The comparison between synthesized, simulated, and measured transmission response is plotted in Fig. 13. The measured result matches very well with the simulated and synthesized response, except for the side lobe. Practically resonant coupling is realized using INVAR-based self-locking screws. These screws are having silver plating of thickness 1 µm, which is less considering the skin depth at Q-band frequencies. This results in higher loss, and hence blurring of side lobe in transmission response is observed in the measured result. However, all the desired specifications were met over temperature. Wideband transmission response of the fabricated filter is shown in Fig. 14. Filter is having very wide spurious free window. As a part of environmental test for space applications, filter was subjected to severe level sine vibration followed by random vibration test to validate mechanical strength of bonding of DR–support–pedestal assembly of filter. Levels for sine vibrations test are maximum load of 20 g with sweep rate of 2 Octave/min, and for random vibrations test, they are 19.1 g for 120 s.
Comparison of simulated and measured transmission response.

Wideband transmission response of filter.

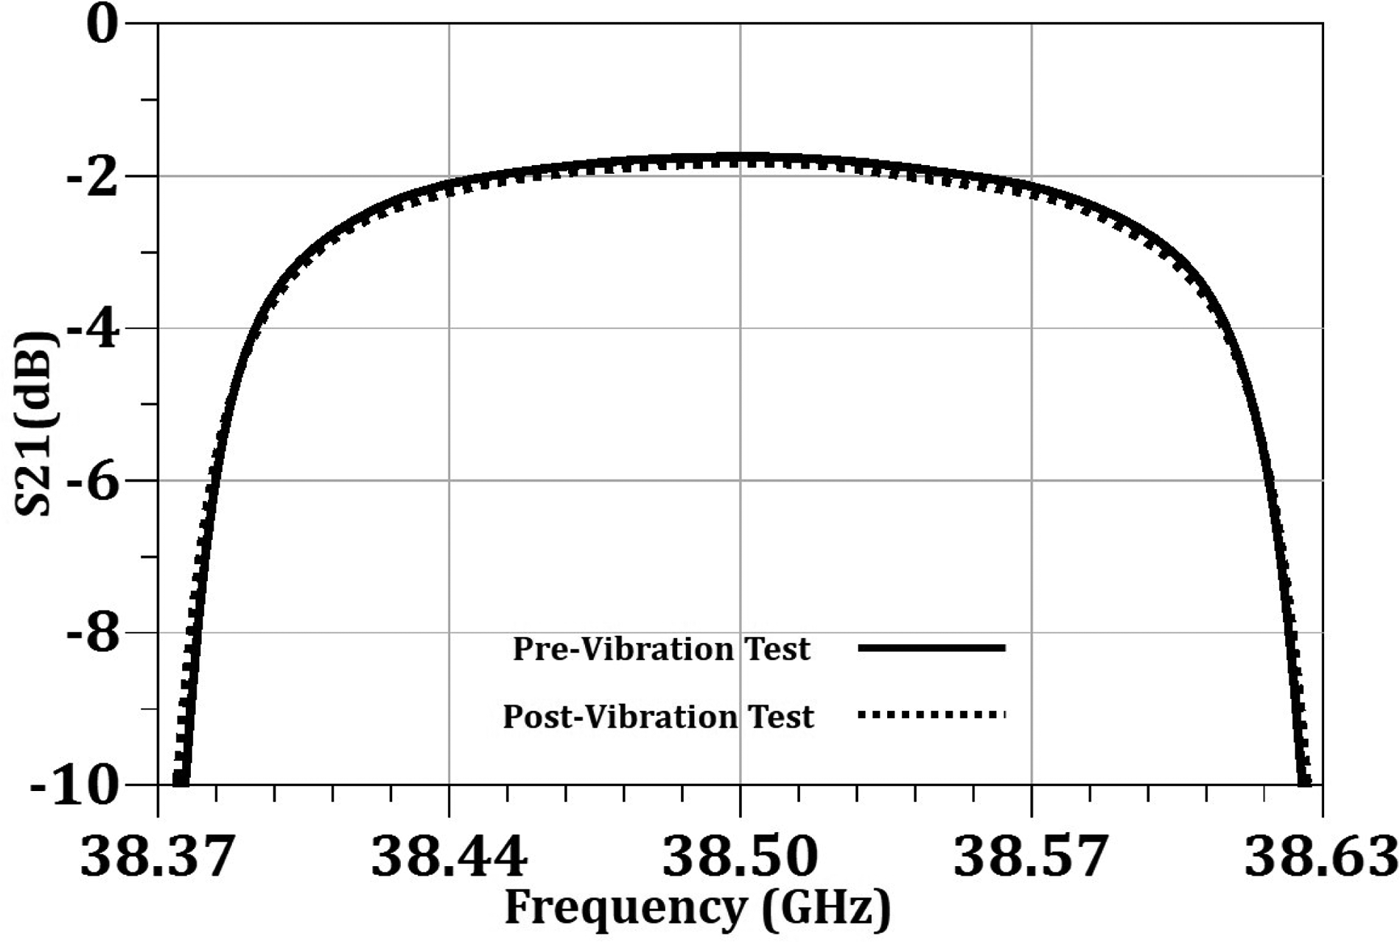
Filter survived both the test in all three mounting axes (X, Y, and Z). Pre and post vibration test electrical performance of the filter is shown in Fig. 15. The filter response remained intact after vibration, which shows the rigidity of filter structure. Post to the vibration test, thermo-vacuum test was conducted. At ambient in a vacuum better than 1.0 × 10⁻⁵ Torr, measured frequency drift was +9 MHz. This shift should be compensated by shifting filter center frequency lower by 9 MHz during ambient characterization. Measured frequency drift over temperature −10 °C to +60 °C in vacuum is better than 2 ppm/°C.
Pre and post vibration test filter characteristic.

Conclusion
Q-band rectangular TM11δ mode DR filter for satellite application having high-Q and excellent temperature stability is proposed. Epoxy-captured Q-band rectangular DR–support–pedestal structure and resonant coupling implementation using TM11δ mode DR are proposed for the first time. An eight-pole cross-coupled input filter was designed using rectangular TM11δ mode DR. The performance of the filter was experimentally verified over temperature −10 to +60 °C in vacuum. The result show very good frequency stability over temperature. Filter structure successfully underwent severe level sine and random vibration test. The filter will be highly useful in the future development of high-frequency communication satellites.
Acknowledgement
The Technology Development Programme (TDP) Committee at SAC, Ahmedabad periodically reviewed the progress and content of the work, for which the authors are thankful. The authors would also like to express sincere gratitude toward Mr. D. K. Das, Associate Director, SAC and Mr. Tapan Misra, Director SAC for their kind encouragement. The authors wish to acknowledge the guidance received from Mr. D K Singh and Mr. Kaushik Parikh.
 Ambrish Ghadiya received the B.E. degree in Electronics and Communication Engineering from DDIT, Nadiad, 2010. He is currently working in Space Applications Centre, ISRO as a Scientist. He is working for design and development of various IMUXs, ultra-narrow band DR filters and couplers at all the bands.
 Shilpi Soni received the B.E. degree in Electronics and Communication Engineering from the IGEC, Sagar, 2000. She is currently working in Space Applications Centre, ISRO as a Head – Payload Filter Division. She had worked for the development of DR-based filters at S, C, and Ku bands; helical resonator-based PSFs; and IMUX filters. High-temperature superconductor-based IMUX filters, LTCC-based power dividers and filters, and RF MEMS-based filter and switch.
 Keyur Trivedi completed bachelors in Mechanical Engineering from V.V.P Engineering college in 2008. Currently he is working as a Scientist/Engineer in Space Applications Centre, ISRO. He is responsible for mechanical design, thermal and structural analysis of RF components like filters, hybrids, and multiplexers.