1 Introduction
The viscosity of blood is a basic biological parameter affecting the blood flow both in large arteries and in microcirculations, and hence studies of haemorheology from the single-cell level to macroscale blood flow have been conducted for many decades (Pedley Reference Pedley1980; Mohandas & Gallagher Reference Mohandas and Gallagher2008; Secomb Reference Secomb2017). Since human blood is a dense suspension consisting of 55 % fluid (plasma) and 45 % blood cells, with over 98 % of the cells being red blood cells (RBCs), hydrodynamic interactions of individual RBCs are of fundamental importance for haemorheology. Despite a number of studies of haemorheology, much is still unknown, in particular about how the single-cell behaviour relates to the behaviour in suspensions and then rheology. Therefore, the objective of this study is to clarify the behaviour of individual RBCs from dilute to dense suspensions, and to elucidate the relationship between behaviours of individual RBCs and haemorheology.
Clarifying the cellular-scale dynamics allows us to build precise continuum models of suspensions (Ishikawa Reference Ishikawa2012; Henríquez-Rivera, Sinha & Graham Reference Henríquez-Rivera, Sinha and Graham2015), and potentially leads us to novel diagnoses about patients with blood diseases (Ito et al.
Reference Ito, Murakami, Sakuma, Tsai, Gutsmann, Brandenburg, Pöschl, Arai, Kaneko and Tanaka2017). Therefore, researchers have made every effort to reveal the dynamics of single RBCs as well as the rheological description of blood flow. By means of experimental observations, the dynamics of single RBCs has been well investigated. For example, RBCs subjected to a low shear rate exhibit rigid-body-like flipping, the so-called tumbling motion (Schmid-Schönbein & Wells Reference Schmid-Schönbein and Wells1969; Fischer Reference Fischer2004; Dupire, Abkarian & Viallat Reference Dupire, Abkarian and Viallat2010), and wheel-like rotation, the so-called rolling motion (Dupire, Socol & Viallat Reference Dupire, Socol and Viallat2012; Lanotte et al.
Reference Lanotte, Mauer, Mendez, Fedosov, Fromental, Claveria, Nicoul, Gompper and Abkarian2016), while RBCs subjected to high shear rates exhibit the so-called tank-treading motion (Schmid-Schönbein & Wells Reference Schmid-Schönbein and Wells1969; Fischer, Stöhr-Liesen & Schmid-Schönbein Reference Fischer, Stöhr-Liesen and Schmid-Schönbein1978; Fischer Reference Fischer2004). The swinging motion was introduced by Abkarian, Faivre & Viallat (Reference Abkarian, Faivre and Viallat2007) as an oscillating orientation of tank-treading motion in the case of relatively low viscosity ratio
 $\unicode[STIX]{x1D706}\sim 0.5$
. By means of numerical simulations, it has been observed that the dynamics transitions from rolling/tumbling to kayaking (or oscillating–swinging) and swinging, following tank-treading motions for a wide range of viscosity ratios (
 $0.1<\unicode[STIX]{x1D706}<10$
) (Cordasco & Bagchi Reference Cordasco and Bagchi2014; Sinha & Graham Reference Sinha and Graham2015). Moreover, recent experimental and numerical studies demonstrated that a rolling or tumbling RBC can shift to a stomatocyte first and finally attaining polylobed shapes (or multilobes) as the shear rate increases with relatively high viscosity ratios (
 $\unicode[STIX]{x1D706}\sim 3$
–5) (Lanotte et al.
Reference Lanotte, Mauer, Mendez, Fedosov, Fromental, Claveria, Nicoul, Gompper and Abkarian2016; Mauer et al.
Reference Mauer, Mendez, Lanotte, Nicoud, Abkarian, Gompper and Fedosov2018). Despite these insights, it is not known how the various motions of individual RBCs affect the bulk suspension rheology.
The rheological description of suspensions, especially of rigid particles, was addressed in the pioneering work by Batchelor (Reference Batchelor1970), showing that stress due to the presence of particles is evaluated using a particle stress tensor, which can be expressed as a summation of stresslets in a domain. Pozrikidis (Reference Pozrikidis1992) analytically derived the effective stresslet of a deformable capsule consisting of an internal fluid enclosed by a thin elastic membrane. It is known that the usual distribution of haemoglobin concentration in individual RBCs ranges from 27 to
 $37~\text{g}~\text{dl}^{-1}$
corresponding to the internal fluid viscosity being
 $\unicode[STIX]{x1D707}_{1}=5$
–15 cP (
 $=5{-}15\times 10^{-3}$
Pa s) (Mohandas & Gallagher Reference Mohandas and Gallagher2008), while the normal plasma (external fluid) viscosity is
 $\unicode[STIX]{x1D707}_{0}=1.1$
–1.3 cP (
 $=1.1{-}1.3\times 10^{-3}$
Pa s) for plasma at
 $37\,^{\circ }\text{C}$
(Harkness & Whittington Reference Harkness and Whittington1970). If the plasma viscosity is set to be
 $\unicode[STIX]{x1D707}_{0}=1.2$
cP, the physiologically relevant viscosity ratio can be taken as
 $\unicode[STIX]{x1D706}~(=\unicode[STIX]{x1D707}_{1}/\unicode[STIX]{x1D707}_{0})=4.2{-}12.5$
. At the single-cell level, the effect of viscosity ratio
 $\unicode[STIX]{x1D706}$
on steady motions has been well investigated (Cordasco, Yazdani & Bagchi Reference Cordasco, Yazdani and Bagchi2014; Mauer et al.
Reference Mauer, Mendez, Lanotte, Nicoud, Abkarian, Gompper and Fedosov2018). In suspensions, numerical studies of the behaviours of deformable particles modelled as neo-Hookean spherical capsules (Clausen, Reasor Jr & Aidun Reference Clausen, Reasor and Aidun2011; Kumar, Henríquez-Rivera & Graham Reference Kumar, Henríquez-Rivera and Graham2014; Matsunaga et al.
Reference Matsunaga, Imai, Yamaguchi and Ishikawa2016) or as viscoelastic materials (Rosti & Brandt Reference Rosti and Brandt2018; Rosti, Brandt & Mitra Reference Rosti, Brandt and Mitra2018) have been conducted, while numerical studies of the behaviours of RBCs modelled as deformable biconcave capsules are still limited (Fedosov et al.
Reference Fedosov, Panb, Caswell, Gomppera and Karniadakis2011; Reasor Jr, Clausen & Aidun Reference Reasor, Clausen and Aidun2013; Gross, Krüger & Varnik Reference Gross, Krüger and Varnik2014; Lanotte et al.
Reference Lanotte, Mauer, Mendez, Fedosov, Fromental, Claveria, Nicoul, Gompper and Abkarian2016), where the shear-thinning behaviour of a suspension of RBCs was systematically investigated. However, it remains unclear how the viscosity ratio
 $\unicode[STIX]{x1D706}$
affects the bulk suspension rheology of RBCs.
Nowadays, a rheological description of blood is important considering the fast-increasing worldwide incidence of diabetes mellitus. Skovborg et al. (Reference Skovborg, Nielsen, Schlichtkrull and Ditzel1966) measured the viscosity of blood from diabetic patients, and found that it was approximately 20 % higher than in controls. Elevated blood viscosity was also found in other haematologic disorders, e.g. multiple myeloma (Dintenfass & Somer Reference Dintenfass and Somer1975; Somer Reference Somer1987) and sickle cell disease (Embury et al.
Reference Embury, Clark, Monroy and Mohandas1984; Evans, Mohandas & Leung Reference Evans, Mohandas and Leung1984). An experimental study using a coaxial cylinder viscometer revealed that the blood from patients with sickle cell anaemia, which is an inherited blood disorder exhibiting heterogeneous cell morphology, had higher haemoglobin concentration resulting in abnormal rheology (Chien, Usami & Bertles Reference Chien, Usami and Bertles1970; Usami et al.
Reference Usami, Chien, Scholtz and Bertles1975; Kaul & Xue Reference Kaul and Xue1991). Numerical study of two-body interactions of RBCs also concluded that the viscosity ratio is one of the most important parameters in haemorheology for the dilute and the semi-dilute regimes (Omori et al.
Reference Omori, Ishikawa, Imai and Yamaguchi2014). As a conventional rheological description, the relative viscosity
 $\unicode[STIX]{x1D707}_{re}$
is often modelled as a polynomial function of the volume fraction
 $\unicode[STIX]{x1D719}$
. For example, Einstein (Reference Einstein1911) proposed the viscosity law for a dilute suspension of rigid particles:
 $\unicode[STIX]{x1D707}_{re}=1+2.5\unicode[STIX]{x1D719}$
; while Taylor (Reference Taylor1932) proposed a modified law for particles including internal fluid:
 $\unicode[STIX]{x1D707}_{re}=1+2.5\tilde{\unicode[STIX]{x1D706}}\unicode[STIX]{x1D719}$
, where
 $\tilde{\unicode[STIX]{x1D706}}$
is Taylor’s factor defined as
 $\tilde{\unicode[STIX]{x1D706}}=(\unicode[STIX]{x1D706}+0.4)/(\unicode[STIX]{x1D706}+1)$
. More recently, such a polynomial approach has been applied to dense suspensions of deformable particles, with high-order terms of
 $\unicode[STIX]{x1D719}$
(Matsunaga et al.
Reference Matsunaga, Imai, Yamaguchi and Ishikawa2016; Rosti & Brandt Reference Rosti and Brandt2018). However, a polynomial law for dense suspensions of non-spherical deformable particles such as RBCs is still missing due to the complexity of the phenomenon.
To obtain a rheological description of RBC suspensions, we investigate the effect of a wide range of viscosity ratios
 $\unicode[STIX]{x1D706}=0.1$
–10, non-dimensional shear rates (capillary number,
 $Ca$
) and volume fractions
 $\unicode[STIX]{x1D719}$
. We performed numerical simulations to study the behaviour of RBCs subjected to various
 $Ca$
in wall-bounded shear flow from dilute suspensions (
 $\unicode[STIX]{x1D719}=6\times 10^{-4}$
; single RBC level) to dense suspensions (
 $\unicode[STIX]{x1D719}=0.41$
). The contribution of individual deformed RBCs to the bulk suspension rheology is quantified by the stresslet tensor (Batchelor Reference Batchelor1970). The RBC is modelled as a biconcave capsule, whose membrane follows the Skalak constitutive law (Skalak et al.
Reference Skalak, Tozeren, Zarda and Chien1973). Since this problem requires heavy computational resources, we resort to graphics processing unit (GPU) computing, using the lattice-Boltzmann method (LBM) for the inner and outer fluid and the finite-element method (FEM) to follow the deformation of the RBC membrane. The models have been successfully applied to the analysis of hydrodynamic interactions between RBCs and leukocytes (Takeishi et al.
Reference Takeishi, Imai, Nakaaki, Yamaguchi and Ishikawa2014), circulating tumour cells (Takeishi et al.
Reference Takeishi, Imai, Yamaguchi and Ishikawa2015) and microparticles/platelets (Takeishi & Imai Reference Takeishi and Imai2017; Takeishi, Imai & Wada Reference Takeishi, Imai and Wada2019) in channel flows.
The remainder of this paper is organized as follows. Section 2 gives the problem statement and numerical methods. Section 3 presents the numerical results for single RBCs and semi-dilute/dense suspensions. Section 4 presents a discussion and comparison between our numerical results and previous experimental/numerical results. This is followed by a summary of the main conclusions in § 5. The validation of our numerical model is described in appendix A.
2 Problem statement
2.1 Flow and cell models
We consider a cellular flow consisting of plasma and RBCs with radius
 $a$
in a rectangular box of size
 $16a\times 10a\times 16a$
along the spanwise
 $x$
, wall-normal
 $y$
and streamwise
 $z$
directions, with a resolution of 8 fluid lattices per radius of RBC. Although the domain size used here has been shown to be adequate for investigating suspensions of rigid and deformable spherical particles in previous studies (Picano et al.
Reference Picano, Breugem, Mitra and Brandt2013; Rosti & Brandt Reference Rosti and Brandt2018), we preliminarily checked its effect for RBCs as well as the effect of the wall (§§ A.2 and A.3). An RBC is modelled as a biconcave capsule of a Newtonian fluid enclosed by a thin elastic membrane, with a major diameter
 $8~\unicode[STIX]{x03BC}\text{m}$
(
 $=2a$
) and maximum thickness
 $2~\unicode[STIX]{x03BC}\text{m}$
(
 $=a/2$
). Although some recent numerical studies argued about the stress-free shape of RBCs (Peng, Mashayekh & Zhu Reference Peng, Mashayekh and Zhu2014; Tsubota, Wada & Liu Reference Tsubota, Wada and Liu2014; Sinha & Graham Reference Sinha and Graham2015), we define the initial shape of an RBC as a biconcave shape.
The shear flow is generated by moving the top and bottom walls located at
 $y=\pm H/2$
with constant velocity
 $U_{wall}=\pm \dot{\unicode[STIX]{x1D6FE}}H/2$
, where
 $H$
(
 $=10a$
) is the domain height and
 $\dot{\unicode[STIX]{x1D6FE}}$
(
 $=U_{c}/a$
) is the shear rate defined using the characteristic velocity
 $U_{c}$
. Periodic boundary conditions are imposed on the two homogeneous directions (
 $x$
and
 $z$
directions). The cytoplasmic viscosity is taken to be
 $\unicode[STIX]{x1D707}_{1}=6.0\times 10^{-3}$
Pa s, which is five times higher than the plasma viscosity:
 $\unicode[STIX]{x1D707}_{0}=1.2\times 10^{-3}$
Pa s (Harkness & Whittington Reference Harkness and Whittington1970). Hence, in our study, the physiologically relevant viscosity ratio is set to be
 $\unicode[STIX]{x1D706}~(=\unicode[STIX]{x1D707}_{1}/\unicode[STIX]{x1D707}_{0})=5$
, and the range of viscosity ratios
 $\unicode[STIX]{x1D706}=0.1$
–10 are considered. The problem is characterized by the capillary number (
 $Ca$
) as
 $$\begin{eqnarray}Ca=\frac{\unicode[STIX]{x1D707}_{0}U_{c}}{G_{s}}=\frac{\unicode[STIX]{x1D707}_{0}\dot{\unicode[STIX]{x1D6FE}}a}{G_{s}},\end{eqnarray}$$
where
 $G_{s}$
is the surface shear elastic modulus. To counter the computational costs, we set
 $Re=\unicode[STIX]{x1D70C}U_{c}a/\unicode[STIX]{x1D707}_{0}=0.2$
, where
 $\unicode[STIX]{x1D70C}$
is the plasma density. This value well represents capsule dynamics in unbounded shear flows solved by the boundary integral method (BIM) in Stokes flow (Omori et al.
Reference Omori, Imai, Yamaguchi and Ishikawa2012; Matsunaga et al.
Reference Matsunaga, Imai, Yamaguchi and Ishikawa2016) (see also §§ A.1 and A.3). In this study, the range of
 $Ca=0.05$
–1.2 is considered covering typical venule wall-shear rate of
 $333~\text{s}^{-1}$
(Koutsiaris, Tachmitzi & Batis Reference Koutsiaris, Tachmitzi and Batis2013), corresponding to
 $Ca=0.4$
, and arteriole wall-shear rate of
 $670~\text{s}^{-1}$
(Koutsiaris et al.
Reference Koutsiaris, Tachmitzi, Batis, Kotoula, Karabatsas, Tsironi and Chatzoulis2007), corresponding to
 $Ca=0.8$
.
The membrane is modelled as an isotropic and hyperelastic material. The surface deformation gradient tensor
 $\unicode[STIX]{x1D641}_{s}$
is given by
 $$\begin{eqnarray}\text{d}\boldsymbol{x}_{m}=\unicode[STIX]{x1D641}_{s}\boldsymbol{\cdot }\text{d}\boldsymbol{X}_{m},\end{eqnarray}$$
where
 $\boldsymbol{X}_{m}$
and
 $\boldsymbol{x}_{m}$
are the membrane material points of the reference and deformed states, respectively. The local deformation of the membrane can be measured by the Green–Lagrange strain tensor
 $$\begin{eqnarray}\unicode[STIX]{x1D640}={\textstyle \frac{1}{2}}(\unicode[STIX]{x1D63E}-\unicode[STIX]{x1D644}_{s}),\end{eqnarray}$$
where
 $\unicode[STIX]{x1D644}_{s}$
is the tangential projection operator. The two invariants of the in-plane strain tensor
 $\unicode[STIX]{x1D640}$
can be given by
 $$\begin{eqnarray}I_{1}=\unicode[STIX]{x1D706}_{1}^{2}+\unicode[STIX]{x1D706}_{2}^{2}-2,\quad I_{2}=\unicode[STIX]{x1D706}_{1}^{2}\unicode[STIX]{x1D706}_{2}^{2}-1=J_{s}^{2}-1,\end{eqnarray}$$
where
 $\unicode[STIX]{x1D706}_{1}$
and
 $\unicode[STIX]{x1D706}_{2}$
are the principal extension ratios. The Jacobian
 $J_{s}=\unicode[STIX]{x1D706}_{1}\unicode[STIX]{x1D706}_{2}$
expresses the ratio of the deformed to the reference surface areas. The elastic stresses in an infinitely thin membrane are replaced by elastic tensions. The Cauchy tension
 $\unicode[STIX]{x1D64F}$
can be related to an elastic strain energy per unit area,
 $w_{s}(I_{1},I_{2})$
:
 $$\begin{eqnarray}\unicode[STIX]{x1D64F}=\frac{1}{J_{s}}\unicode[STIX]{x1D641}_{s}\boldsymbol{\cdot }\frac{\unicode[STIX]{x2202}w_{s}(I_{1},I_{2})}{\unicode[STIX]{x2202}\unicode[STIX]{x1D640}}\boldsymbol{\cdot }\unicode[STIX]{x1D641}_{s}^{\text{T}},\end{eqnarray}$$
where the strain energy function
 $w_{s}$
satisfies the Skalak (SK) constitutive law (Skalak et al.
Reference Skalak, Tozeren, Zarda and Chien1973)
 $$\begin{eqnarray}w_{s}^{SK}=\frac{G_{s}}{4}(I_{1}^{2}+2I_{1}-2I_{2}+CI_{2}^{2}),\end{eqnarray}$$
with
 $C$
being a coefficient representing the area incompressibility. In this study, we set
 $G_{s}=4~\unicode[STIX]{x03BC}\text{N}~\text{m}^{-1}$
and
 $C=10^{2}$
. Bending resistance is also considered (Li et al.
Reference Li, Dao, Lim and Suresh2005), with a bending modulus
 $k_{b}=5.0\times 10^{-19}$
J (Puig-de-Morales-Marinkovic et al.
Reference Puig-de-Morales-Marinkovic, Turner, Butler, Fredberg and Suresh2007). These values successfully reproduce the deformation of RBCs in shear flow and also the thickness of the cell-depleted peripheral layer; see § A.1 (Takeishi et al.
Reference Takeishi, Imai, Nakaaki, Yamaguchi and Ishikawa2014).
2.2 Numerical method
The in-plane elastic tensions
 $\unicode[STIX]{x1D64F}$
are obtained from the SK constitutive law (2.6). Neglecting inertial effects on the membrane deformation, the static local equilibrium equation of the membrane is given by
 $$\begin{eqnarray}\unicode[STIX]{x1D735}_{s}\boldsymbol{\cdot }\unicode[STIX]{x1D64F}+\boldsymbol{q}=\mathbf{0},\end{eqnarray}$$
where
 $\unicode[STIX]{x1D735}_{s}$
is the surface gradient operator. Based on the virtual work principle, the above strong form (2.7) can be rewritten in weak form as
 $$\begin{eqnarray}\int _{S}\hat{\boldsymbol{u}}\boldsymbol{\cdot }\boldsymbol{q}\,\text{d}S=\int _{S}\hat{\unicode[STIX]{x1D750}}\boldsymbol{ : }\unicode[STIX]{x1D64F}\,\text{d}S,\end{eqnarray}$$
where
 $\hat{\boldsymbol{u}}$
and
 $\hat{\unicode[STIX]{x1D750}}=(\unicode[STIX]{x1D735}_{s}\hat{\boldsymbol{u}}+\unicode[STIX]{x1D735}_{s}\hat{\boldsymbol{u}}^{\text{T}})/2$
are the virtual displacement and virtual strain, respectively. The FEM is used to solve (2.8) and obtain the load
 $\boldsymbol{q}$
acting on the membrane (see also Walter et al.
Reference Walter, Salsac, Barthés-Biesel and Tallec2010).
The LBM based on the D3Q19 model (Chen & Doolen Reference Chen and Doolen1998; Dupin et al. Reference Dupin, Halliday, Care, Alboul and Munn2007) is used to solve the fluid velocity field in the plasma and cytoplasm within the RBC membrane. In the LBM, the macroscopic flow is obtained by collision and streaming of hypothetical particles described by the lattice-Boltzmann Bhatnagar–Gross–Krook equation (Bhatnagar, Gross & Krook Reference Bhatnagar, Gross and Krook1954), which is given as
 $$\begin{eqnarray}f_{i}(\boldsymbol{x}_{f}+\boldsymbol{c}_{i}\unicode[STIX]{x0394}t,t+\unicode[STIX]{x0394}t)-f(\boldsymbol{x}_{f},t)=-\frac{1}{\unicode[STIX]{x1D70F}}[f_{i}(\boldsymbol{x}_{f},t)-f_{i}^{eq}(\boldsymbol{x}_{f},t)]+F_{i}\unicode[STIX]{x0394}t,\end{eqnarray}$$
where
 $f_{i}$
is the particle distribution function for particles with velocity
 $\boldsymbol{c}_{i}$
(
 $i=0$
–18) at the fluid node
 $\boldsymbol{x}_{f}$
,
 $\unicode[STIX]{x0394}t$
is the time step size,
 $f_{i}^{eq}$
is the equilibrium distribution function and
 $\unicode[STIX]{x1D70F}$
is the non-dimensional relaxation time. The external force term
 $F_{i}$
can be written as
 $$\begin{eqnarray}F_{i}=\left(1-\frac{1}{2\unicode[STIX]{x1D70F}}\right)w_{i}\left[\frac{\boldsymbol{c}_{i}-\boldsymbol{v}}{c_{s}^{2}}+\frac{(\boldsymbol{c}_{i}\boldsymbol{\cdot }\boldsymbol{v})}{c_{s}^{4}}\right]\boldsymbol{\cdot }\boldsymbol{F}(\boldsymbol{x}_{f}),\end{eqnarray}$$
where
 $c_{s}=\unicode[STIX]{x0394}x_{f}/(\sqrt{3}\unicode[STIX]{x0394}t)$
is the speed of sound. The external force
 $\boldsymbol{F}(\boldsymbol{x}_{f})$
is a distributed force applied from the membrane material points with the immersed boundary method (IBM) (Peskin Reference Peskin2002). The particle velocity
 $\boldsymbol{c}_{i}$
is written by using the time-step size
 $\unicode[STIX]{x0394}t$
and the lattice size
 $\unicode[STIX]{x0394}x_{f}$
as
 $$\begin{eqnarray}\boldsymbol{c}_{i}=c_{i}^{I}\frac{\unicode[STIX]{x0394}x_{f}}{\unicode[STIX]{x0394}t}\boldsymbol{e}_{I},\end{eqnarray}$$
where
 $\boldsymbol{e}_{I}$
is the Cartesian basis. The equilibrium distribution function is given by
 $$\begin{eqnarray}f_{i}^{eq}(\boldsymbol{x}_{f},t)=\unicode[STIX]{x1D70C}w_{i}\left[1+\frac{\boldsymbol{v}\boldsymbol{\cdot }\boldsymbol{c}_{i}}{c_{s}^{2}}+\frac{(\boldsymbol{v}\otimes \boldsymbol{v})\boldsymbol{ : }(\boldsymbol{c}_{i}\otimes \boldsymbol{c}_{i}-c_{s}^{2}\unicode[STIX]{x1D644})}{2c_{s}^{4}}\right],\end{eqnarray}$$
where
 $w_{i}$
is the weight (
 $w_{i}=0$
for
 $i=0$
,
 $w_{i}=1/18$
for the non-diagonal directions and
 $w_{i}=1/36$
for the diagonal directions) and
 $\unicode[STIX]{x1D644}$
is the identity tensor. The macroscopic variables
 $\unicode[STIX]{x1D70C}$
and
 $\boldsymbol{v}$
are defined as
 $$\begin{eqnarray}\displaystyle & \displaystyle \unicode[STIX]{x1D70C}=\mathop{\sum }_{i}f_{i}, & \displaystyle\end{eqnarray}$$
 $$\begin{eqnarray}\displaystyle & \displaystyle \unicode[STIX]{x1D70C}\boldsymbol{v}=\mathop{\sum }_{i}c_{i}\,f_{i}+\frac{1}{2}\boldsymbol{F}(\boldsymbol{x}_{f})\unicode[STIX]{x0394}t. & \displaystyle\end{eqnarray}$$
In the IBM (Peskin Reference Peskin2002), the membrane force
 $\boldsymbol{f}(\boldsymbol{x}_{m})$
at the membrane node
 $\boldsymbol{x}_{m}$
is distributed to the neighbouring fluid nodes
 $\boldsymbol{x}_{f}$
, and the external force
 $\boldsymbol{F}(\boldsymbol{x}_{f})$
in (2.10) is computed as
 $$\begin{eqnarray}\boldsymbol{F}(\boldsymbol{x}_{f})=\mathop{\sum }_{m}D(\boldsymbol{x}_{f}-\boldsymbol{x}_{m})\boldsymbol{f}(\boldsymbol{x}_{m}),\end{eqnarray}$$
where
 $D(\boldsymbol{x})$
is a smoothed delta function approximating the Dirac delta function, given by
 $$\begin{eqnarray}D(\boldsymbol{x})=\left\{\begin{array}{@{}ll@{}}\displaystyle \frac{1}{64\unicode[STIX]{x0394}x_{f}^{3}}\mathop{\prod }_{k=1}^{3}\left(1+\cos \frac{\unicode[STIX]{x03C0}x_{k}}{2\unicode[STIX]{x0394}x_{f}}\right)\quad & \text{if}~|x_{k}|\leqslant 2\unicode[STIX]{x0394}x_{f},\,x_{1}=x,x_{2}=y,x_{3}=z,\\ 0\quad & \text{otherwise}.\end{array}\right.\end{eqnarray}$$
The velocity at the membrane node
 $\boldsymbol{v}(\boldsymbol{x}_{m})$
is obtained by interpolating the velocities at the fluid nodes as
 $$\begin{eqnarray}\boldsymbol{v}(\boldsymbol{x}_{m})=\mathop{\sum }_{f}D(\boldsymbol{x}_{f}-\boldsymbol{x}_{m})\boldsymbol{v}(\boldsymbol{x}_{f}).\end{eqnarray}$$
The membrane node
 $\boldsymbol{x}_{m}$
is updated by Lagrangian tracking with the no-slip condition, i.e.
 $$\begin{eqnarray}\frac{\text{d}\boldsymbol{x}_{m}}{\text{d}t}=\boldsymbol{v}(\boldsymbol{x}_{m}).\end{eqnarray}$$
The explicit fourth-order Runge–Kutta method is used for the time integration. Note that by using our coupling method of LBM and IBM, the hydrodynamic interaction of individual RBCs is solved without modelling a non-hydrodynamic inter-membrane repulsive force in the case of vanishing inertia, as also shown in § A.3.
The viscosity of a LB node
 $x_{f}$
is found using the volume of fluid
 $\unicode[STIX]{x1D713}(x_{f})$
(
 $0\leqslant \unicode[STIX]{x1D713}\leqslant 1$
) of the internal fluid of the RBCs:
 $$\begin{eqnarray}\unicode[STIX]{x1D707}=(1-\unicode[STIX]{x1D713})\unicode[STIX]{x1D707}_{0}+\unicode[STIX]{x1D713}\unicode[STIX]{x1D707}_{1}=\{1+(\unicode[STIX]{x1D706}-1)\unicode[STIX]{x1D713}\}\unicode[STIX]{x1D707}_{0},\end{eqnarray}$$
and the kinematic viscosity as
 $$\begin{eqnarray}\unicode[STIX]{x1D708}=\frac{\unicode[STIX]{x1D707}}{\unicode[STIX]{x1D70C}}=\{1+(\unicode[STIX]{x1D706}-1)\unicode[STIX]{x1D713}\}\frac{\unicode[STIX]{x1D707}_{0}}{\unicode[STIX]{x1D70C}}=\frac{2\unicode[STIX]{x1D70F}-1}{2}c_{s}^{2}\unicode[STIX]{x0394}t=\frac{2\unicode[STIX]{x1D70F}-1}{6}\frac{\unicode[STIX]{x0394}r^{2}}{\unicode[STIX]{x0394}t}.\end{eqnarray}$$
To update the viscosity on the fluid lattice, we consider the volume-of-fluid function
 $\unicode[STIX]{x1D713}$
, which is governed by an advection equation:
 $$\begin{eqnarray}\frac{\unicode[STIX]{x2202}\unicode[STIX]{x1D713}}{\unicode[STIX]{x2202}t}+\unicode[STIX]{x1D735}\boldsymbol{\cdot }(\boldsymbol{v}\unicode[STIX]{x1D713})-\unicode[STIX]{x1D713}\unicode[STIX]{x1D735}\boldsymbol{\cdot }\boldsymbol{v}=0.\end{eqnarray}$$
Equation (2.21) is solved by the THINC/WLIC (tangent of hyperbola for interface capturing/weighted line interface calculation) method (Yokoi Reference Yokoi2007), which is a combination of the THINC scheme and the WLIC method. As a characteristic function of the THINC scheme, the piecewise modified hyperbolic tangent function (Xiao, Honma & kono Reference Xiao, Honma and kono2005) is used. In the WLIC formulation, the interface is reconstructed by taking an average of the interfaces along the
 $x$
,
 $y$
and
 $z$
coordinates with weights calculated from the surface normal. To counter the divergence between the interface of
 $\unicode[STIX]{x1D713}$
and the membrane surface, we also solve the Poisson equation of the indicator function
 ${\mathcal{I}}(\boldsymbol{x}_{f})$
used in the front-tracking method (Unverdi & Tryggvason Reference Unverdi and Tryggvason1992):
 $$\begin{eqnarray}\unicode[STIX]{x1D6FB}^{2}{\mathcal{I}}(\boldsymbol{x}_{f})=\unicode[STIX]{x1D735}\boldsymbol{\cdot }\boldsymbol{G}(\boldsymbol{x}_{f}),\end{eqnarray}$$
where
 ${\mathcal{I}}=1$
in the interior of a cell and
 ${\mathcal{I}}=0$
outside a cell, and
 $\boldsymbol{G}(\boldsymbol{x}_{f})$
is described by the smoothed delta function (2.16):
 $$\begin{eqnarray}\boldsymbol{G}(\boldsymbol{x}_{f})=\unicode[STIX]{x1D735}{\mathcal{I}}(\boldsymbol{x}_{f})=\mathop{\sum }_{e}D(\boldsymbol{x}_{f}-\boldsymbol{x}_{e})\boldsymbol{n}_{e}\unicode[STIX]{x0394}s_{e},\end{eqnarray}$$
where
 $\boldsymbol{n}_{e}$
is the outward unit normal vector to an element with the area
 $\unicode[STIX]{x0394}s_{e}$
, whose centroid is
 $\boldsymbol{x}_{e}$
. To speed up the numerical simulations, we only solve the Poisson equation of the indicator function every 10 000 steps. Our methods are validated for different viscosity ratios by comparing the values of the Taylor parameter of deformed spherical capsules with those reported in Foessel et al. (Reference Foessel, Walter, Salsac and Barthés-Biesel2011), as detailed in § A.1. A volume constraint is implemented to counteract the accumulation of small errors in the volume of the individual cells (Freund Reference Freund2007): in our simulation, the volume error is always maintained lower than
 $1.0\times 10^{-3}\,\%$
, as tested and validated in our previous study of cell adhesion (Takeishi et al.
Reference Takeishi, Imai, Ishida, Omori, Kamm and Ishikawa2016).
All numerical procedures are fully implemented on GPU to accelerate the numerical simulation (Miki et al. Reference Miki, Wang, Aoki, Imai, Ishikawa, Takase and Yamaguchi2012). The mesh size of the LBM for the fluid solution is set to be 250 nm, and that of the finite elements describing the membrane is approximately 250 nm (an unstructured mesh with 5120 elements is used for the FEM). This resolution has been shown to successfully represent single- and multi-cellular dynamics (Takeishi et al. Reference Takeishi, Imai, Nakaaki, Yamaguchi and Ishikawa2014); also, the results of multi-cellular dynamics do not change with twice the resolution of both the fluid mesh and membrane mesh (see also Takeishi et al. Reference Takeishi, Imai, Nakaaki, Yamaguchi and Ishikawa2014).
2.3 Analysis of capsule suspensions
For the following analysis, the behaviour of RBCs subjected to shear flow is quantified by two different orientation angles
 $\unicode[STIX]{x1D703}$
and
 $\unicode[STIX]{x1D6F9}$
as shown in figure 1(a,b), where
 $\unicode[STIX]{x1D703}$
is the angle between the major axis of the deformed RBC and the shear direction and
 $\unicode[STIX]{x1D6F9}$
is the angle between the vortex axis and the normal vector at the initial concave node point (green dot in figure 1
a,b). In suspensions of RBCs, the ensemble average of these orientation angles is calculated as
 $$\begin{eqnarray}\displaystyle \langle \unicode[STIX]{x1D709}\rangle =\frac{1}{MN}\mathop{\sum }_{m}^{M}\mathop{\sum }_{n}^{N}\unicode[STIX]{x1D709}^{m,n}\quad (\unicode[STIX]{x1D709}=\unicode[STIX]{x1D703}~\text{or}~\unicode[STIX]{x1D6F9}), & & \displaystyle\end{eqnarray}$$
where
 $M$
and
 $N$
are the number of time steps and capsules (RBCs), respectively. Time average starts after the non-dimensional time
 $\dot{\unicode[STIX]{x1D6FE}}t=40$
to reduce the influence of the initial conditions, and continues to over
 $\dot{\unicode[STIX]{x1D6FE}}t=100$
.
(a,b) Schematic of the three-dimensional orientation of an RBC (a). The shear flow is driven along the
 $z$
direction by moving the top and bottom walls. Periodic boundary conditions are imposed on the flow (
 $z$
direction) and vortex (
 $x$
direction) directions. Coloured dots on the membrane denote material points to measure the RBC orientation, which is defined by the angle
 $\unicode[STIX]{x1D703}$
between the major axis of the deformed RBC and the shear direction and the angle
 $\unicode[STIX]{x1D6F9}$
between the vortex axis and the green dot (b). (c) Time history of the orientation angles
 $\unicode[STIX]{x1D6F9}$
and
 $\unicode[STIX]{x1D703}$
for different motions; tumbling motion (light red line) for RBC initial orientation
 $\unicode[STIX]{x1D6F9}_{0}=\unicode[STIX]{x03C0}/2$
and rolling motion (black line) for random initial state, i.e.
 $\unicode[STIX]{x1D6F9}_{0}=\text{rand}$
. The upper inset represents the tumbling motion of an RBC (see the supplementary movie 1, available at https://doi.org/10.1017/jfm.2019.393) and the lower inset the rolling motion of an RBC (see the supplementary movie 2). (d) Time history of the intrinsic viscosity
 $\unicode[STIX]{x1D702}$
(
 $=\unicode[STIX]{x1D707}_{sp}/\unicode[STIX]{x1D719}$
) for tumbling (light red line) and rolling (black line) motions. The results are obtained with
 $\unicode[STIX]{x1D706}=5$
at
 $Ca=0.05$
.

For the analysis of the suspension rheology, we consider the contribution of the suspended particles to the bulk viscosity in terms of the particle stress tensor
 $\unicode[STIX]{x1D72E}^{(p)}$
(Batchelor Reference Batchelor1970):
 $$\begin{eqnarray}\unicode[STIX]{x1D72E}^{(p)}=\frac{1}{V}\mathop{\sum }_{i}^{N}\boldsymbol{S}_{i},\end{eqnarray}$$
where
 $V$
is the volume of the domain and
 $\boldsymbol{S}_{i}$
the stresslet of the
 $i$
th particle (capsule and RBC in the present study). Pozrikidis (Reference Pozrikidis1992) analytically derived the stresslet of a deformable capsule for any viscosity ratio:
 $$\begin{eqnarray}\boldsymbol{S}_{i}=\int \left[{\textstyle \frac{1}{2}}(\boldsymbol{x}\otimes \hat{\boldsymbol{q}}+\hat{\boldsymbol{q}}\otimes \boldsymbol{x})-\unicode[STIX]{x1D707}_{0}(1-\unicode[STIX]{x1D706})(\boldsymbol{v}\otimes \boldsymbol{n}+\boldsymbol{n}\otimes \boldsymbol{v})\right]\text{d}A_{i},\end{eqnarray}$$
where
 $\boldsymbol{x}$
is the membrane position relative to the centre of the RBC,
 $\hat{\boldsymbol{q}}$
the load acting on the membrane including a contribution of bending rigidity,
 $\boldsymbol{n}$
the surface normal vector,
 $\unicode[STIX]{x1D707}_{0}$
the outer fluid (plasma) viscosity,
 $\boldsymbol{v}$
the interfacial velocity of membrane and
 $A_{i}$
the membrane surface area of the
 $i$
th RBC. The suspension shear viscosity
 $\unicode[STIX]{x1D707}^{\ast }$
is often expressed in terms of the viscosity
 $\unicode[STIX]{x1D707}_{0}$
of the carrier fluid and a perturbation
 $\unicode[STIX]{x1D6FF}\unicode[STIX]{x1D707}$
(i.e.
 $\unicode[STIX]{x1D707}^{\ast }=\unicode[STIX]{x1D707}_{0}+\unicode[STIX]{x1D6FF}\unicode[STIX]{x1D707}$
), sometimes analytically obtained by truncating a perturbative approach at leading order (e.g. for small deformability or very dilute conditions). This leads to the introduction of the relative viscosity
 $\unicode[STIX]{x1D707}_{re}$
and specific viscosity
 $\unicode[STIX]{x1D707}_{sp}$
defined as
 $$\begin{eqnarray}\displaystyle & \displaystyle \unicode[STIX]{x1D707}_{re}=\frac{\unicode[STIX]{x1D707}^{\ast }}{\unicode[STIX]{x1D707}_{0}}=1+\unicode[STIX]{x1D707}_{sp}, & \displaystyle\end{eqnarray}$$
 $$\begin{eqnarray}\displaystyle & \displaystyle \unicode[STIX]{x1D707}_{sp}=\frac{\unicode[STIX]{x1D6FF}\unicode[STIX]{x1D707}}{\unicode[STIX]{x1D707}_{0}}=\frac{\unicode[STIX]{x1D6F4}_{12}^{(p)}}{\unicode[STIX]{x1D707}_{0}\dot{\unicode[STIX]{x1D6FE}}}. & \displaystyle\end{eqnarray}$$
For example, in a dilute suspension of rigid spheres with a volume fraction
 $\unicode[STIX]{x1D719}$
, it is well known that the specific viscosity
 $\unicode[STIX]{x1D707}_{sp}$
can be given by a polynomial equation of the first order of
 $\unicode[STIX]{x1D719}$
,
 $\unicode[STIX]{x1D707}_{sp}=\unicode[STIX]{x1D702}\unicode[STIX]{x1D719}$
(
 $=2.5\unicode[STIX]{x1D719}$
) (Einstein Reference Einstein1911), where the coefficient
 $\unicode[STIX]{x1D702}$
(
 $=2.5$
) is the intrinsic viscosity which is defined as
 $\unicode[STIX]{x1D702}=\unicode[STIX]{x1D707}_{sp}/\unicode[STIX]{x1D719}$
.
The first and second normal stress differences, typically used to quantify the suspension viscoelastic behaviour, are defined as
 $$\begin{eqnarray}\displaystyle & \displaystyle \frac{N_{1}}{\unicode[STIX]{x1D707}_{0}\dot{\unicode[STIX]{x1D6FE}}}=\frac{\unicode[STIX]{x1D6F4}_{11}^{(p)}-\unicode[STIX]{x1D6F4}_{22}^{(p)}}{\unicode[STIX]{x1D707}_{0}\dot{\unicode[STIX]{x1D6FE}}}, & \displaystyle\end{eqnarray}$$
 $$\begin{eqnarray}\displaystyle & \displaystyle \frac{N_{2}}{\unicode[STIX]{x1D707}_{0}\dot{\unicode[STIX]{x1D6FE}}}=\frac{\unicode[STIX]{x1D6F4}_{22}^{(p)}-\unicode[STIX]{x1D6F4}_{33}^{(p)}}{\unicode[STIX]{x1D707}_{0}\dot{\unicode[STIX]{x1D6FE}}}. & \displaystyle\end{eqnarray}$$
The particle pressure (Jeffery, Morris & Brandy Reference Jeffery, Morris and Brandy1993), which is the isotropic stress that exists in the particle phase, is given by
 $$\begin{eqnarray}\frac{\unicode[STIX]{x1D6F1}_{p}}{\unicode[STIX]{x1D707}_{0}\dot{\unicode[STIX]{x1D6FE}}}=-\frac{\text{tr}\,\unicode[STIX]{x1D6F4}^{(p)}}{3\unicode[STIX]{x1D707}_{0}\dot{\unicode[STIX]{x1D6FE}}}.\end{eqnarray}$$
The particle pressure is analogous to the osmotic pressure in a colloidal suspension caused by the hydrodynamic interactions among the suspended particles without Brownian motion, and has been previously quantified for suspensions of deformable capsules (Clausen et al.
Reference Clausen, Reasor and Aidun2011; Reasor Jr et al.
Reference Reasor, Clausen and Aidun2013; Gross et al.
Reference Gross, Krüger and Varnik2014). In the following section, we show the numerical results obtained with
 $\unicode[STIX]{x1D706}=5$
, and compare with those obtained at other values of
 $\unicode[STIX]{x1D706}$
to quantify the effect on the bulk suspension rheology.
3 Results
3.1 Behaviour of a single RBC
First, we investigate the behaviour of a single RBC at small deformations. When the RBC is placed perpendicular to the shear direction (
 $\unicode[STIX]{x1D6F9}_{0}=\unicode[STIX]{x03C0}/2$
), it keeps flipping along the vortex angle for low
 $Ca$
(
 $=0.05$
), with
 $\unicode[STIX]{x1D6F9}\sim \unicode[STIX]{x03C0}/2$
and with
 $-\unicode[STIX]{x03C0}/2<\unicode[STIX]{x1D703}<\unicode[STIX]{x03C0}/2$
, the so-called tumbling motion (figure 1
c; see the supplementary movie 1). On the other hand, an RBC initially randomly placed, i.e.
 $\unicode[STIX]{x1D6F9}_{0}=\text{rand}.$
(at least
 $\unicode[STIX]{x1D6F9}_{0}\neq 0$
or
 $\neq \unicode[STIX]{x03C0}/2$
), tends to orient parallel to the shear plane, showing a wheel-like configuration with
 $\unicode[STIX]{x1D6F9}=0$
and
 $\unicode[STIX]{x1D703}\sim \unicode[STIX]{x03C0}/4$
, the so-called rolling motion (figure 1
c; see the supplementary movie 2). Our numerical results suggest that a free mode of the RBC at low
 $Ca$
is the rolling motion. Our numerical results also show that the stable rolling RBC has higher intrinsic viscosity than the tumbling RBC (see figure 1
d). Since the orientation angle
 $\unicode[STIX]{x1D703}$
of a single deformable spherical capsule converges to
 $\unicode[STIX]{x03C0}/4$
in shear flow as
 $Ca\rightarrow 0$
(Barthés-Biesel Reference Barthés-Biesel1980; Barthés-Biesel & Sgaier Reference Barthés-Biesel and Sgaier1985), the orientation angle
 $\unicode[STIX]{x1D703}$
of the rolling RBC also converges to
 $\unicode[STIX]{x1D703}\rightarrow \unicode[STIX]{x03C0}/4$
. Jeffery (Reference Jeffery1922) investigated the motion of a single ellipsoid in simple shear flow in the Stokes flow regime, and hypothesized that ‘The particle will tend to adopt that motion which, of all the motions possible under the approximated equations, corresponds to the least dissipation’. Taylor (Reference Taylor1923) experimentally confirmed Jeffery’s hypothesis by investigating the orbit of a prolate or oblate spheroid in a Couette flow at a very low
 $Re$
. However, our numerical results of intrinsic viscosity
 $\unicode[STIX]{x1D702}$
do not agree with Jeffery’s hypothesis, i.e. maximum in
 $\unicode[STIX]{x1D702}$
, while agreeing with previous numerical results of deformable biconcave capsules (Gross et al.
Reference Gross, Krüger and Varnik2014).
(a) Time average of the orientation angle
 $\unicode[STIX]{x1D703}$
and
 $\unicode[STIX]{x1D6F9}$
as a function of the logarithm of
 $Ca$
. The simulations start from
 $\unicode[STIX]{x1D6F9}_{0}=0$
(black inverse triangles) and
 $\unicode[STIX]{x1D6F9}_{0}=\unicode[STIX]{x03C0}/4$
(pale red triangles). Inset figures represent the stable configurations of the RBC with initial angle
 $\unicode[STIX]{x1D6F9}_{0}=\unicode[STIX]{x03C0}/4$
for each
 $Ca$
. (b) Time history of the orientation angles
 $\unicode[STIX]{x1D703}$
and
 $\unicode[STIX]{x1D6F9}$
for
 $Ca=0.8$
(pale red line) and
 $Ca=1.2$
(black line), for initial angle
 $\unicode[STIX]{x1D6F9}_{0}=\unicode[STIX]{x03C0}/4$
. (c) Snapshots of deformed RBCs at different times for
 $Ca=0.8$
(lower) and
 $Ca=1.2$
(upper). (d) Time average of the intrinsic viscosity
 $\unicode[STIX]{x1D702}$
as a function of the logarithm of
 $Ca$
for different stable modes,
 $\unicode[STIX]{x1D6F9}_{\infty }=0$
(inverse triangles) and
 $\unicode[STIX]{x1D6F9}_{\infty }=\unicode[STIX]{x03C0}/2$
(triangles), obtained with the simulations started from
 $\unicode[STIX]{x1D6F9}_{0}=0$
and
 $\unicode[STIX]{x1D6F9}_{0}=\unicode[STIX]{x03C0}/2$
, respectively. These results are obtained with
 $\unicode[STIX]{x1D706}=5$
.

The effects of
 $Ca$
on the stable mode and intrinsic viscosity are now investigated. At least for
 $Ca\leqslant 0.4$
, RBCs initially oriented with
 $\unicode[STIX]{x1D6F9}_{0}=\unicode[STIX]{x03C0}/4$
converge their orientation angles to that obtained for RBCs with
 $\unicode[STIX]{x1D6F9}_{0}=0$
as shown in figure 2(a), where the insets represent the stable configurations at each
 $Ca$
. Note that the final orientation is not changed if the RBCs are initially oriented with
 $\unicode[STIX]{x03C0}/4<\unicode[STIX]{x1D6F9}_{0}<\unicode[STIX]{x03C0}/2$
. When
 $Ca$
increases (
 ${\geqslant}0.8$
), the rolling motion becomes unstable. For instance, RBCs subjected to the highest
 $Ca$
that we investigated (i.e.
 $Ca=1.2$
) fluctuate for
 $0\leqslant \unicode[STIX]{x1D6F9}\leqslant \unicode[STIX]{x03C0}/2$
, showing a multilobe-like shape (Lanotte et al.
Reference Lanotte, Mauer, Mendez, Fedosov, Fromental, Claveria, Nicoul, Gompper and Abkarian2016), while RBCs at
 $Ca=0.8$
for
 $\unicode[STIX]{x1D6F9}\sim 0$
show a tumbling stomatocyte-like shape (Mauer et al.
Reference Mauer, Mendez, Lanotte, Nicoud, Abkarian, Gompper and Fedosov2018) (figure 2
b; see the supplementary movie 3 for
 $Ca=1.2$
and movie 4 for
 $Ca=0.8$
). Such complex deformed shapes of RBCs are qualitatively similar to those reported by Mauer et al. (Reference Mauer, Mendez, Lanotte, Nicoud, Abkarian, Gompper and Fedosov2018), where their smoothed dissipative particle dynamics model of RBCs with
 $\unicode[STIX]{x1D706}=5$
shifts from rolling discocytes (similar to the inset in figure 2
a for
 $Ca=0.05$
) to rolling/tumbling stomatocytes (similar to the inset in figure 2
a for
 $Ca=0.2$
or 0.4) and finally attaining multilobes (similar to the inset in figure 2
a for
 $Ca=0.8$
or 1.2) as the shear rate increases. Despite the different configurations, the intrinsic viscosity
 $\unicode[STIX]{x1D702}$
for high
 $Ca$
is similar as shown in figure 2(d), and hence the effect of the stable modes on the intrinsic viscosity
 $\unicode[STIX]{x1D702}$
reduces for increasing
 $Ca$
. According to figure 2(d), the result for
 $\unicode[STIX]{x1D6F9}_{\infty }=0$
demonstrates significantly more shear-thinning (Skovborg et al.
Reference Skovborg, Nielsen, Schlichtkrull and Ditzel1966; Cokelet & Meiselman Reference Cokelet and Meiselman1968; Chien Reference Chien1970) than in the case of
 $\unicode[STIX]{x1D6F9}_{\infty }=\unicode[STIX]{x03C0}/2$
.
(a) Time average of the intrinsic viscosity
 $\unicode[STIX]{x1D702}$
obtained with different viscosity ratios
 $\unicode[STIX]{x1D706}$
as a function of the logarithm of
 $Ca$
for each stable mode:
 $\unicode[STIX]{x1D6F9}_{\infty }=0$
(dashed lines) and
 $\unicode[STIX]{x1D6F9}_{\infty }=\unicode[STIX]{x03C0}/2$
(dash-dotted lines). The results for
 $\unicode[STIX]{x1D6F9}_{\infty }=0$
and
 $\unicode[STIX]{x1D6F9}_{\infty }=\unicode[STIX]{x03C0}/2$
are obtained with initial orientation
 $\unicode[STIX]{x1D6F9}_{0}=0$
and
 $\unicode[STIX]{x1D6F9}_{0}=\unicode[STIX]{x03C0}/2$
, respectively. (b) Phase diagram of the stable modes of a single RBC as functions of the logarithm of
 $\unicode[STIX]{x1D706}$
and
 $Ca$
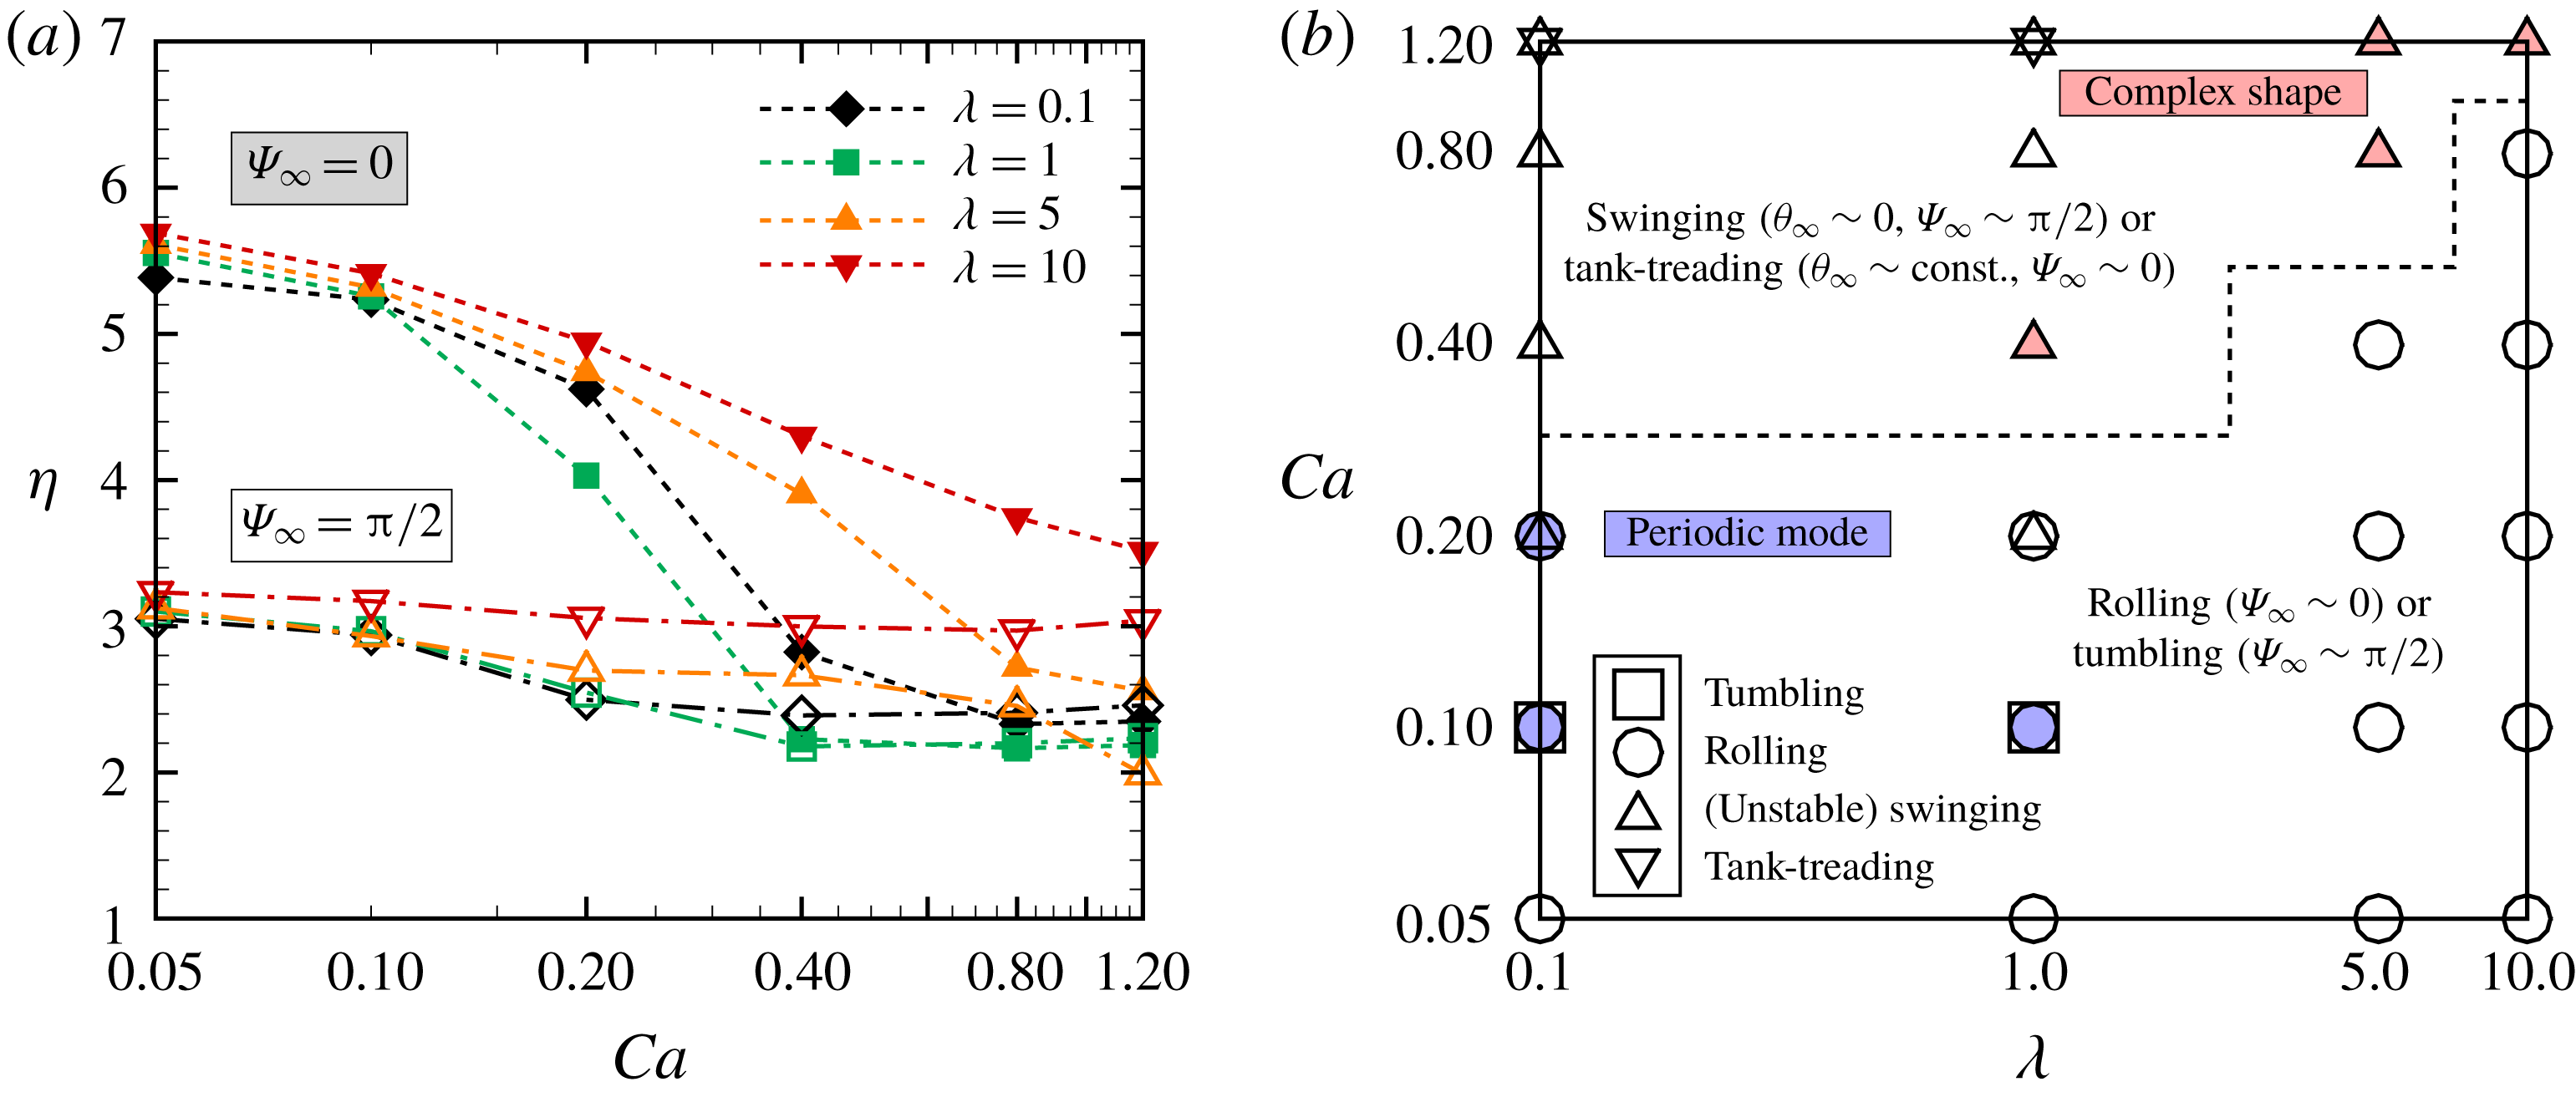
, where the squares (▫) denote the tumbling motion, circles (○) the rolling motion, triangles (▵) the unstable or stable swinging motion and inverse triangles (▿) the tank-treading motion. The solid blue dots represent the periodic motions (see the supplementary movie 5) and the solid red triangles the complex shapes which demonstrate an unstable swinging motion. The dashed line separates the rolling motion from the (unstable) swinging motion. The results in (b) are obtained with random initial orientations.

The effect of the viscosity ratio
 $\unicode[STIX]{x1D706}$
on the intrinsic viscosity
 $\unicode[STIX]{x1D702}$
is quantified for each orientation (i.e.
 $\unicode[STIX]{x1D6F9}_{\infty }=0$
or
 $\unicode[STIX]{x03C0}/2$
), and shown in figure 3(a), where the stable mode of
 $\unicode[STIX]{x1D6F9}_{\infty }=0$
exhibits higher shear-thinning than the case of
 $\unicode[STIX]{x1D6F9}_{\infty }=\unicode[STIX]{x03C0}/2$
for all
 $\unicode[STIX]{x1D706}$
. To summarize, a phase diagram of stable modes of a single RBC based on the orientation angles is given in figure 3(b) as functions of the viscosity ratio
 $\unicode[STIX]{x1D706}$
and the logarithm of
 $Ca$
, where all the results are obtained with the simulations started with random orientations
 $\unicode[STIX]{x1D6F9}_{0}=\text{rand}$
. For low
 $Ca$
, most of the RBCs tend to show the rolling motion which corresponds to the rolling discocyte also reported by Mauer et al. (Reference Mauer, Mendez, Lanotte, Nicoud, Abkarian, Gompper and Fedosov2018), but some of them show an unstable periodic rolling motion even after a long period of time; in other words, the orientation angles do not converge during the simulation time (at least
 $\dot{\unicode[STIX]{x1D6FE}}t\leqslant 1000$
). As an example, the supplementary movie 5 shows the result obtained with
 $\unicode[STIX]{x1D706}=0.1$
at
 $Ca=0.2$
. This periodic motion has been also called kayaking (oscillating–swinging) motion in previous numerical studies of biconcave capsules (Cordasco et al.
Reference Cordasco, Yazdani and Bagchi2014; Sinha & Graham Reference Sinha and Graham2015), similar to a classical Jeffery orbit (Jeffery Reference Jeffery1922). For increasing
 $Ca$
, most of the RBCs shift from the rolling to the swinging motion almost independently of
 $\unicode[STIX]{x1D706}$
(figure 3
b). Based on several previous works on the dynamics of a single RBC, we define the swinging motion when
 $\unicode[STIX]{x1D703}$
is periodic and
 $\unicode[STIX]{x1D6F9}\neq 0$
, while we define the tank-treading motion when
 $\unicode[STIX]{x1D703}$
is constant and
 $\unicode[STIX]{x1D6F9}\sim 0$
. In the swinging cases, especially for high viscosity ratios
 $\unicode[STIX]{x1D706}\geqslant 5$
(figure 3
b), RBCs tend to show complex shapes (or multilobes) as
 $Ca$
increases. The stomatocyte, which can be assumed as one of the multilobe shapes, is found at
 $\unicode[STIX]{x1D706}=1$
for
 $Ca=0.4$
, which shifts to a stable swinging motion for higher
 $Ca$
(figure 3
b). Hence, these complex shapes can be assumed as a transient to the stable swinging motion, and we thus call its mode ‘unstable swinging motion’. Sinha & Graham (Reference Sinha and Graham2015) also showed that a biconcave capsule with
 $\unicode[STIX]{x1D706}=0.75$
, with membrane following the SK law (
 $G_{s}=2.5~\unicode[STIX]{x03BC}\text{N}~\text{m}^{-1}$
and
 $C=10$
), transitions from the tumbling motion to the oscillating–swinging motion for
 $\dot{\unicode[STIX]{x1D6FE}}\sim 465~\text{s}^{-1}$
and to the tank-treading motion for
 $\dot{\unicode[STIX]{x1D6FE}}\sim 930~\text{s}^{-1}$
corresponding to
 $Ca\sim 1.12$
. Mauer et al. (Reference Mauer, Mendez, Lanotte, Nicoud, Abkarian, Gompper and Fedosov2018) showed that tank-treading RBCs can only be found for low
 $\unicode[STIX]{x1D706}$
(
 ${\leqslant}3$
) and high
 $\dot{\unicode[STIX]{x1D6FE}}$
(
 ${\geqslant}820~\text{s}^{-1}$
), and that RBCs with
 $\unicode[STIX]{x1D706}=5$
subject to high shear rates are tumbling stomatocytes or multilobes. The phase diagram that we obtained is indeed consistent with these literature results (Sinha & Graham Reference Sinha and Graham2015; Mauer et al.
Reference Mauer, Mendez, Lanotte, Nicoud, Abkarian, Gompper and Fedosov2018), since we also identify the tank-treading motion for
 $\unicode[STIX]{x1D706}\leqslant 1$
and
 $Ca=1.2$
, and since RBCs with
 $\unicode[STIX]{x1D706}\geqslant 5$
subject to high
 $Ca$
exhibit multilobe shapes. More precise descriptions of the stable modes of single RBCs are needed to investigate the effect of the initial orientation angle
 $\unicode[STIX]{x1D6F9}_{0}$
, which is however beyond the scope of the present work. The dynamics of single RBCs has also been investigated in the past, e.g. in the studies by Omori et al. (Reference Omori, Imai, Yamaguchi and Ishikawa2012), Cordasco et al. (Reference Cordasco, Yazdani and Bagchi2014), Sinha & Graham (Reference Sinha and Graham2015) and Mauer et al. (Reference Mauer, Mendez, Lanotte, Nicoud, Abkarian, Gompper and Fedosov2018).
3.2 Behaviour of RBCs in semi-dilute and dense suspensions
Next, individual RBCs in semi-dilute and dense suspensions are investigated, and examples of snapshots of the numerical results are shown in figure 4, where a semi-dilute suspension is defined for volume fraction
 $\unicode[STIX]{x1D719}=0.05$
, and a dense suspension for the highest
 $\unicode[STIX]{x1D719}$
that we investigated, i.e.
 $\unicode[STIX]{x1D719}=0.41$
. In semi-dilute suspensions, RBCs subjected to low
 $Ca=0.05$
show small deformations, where both the rolling and tumbling motions coexist (figure 4
a) (see the supplementary movie 6). In dense suspensions, however, due to the high packing, the RBCs are forced to exhibit only the swinging motion resulting in large elongations even for low
 $Ca=0.05$
(figure 4
b; see the supplementary movie 7). Indeed, as the volume fraction
 $\unicode[STIX]{x1D719}$
increases, the orientation angle
 $\unicode[STIX]{x1D6F9}$
immediately increases and saturates around
 $\unicode[STIX]{x1D6F9}\sim 0.34\unicode[STIX]{x03C0}$
, while the other orientation angle
 $\unicode[STIX]{x1D703}$
initially decreases and remains at
 $\unicode[STIX]{x1D703}\leqslant 0.1\unicode[STIX]{x03C0}$
as shown in figure 5(a), where the insets represent enlarged views of semi-dilute suspensions showing the coexistence of the rolling and tumbling motions, and of dense suspensions dominated by swinging motions. The different motions are well characterized in the time history of both orientation angles as shown in figures 5(c) and 5(d), respectively. These results clearly show that hydrodynamic interactions allow RBCs to shift from the rolling to the tumbling or swinging motions at different
 $Ca$
from that for single RBCs. Since the tumbling and swinging motion is that which allows low intrinsic viscosity
 $\unicode[STIX]{x1D702}$
as described above, hydrodynamic interactions decrease
 $\unicode[STIX]{x1D702}$
in semi-dilute suspensions but enhance it for high volume fractions as shown in figure 5(b).
Snapshots of our numerical results for (a,c) semi-dilute suspensions (
 $\unicode[STIX]{x1D719}=0.05$
) and (b,d) dense suspensions (
 $\unicode[STIX]{x1D719}=0.41$
) with
 $\unicode[STIX]{x1D706}=5$
. The results for
 $Ca=0.05$
and 0.8 are reported in (a,b) and (c,d), respectively. The time evolutions of these snapshots are shown in the supplementary movies: movie 6 for (a), movie 7 for (b), movie 8 for (c) and movie 9 for (d).

(a) Ensemble average of the orientation angles of RBCs for
 $Ca=0.05$
and (b) the intrinsic viscosity
 $\unicode[STIX]{x1D702}$
as a function of the volume fraction
 $\unicode[STIX]{x1D719}$
, where the insets are representative snapshots showing the coexistence of rolling and tumbling motions in a semi-dilute suspension and the unstable or stable swinging RBC in a dense suspension. These modes are identified by the time history of the orientation angles
 $\unicode[STIX]{x1D703}$
and
 $\unicode[STIX]{x1D6F9}$
for (c) semi-dilute and (d) dense suspensions. These results are obtained with
 $\unicode[STIX]{x1D706}=5$
.

(a) Ensemble average of the orientation angles of RBCs for
 $Ca=0.8$
and (b) the intrinsic viscosity
 $\unicode[STIX]{x1D702}$
as a function of the volume fraction
 $\unicode[STIX]{x1D719}$
. Time history of the orientation angles for (c) semi-dilute and (d) dense suspensions. These results are obtained with
 $\unicode[STIX]{x1D706}=5$
.

When
 $Ca$
increases to 0.8, individual RBCs in semi-dilute suspensions deform largely and show complex shapes (figure 4
c; see the supplementary movie 8). Since the deformation is induced by the hydrodynamic interactions, RBCs in dense suspensions elongate more than in the case with
 $Ca=0.05$
(figure 4
d; see the supplementary movie 9). Similarly to the case with
 $Ca=0.05$
, the orientation angle
 $\unicode[STIX]{x1D6F9}$
immediately increases as
 $\unicode[STIX]{x1D719}$
increases, but it slightly decreases from
 $\unicode[STIX]{x1D719}\sim 0.1$
onwards. Since RBCs subject to high
 $Ca$
tend to show mostly swinging motions without multi-cellular interactions, the orientation angle
 $\unicode[STIX]{x1D703}$
is already small in the case of dilute suspensions (single RBC level), and slightly increases with
 $\unicode[STIX]{x1D719}$
as shown in figure 6(a), where the insets represent enlarged views of semi-dilute and dense suspensions showing the coexistence of the swinging and tank-treading motions. Here, we define the tank-treading motion as
 $\unicode[STIX]{x1D6F9}\sim 0$
and
 $\unicode[STIX]{x1D703}\sim 0$
as in the previous numerical study by Omori et al. (Reference Omori, Imai, Yamaguchi and Ishikawa2012). These are characterized in the time history by the two orientation angles reported in figure 6(c,d), where the swinging RBCs are the ones fluctuating in
 $\unicode[STIX]{x1D6F9}$
(i.e.
 $\unicode[STIX]{x1D6F9}\neq \unicode[STIX]{x03C0}/2$
). Since rolling motions do not exist for
 $Ca=0.8$
, the intrinsic viscosity does not much drop and it almost monotonically increases with
 $\unicode[STIX]{x1D719}$
as shown in figure 6(b), where the insets display instantaneous configurations.
(a) The intrinsic viscosity
 $\unicode[STIX]{x1D702}$
and (b) the phase diagram of the stable modes of RBCs as functions of
 $\unicode[STIX]{x1D719}$
and logarithm of
 $Ca$
, where the squares (▫) denote the tumbling motion, circles (○) the rolling motion, triangles (▵) the unstable or stable swinging motion and inverse triangles (▿) the tank-treading motion. The red triangles denote the complex shape which demonstrates unstable swinging motions. The dashed line separates the rolling from the other motions, and the dash-dotted line the tumbling motions from the pure swinging/tank-treading motion. (c) The deformation index
 $d_{max}/d_{ref}$
, where
 $d_{max}$
and
 $d_{ref}$
are the maximum distances between two points on the deformed and reference membranes (i.e. no flow condition), respectively. (d) The particle pressure
 $\unicode[STIX]{x1D6F1}_{p}/\unicode[STIX]{x1D719}\unicode[STIX]{x1D707}_{0}\dot{\unicode[STIX]{x1D6FE}}$
as a function of the volume fraction
 $\unicode[STIX]{x1D719}$
for different
 $Ca$
. The (e) first and (f) second normal stress differences
 $N_{i}/\unicode[STIX]{x1D719}\unicode[STIX]{x1D707}_{0}\dot{\unicode[STIX]{x1D6FE}}$
(
 $i=1$
and 2, respectively). These results are obtained with
 $\unicode[STIX]{x1D706}=5$
.

To summarize the results of stable modes of individual RBCs in dilute (single-cell level), semi-dilute (
 $\unicode[STIX]{x1D719}\sim 0.05$
) and dense suspension (
 $\unicode[STIX]{x1D719}\sim 0.4$
), we show the intrinsic viscosity
 $\unicode[STIX]{x1D702}$
as a function of
 $\unicode[STIX]{x1D719}$
for different
 $Ca$
in figure 7(a), where the drop of
 $\unicode[STIX]{x1D702}$
in semi-dilute suspensions is commonly found at each
 $Ca$
. The drop of
 $\unicode[STIX]{x1D702}$
in semi-dilute suspensions is explained by the mode change from the rolling to tumbling motion, as reported in the phase diagram (figure 7
b). On increasing
 $\unicode[STIX]{x1D719}$
, the probability of swinging RBCs increases resulting in the increase of
 $\unicode[STIX]{x1D702}$
observed in figure 7(a,b). To see the relationship between the intrinsic viscosity of the suspension and the RBC deformation at high volume fractions, we show the deformation index
 $d_{max}/d_{ref}$
in figure 7(c), where
 $d_{max}$
and
 $d_{ref}$
are the maximum distances between two points on the deformed and reference (i.e. without flow) membranes. We observe that
 $d_{max}/d_{ref}$
increases similarly to
 $\unicode[STIX]{x1D702}$
for relatively high volume fractions (
 $\unicode[STIX]{x1D719}>0.05$
), and hence high
 $\unicode[STIX]{x1D702}$
can be associated with large deformation of swinging RBCs. The increase with
 $\unicode[STIX]{x1D719}$
is also found for the first normal stress difference
 $N_{1}/\unicode[STIX]{x1D719}\unicode[STIX]{x1D707}_{0}\dot{\unicode[STIX]{x1D6FE}}$
, while no significant differences are evident when varying
 $Ca$
(figure 7
e). Instead, the second normal stress difference
 $N_{2}/\unicode[STIX]{x1D719}\unicode[STIX]{x1D707}_{0}\dot{\unicode[STIX]{x1D6FE}}$
decreases with
 $\unicode[STIX]{x1D719}$
, and again almost no difference is evident for different
 $Ca$
(figure 7
f). The particle pressure
 $\unicode[STIX]{x1D6F1}_{p}/\unicode[STIX]{x1D719}\unicode[STIX]{x1D707}_{0}\dot{\unicode[STIX]{x1D6FE}}$
also decreases with
 $\unicode[STIX]{x1D719}$
(figure 7
d), similarly to the second normal stress difference (figure 7
f), although the effect of
 $Ca$
is more pronounced.
(a,b) The intrinsic viscosity
 $\unicode[STIX]{x1D702}$
as a function of the volume fraction
 $\unicode[STIX]{x1D719}$
for (a) low
 $Ca=0.05$
and (b) high
 $Ca=0.8$
. (c,d) The phase diagrams of the stable modes of RBCs as functions of
 $\unicode[STIX]{x1D719}$
and logarithm of
 $\unicode[STIX]{x1D706}$
for (c)
 $Ca=0.05$
and (d)
 $Ca=0.8$
, where the squares (▫) denote the tumbling motion, circles (○) the rolling motion, triangles (▵) the unstable or stable swinging motion and inverse triangles (▿) the tank-treading motion. The solid red triangles denote the complex shapes which demonstrate unstable swinging motions. The dashed line in (c) separates the rolling motion from the tumbling motion, the dash-dotted line in (c) separates the pure tumbling motion from the swinging motion and the dash-dotted line in (d) separates the tumbling motion from the swinging/tank-treading motion. (e,f) The deformation index
 $d_{max}/d_{ref}$
for (e) low
 $Ca=0.05$
and (f) high
 $Ca=0.8$
.

The effects of
 $\unicode[STIX]{x1D706}$
on the intrinsic viscosity
 $\unicode[STIX]{x1D702}$
and on the stable mode are investigated at a fixed
 $Ca$
, and the results are shown in figure 8. For low
 $Ca$
(
 $=0.05$
), the drop of
 $\unicode[STIX]{x1D702}$
in semi-dilute suspensions (
 $\unicode[STIX]{x1D719}\sim 0.05$
) is observed independently of the value of
 $\unicode[STIX]{x1D706}$
(figure 8
a) because the mode changes from the rolling to the tumbling motion (figure 8
c). For high
 $Ca$
(
 $=0.8$
), the mode change is not evident in semi-dilute suspensions (figure 8
d), and hence the drop of
 $\unicode[STIX]{x1D702}$
is not found for every
 $\unicode[STIX]{x1D706}$
(figure 8
b). As shown in figure 8(e,f), the increase of
 $\unicode[STIX]{x1D702}$
for relatively high volume fractions can also be explained by large deformations of swinging RBCs independently of
 $\unicode[STIX]{x1D706}$
.
4 Discussion
4.1 Comparison with experiments
Our numerical results for the relative viscosities
 $\unicode[STIX]{x1D707}_{re}$
in dense suspensions (
 $\unicode[STIX]{x1D719}=0.41$
) are compared with the previous experimental results of Chien (Reference Chien1970) and Cokelet & Meiselman (Reference Cokelet and Meiselman2007). In the study of Chien (Reference Chien1970), the viscosities of normal human RBC suspensions in heparinized plasma or in 11 % albumin–Ringer solution at 45 % volume fraction were measured in a coaxial cylinder viscometer at
 $37\,^{\circ }\text{C}$
, where the 11 % albumin–Ringer solution had the same viscosity as plasma (i.e.
 $\unicode[STIX]{x1D707}_{0}=1.2$
cP) but did not cause RBC aggregation. Cokelet & Meiselman (Reference Cokelet and Meiselman2007) also measured the viscosity of normal human RBC suspension in plasma at 40 % volume fraction. Therefore, these experimental conditions in RBC suspensions correspond to
 $\unicode[STIX]{x1D706}=5$
. Indeed, our numerical results obtained with
 $\unicode[STIX]{x1D706}=5$
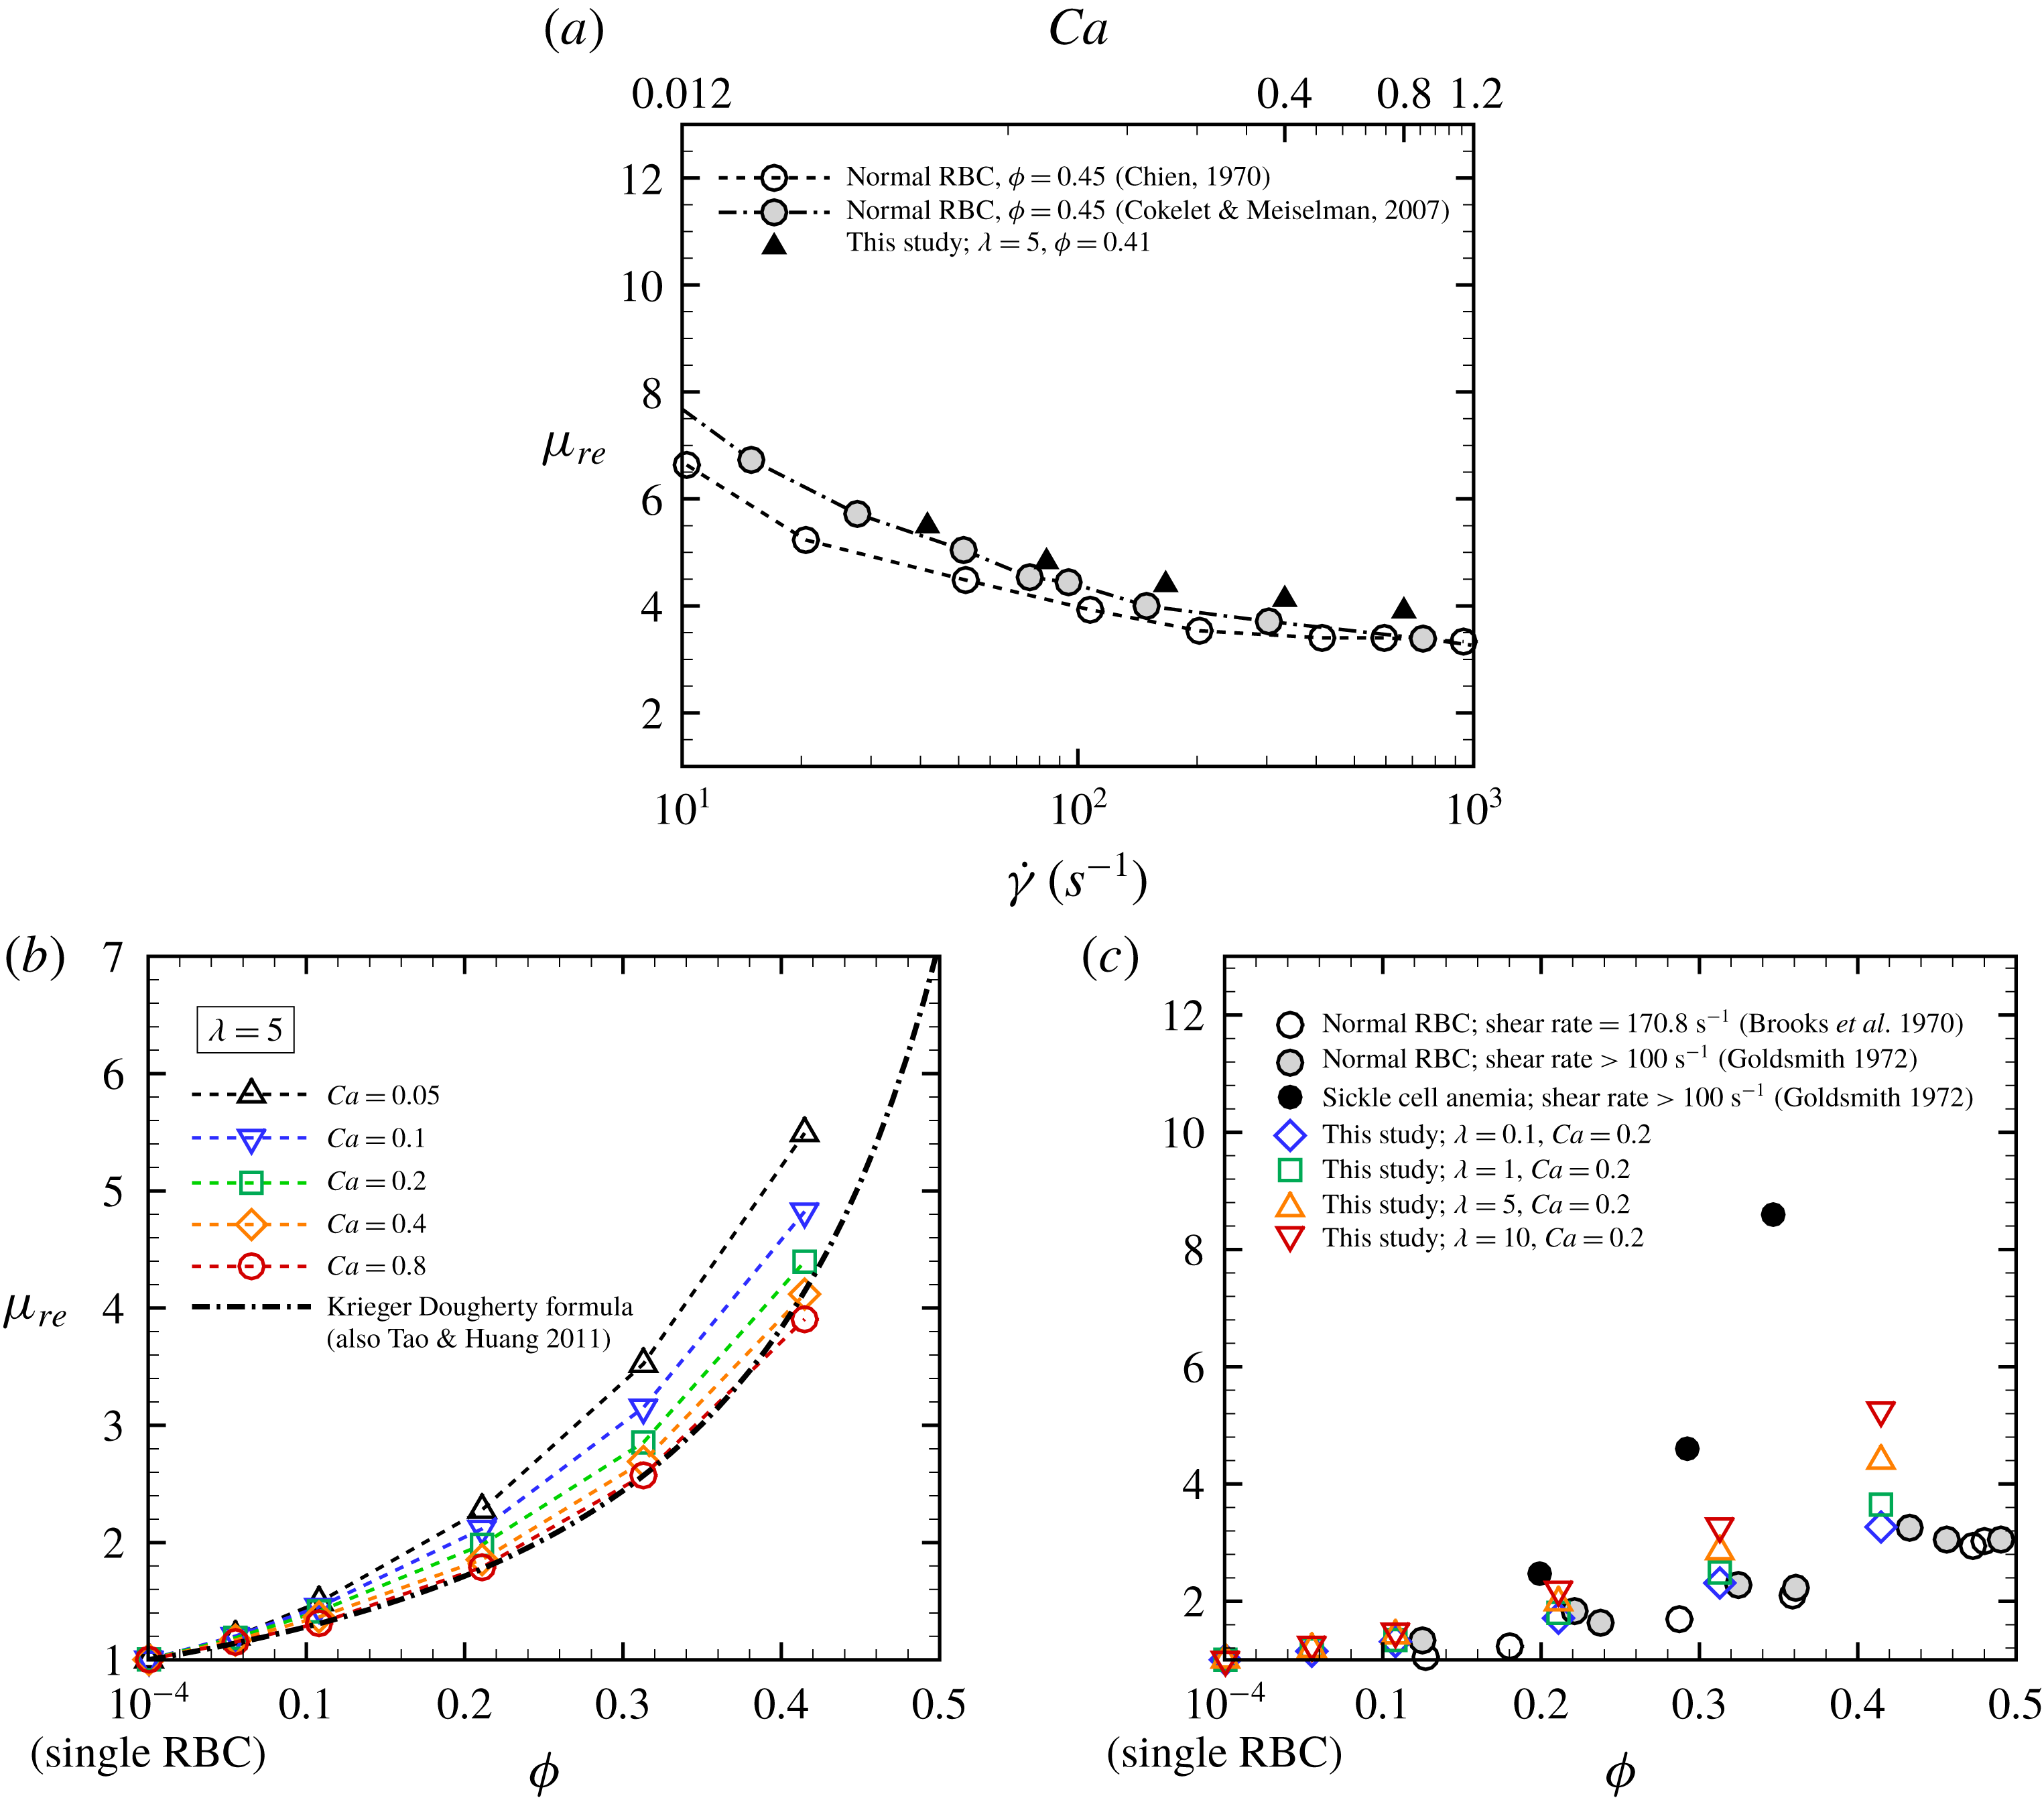
well agree with the experimental results, especially those of Cokelet & Meiselman (Reference Cokelet and Meiselman1968) as shown in figure 9(a).
(a) Relative viscosity
 $\unicode[STIX]{x1D707}_{re}$
for
 $\unicode[STIX]{x1D719}=0.41$
as a function of the logarithm of the shear rate
 $\dot{\unicode[STIX]{x1D6FE}}$
obtained with
 $\unicode[STIX]{x1D706}=5$
. The experimental results of normal human RBC suspension in plasma, 11 % albumin–Ringer solution for
 $\unicode[STIX]{x1D719}=0.45$
at
 $37\,^{\circ }\text{C}$
(Chien Reference Chien1970), and in plasma at
 $\unicode[STIX]{x1D719}=0.4$
(Cokelet & Meiselman Reference Cokelet and Meiselman2007) are also displayed as white and grey circles, respectively. The viscosity of 11 % albumin–Ringer solution is the same as that of plasma, i.e.
 $\unicode[STIX]{x1D707}_{0}=1.2$
cP. (b) Relative viscosity
 $\unicode[STIX]{x1D707}_{re}$
obtained with
 $\unicode[STIX]{x1D706}=5$
as a function of the volume fraction
 $\unicode[STIX]{x1D719}$
for different
 $Ca$
. The empirical expression reported in (4.1) with the parameters proposed by Tao & Huang (Reference Tao and Huang2011) is also displayed as a dash-dotted line. (c) Relative viscosity
 $\unicode[STIX]{x1D707}_{re}$
as a function of volume fraction
 $\unicode[STIX]{x1D719}$
for different viscosity ratios
 $\unicode[STIX]{x1D706}$
at
 $Ca=0.2$
(
 $\dot{\unicode[STIX]{x1D6FE}}=167~\text{s}^{-1}$
). The experimental results of a suspension of acetaldehyde-fixed human RBCs in plasma for
 $\dot{\unicode[STIX]{x1D6FE}}=170.8~\text{s}^{-1}$
are also displayed as white circles (Brooks, Goodwin & Seaman Reference Brooks, Goodwin and Seaman1970). Moreover, the experimental data of suspensions of normal and sickle human RBCs for
 $\dot{\unicode[STIX]{x1D6FE}}>100~\text{s}^{-1}$
are also displayed as black and grey circles, respectively (Goldsmith Reference Goldsmith, Becker and Mikhailov1972).

Figure 9(b) shows the numerical results of
 $\unicode[STIX]{x1D707}_{re}$
as a function of
 $\unicode[STIX]{x1D719}$
for
 $\unicode[STIX]{x1D706}=5$
. The relative viscosity
 $\unicode[STIX]{x1D707}_{re}$
for each
 $Ca$
exponentially increases with
 $\unicode[STIX]{x1D719}$
, and
 $\unicode[STIX]{x1D707}_{re}$
tends to decrease as
 $Ca$
increases. This behaviour is the same when the viscosity ratio changes (data not shown). Our numerical results for
 $\unicode[STIX]{x1D707}_{re}$
are compared with the empirical expression proposed by Krieger & Dougherty (Reference Krieger and Dougherty1959):
 $$\begin{eqnarray}\unicode[STIX]{x1D707}_{re}=\left(1-\frac{\unicode[STIX]{x1D719}}{\unicode[STIX]{x1D719}_{m}}\right)^{-\unicode[STIX]{x1D702}\unicode[STIX]{x1D719}_{m}},\end{eqnarray}$$
where
 $\unicode[STIX]{x1D719}_{m}$
is the maximum volume fraction. Although (4.1) was originally proposed for rigid-sphere suspensions, it allows us to estimate the viscosity for particles of any shape by choosing suitable
 $\unicode[STIX]{x1D719}_{m}$
and
 $\unicode[STIX]{x1D702}$
, e.g. Tao & Huang (Reference Tao and Huang2011) set
 $\unicode[STIX]{x1D719}_{m}=0.72$
and
 $\unicode[STIX]{x1D702}=2.3$
in order to estimate the relative viscosity
 $\unicode[STIX]{x1D707}_{re}$
experimentally obtained in blood with the plasma viscosity
 ${\approx}1.0$
cP at
 $37\,^{\circ }\text{C}$
and the viscosity ratio
 $\unicode[STIX]{x1D706}$
around 5. Our numerical results agree well also with this empirical expression (4.1) with the same parameters proposed by Tao & Huang (Reference Tao and Huang2011), especially for high
 $Ca$
(
 $=0.8$
).
Figure 9(c) shows the numerical results for
 $\unicode[STIX]{x1D707}_{re}$
obtained with different
 $\unicode[STIX]{x1D706}$
for
 $Ca=0.2$
, which corresponds to a shear rate
 $\dot{\unicode[STIX]{x1D6FE}}=167~\text{s}^{-1}$
, as a function of the volume fraction
 $\unicode[STIX]{x1D719}$
. These results are compared with previous measurements obtained with acetaldehyde-fixed human RBC suspension in plasma for
 $\dot{\unicode[STIX]{x1D6FE}}=170.8~\text{s}^{-1}$
(Brooks et al.
Reference Brooks, Goodwin and Seaman1970), and also with normal human/sickle RBC suspension for
 $\dot{\unicode[STIX]{x1D6FE}}>100~\text{s}^{-1}$
(Goldsmith Reference Goldsmith, Becker and Mikhailov1972). Again, we confirm that our numerical results are well within those of normal and sickle RBCs. It is also known that cytoplasmic viscosity nonlinearly increases with haemoglobin concentration, resulting in alteration of the cell deformability. The usual distribution of haemoglobin concentration in individual RBCs ranges from 27 to
 $37~\text{g}~\text{dl}^{-1}$
corresponding to the internal fluid viscosity (
 $\unicode[STIX]{x1D707}_{1}$
) being 5–15 cP (Mohandas & Gallagher Reference Mohandas and Gallagher2008). The physiologically relevant viscosity ratio therefore can be taken as
 $\unicode[STIX]{x1D706}=4.2$
–12.5 if the plasma viscosity is set to
 $\unicode[STIX]{x1D707}_{0}=1.2$
cP. In the case of sickle cell anaemia, on the other hand, the haemoglobin concentration is abnormal, e.g. the mean corpuscular haemoglobin concentration of sickle cells is potentially elevated to 44.4–
 $47.6~\text{g}~\text{dl}^{-1}$
(Evans et al.
Reference Evans, Mohandas and Leung1984). Since previous studies have shown that the viscosity of haemoglobin solution abruptly increases to 45 cP at
 $40~\text{g}~\text{dl}^{-1}$
, up to 170 cP at
 $45~\text{g}~\text{dl}^{-1}$
and 650 cP at
 $50~\text{g}~\text{dl}^{-1}$
(Cokelet & Meiselman Reference Cokelet and Meiselman1968; Mohandas & Gallagher Reference Mohandas and Gallagher2008), sickle cells with haemoglobin concentration of
 $45~\text{g}~\text{dl}^{-1}$
may have high cytoplasmic viscosity
 $\unicode[STIX]{x1D707}_{1}\approx 170$
cP, where the viscosity ratio is taken as
 $\unicode[STIX]{x1D706}\approx 140$
if physiological plasma viscosity (
 $\unicode[STIX]{x1D707}_{0}=1.2$
cP) is considered. Although the exact haemoglobin concentration is different depending on the type of sickle cell disease and on the person, the relative viscosity
 $\unicode[STIX]{x1D707}_{re}$
of blood with sickle cell anaemia should be higher at any shear rates than that of normal blood (Chien et al.
Reference Chien, Usami and Bertles1970; Usami et al.
Reference Usami, Chien, Scholtz and Bertles1975; Kaul & Xue Reference Kaul and Xue1991).
4.2 Comparison with other numerical models
Next, we compare our numerical results of stresslet with those obtained with other membrane constitutive models: the spectrin-link model (Reasor Jr et al.
Reference Reasor, Clausen and Aidun2013) and the continuum-based capsule model (Gross et al.
Reference Gross, Krüger and Varnik2014) whose membrane follows SK law but with repulsive forces between the RBCs. For reasonable comparison, we define the effective capillary number as
 $Ca_{eff}=\unicode[STIX]{x1D707}_{re}Ca$
. Note that the definition of
 $Ca$
in those previous works (Reasor Jr et al.
Reference Reasor, Clausen and Aidun2013; Gross et al.
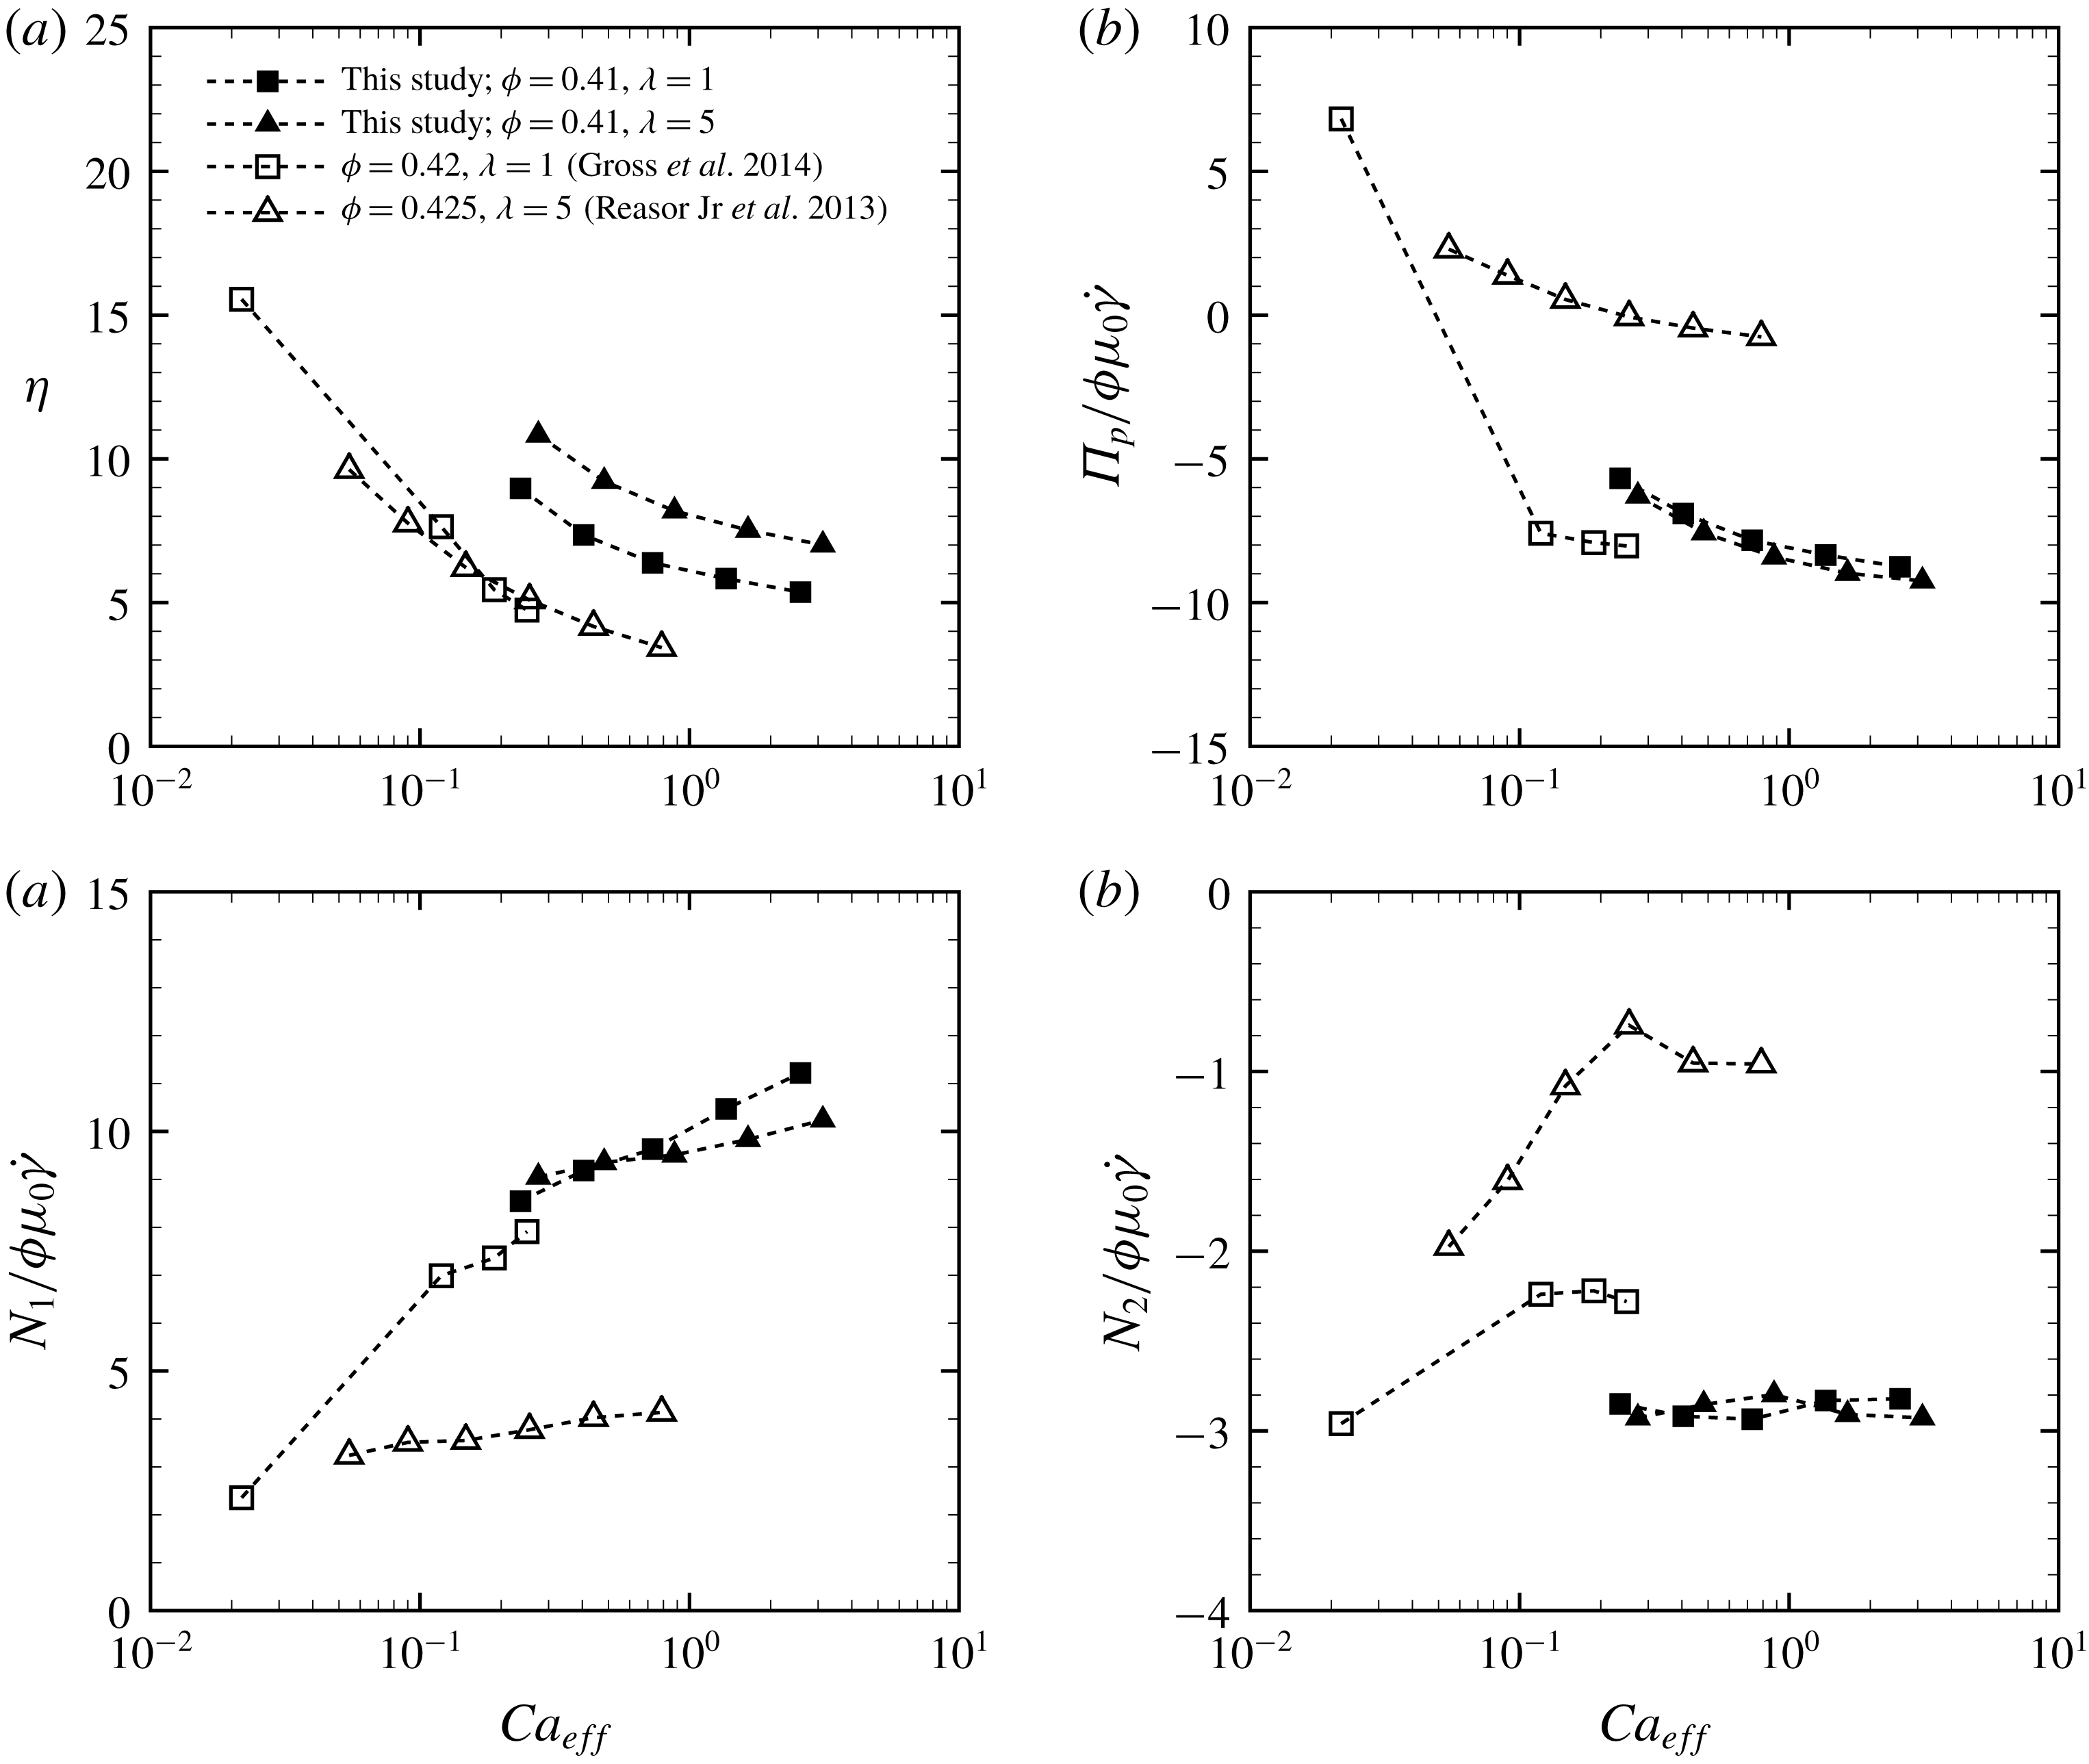
Reference Gross, Krüger and Varnik2014) is the same as used here and reported in (2.1). Figure 10(a) shows the intrinsic viscosity
 $\unicode[STIX]{x1D702}$
as a function of
 $Ca_{eff}$
. Independently of the numerical model used, the RBC suspensions show a shear-thinning behaviour; however, our results exhibit higher intrinsic viscosity than in the other two studies. While
 $\unicode[STIX]{x1D702}$
in our results decreases for all
 $Ca_{eff}$
as the viscosity ratio decreases from
 $\unicode[STIX]{x1D706}=5$
to
 $\unicode[STIX]{x1D706}=1$
, in the previous studies
 $\unicode[STIX]{x1D702}$
was almost independent of the value of
 $\unicode[STIX]{x1D706}$
(figure 10
a). Although the results of Reasor Jr et al. (Reference Reasor, Clausen and Aidun2013) and Gross et al. (Reference Gross, Krüger and Varnik2014) exhibit similar
 $\unicode[STIX]{x1D702}$
, the particle pressure
 $\unicode[STIX]{x1D6F1}_{p}/\unicode[STIX]{x1D707}_{0}\dot{\unicode[STIX]{x1D6FE}}$
(figure 10
b) and the two normal stress differences
 $N_{i}/\unicode[STIX]{x1D707}_{0}\dot{\unicode[STIX]{x1D6FE}}$
(figure 10
c,d) are quite different between the two previous studies. We think that the discrepancies among the three numerical studies of the stresslet values shown in figure 10 are mainly due to the difference in the choice of constitutive model for the RBC membrane, the contact model between RBCs and the boundary conditions. Comparing the results of the present study with those of Reasor Jr et al. (Reference Reasor, Clausen and Aidun2013), we conclude that the stresslet is sensitive to the membrane constitutive model. Although the membrane model applied in Gross et al. (Reference Gross, Krüger and Varnik2014) and that of the present study are the same, Gross et al. (Reference Gross, Krüger and Varnik2014) considered repulsive forces between the RBCs. Such a contact model guarantees a certain amount of fluid between the RBCs, which is likely to decrease the relative viscosity (
 $S_{12}$
) of the RBC suspension and also affect the other components of the particle stresslet tensor (
 $\unicode[STIX]{x1D61A}_{ij}$
). The different boundary conditions are also likely to partially affect the stresslet. Reasor Jr et al. (Reference Reasor, Clausen and Aidun2013) used the Lees–Edwards boundary condition (Lees & Edwards Reference Lees and Edwards1972) to consider an unbounded shear flow, while Gross et al. (Reference Gross, Krüger and Varnik2014) and the present study consider a wall-bounded shear flow. However, we believe that the effect of a solid wall on the solution is limited because our numerical results (e.g.
 $\unicode[STIX]{x1D707}_{sp}$
and
 $N_{i}/\unicode[STIX]{x1D707}\dot{\unicode[STIX]{x1D6FE}}$
) for suspensions of spherical particles in a bounded shear flow agree well with those of the previous numerical studies of Matsunaga et al. (Reference Matsunaga, Imai, Yamaguchi and Ishikawa2016), where an unbounded shear flow was solved by the boundary-element method (see figure 13). These results suggest that the stresslet will be independent of numerical methods if the same membrane constitutive model and contact model between particles are used, and also indicate that the domain size used here is adequate. Gross et al. (Reference Gross, Krüger and Varnik2014) systematically investigated the stresslet for relatively low
 $Ca_{eff}$
(
 $10^{-4}\leqslant Ca_{eff}\leqslant 10^{-1}$
) at
 $\unicode[STIX]{x1D706}=1$
. Our numerical results provide insight into stresslet for relatively high
 $Ca_{eff}$
(
 $10^{-1}\leqslant Ca_{eff}\leqslant 1$
), which correspond to venule and arteriole environments in humans. Although the particle pressure and normal stress differences are difficult to measure in experiments, we hope that our numerical results will stimulate not only numerical but also experimental studies to clearly show the viscoelastic behaviour of blood.
(a) The intrinsic viscosity
 $\unicode[STIX]{x1D702}$
, (b) the particle pressure
 $\unicode[STIX]{x1D6F1}_{p}/\unicode[STIX]{x1D707}_{0}\dot{\unicode[STIX]{x1D6FE}}$
and the (c) first and (d) second normal stress differences
 $N_{i}/\unicode[STIX]{x1D707}_{0}\dot{\unicode[STIX]{x1D6FE}}$
(
 $i=1$
and 2) for
 $\unicode[STIX]{x1D719}=0.41$
as a function of the effective capillary number
 $Ca_{eff}$
. The previous numerical results for
 $\unicode[STIX]{x1D706}=1$
(
 $\unicode[STIX]{x1D719}=0.42$
) by Gross et al. (Reference Gross, Krüger and Varnik2014) and
 $\unicode[STIX]{x1D706}=5$
(
 $\unicode[STIX]{x1D719}=0.425$
,
 $k_{b}=2.4\times 10^{-19}$
J) by Reasor Jr et al. (Reference Reasor, Clausen and Aidun2013) are also displayed for comparison.

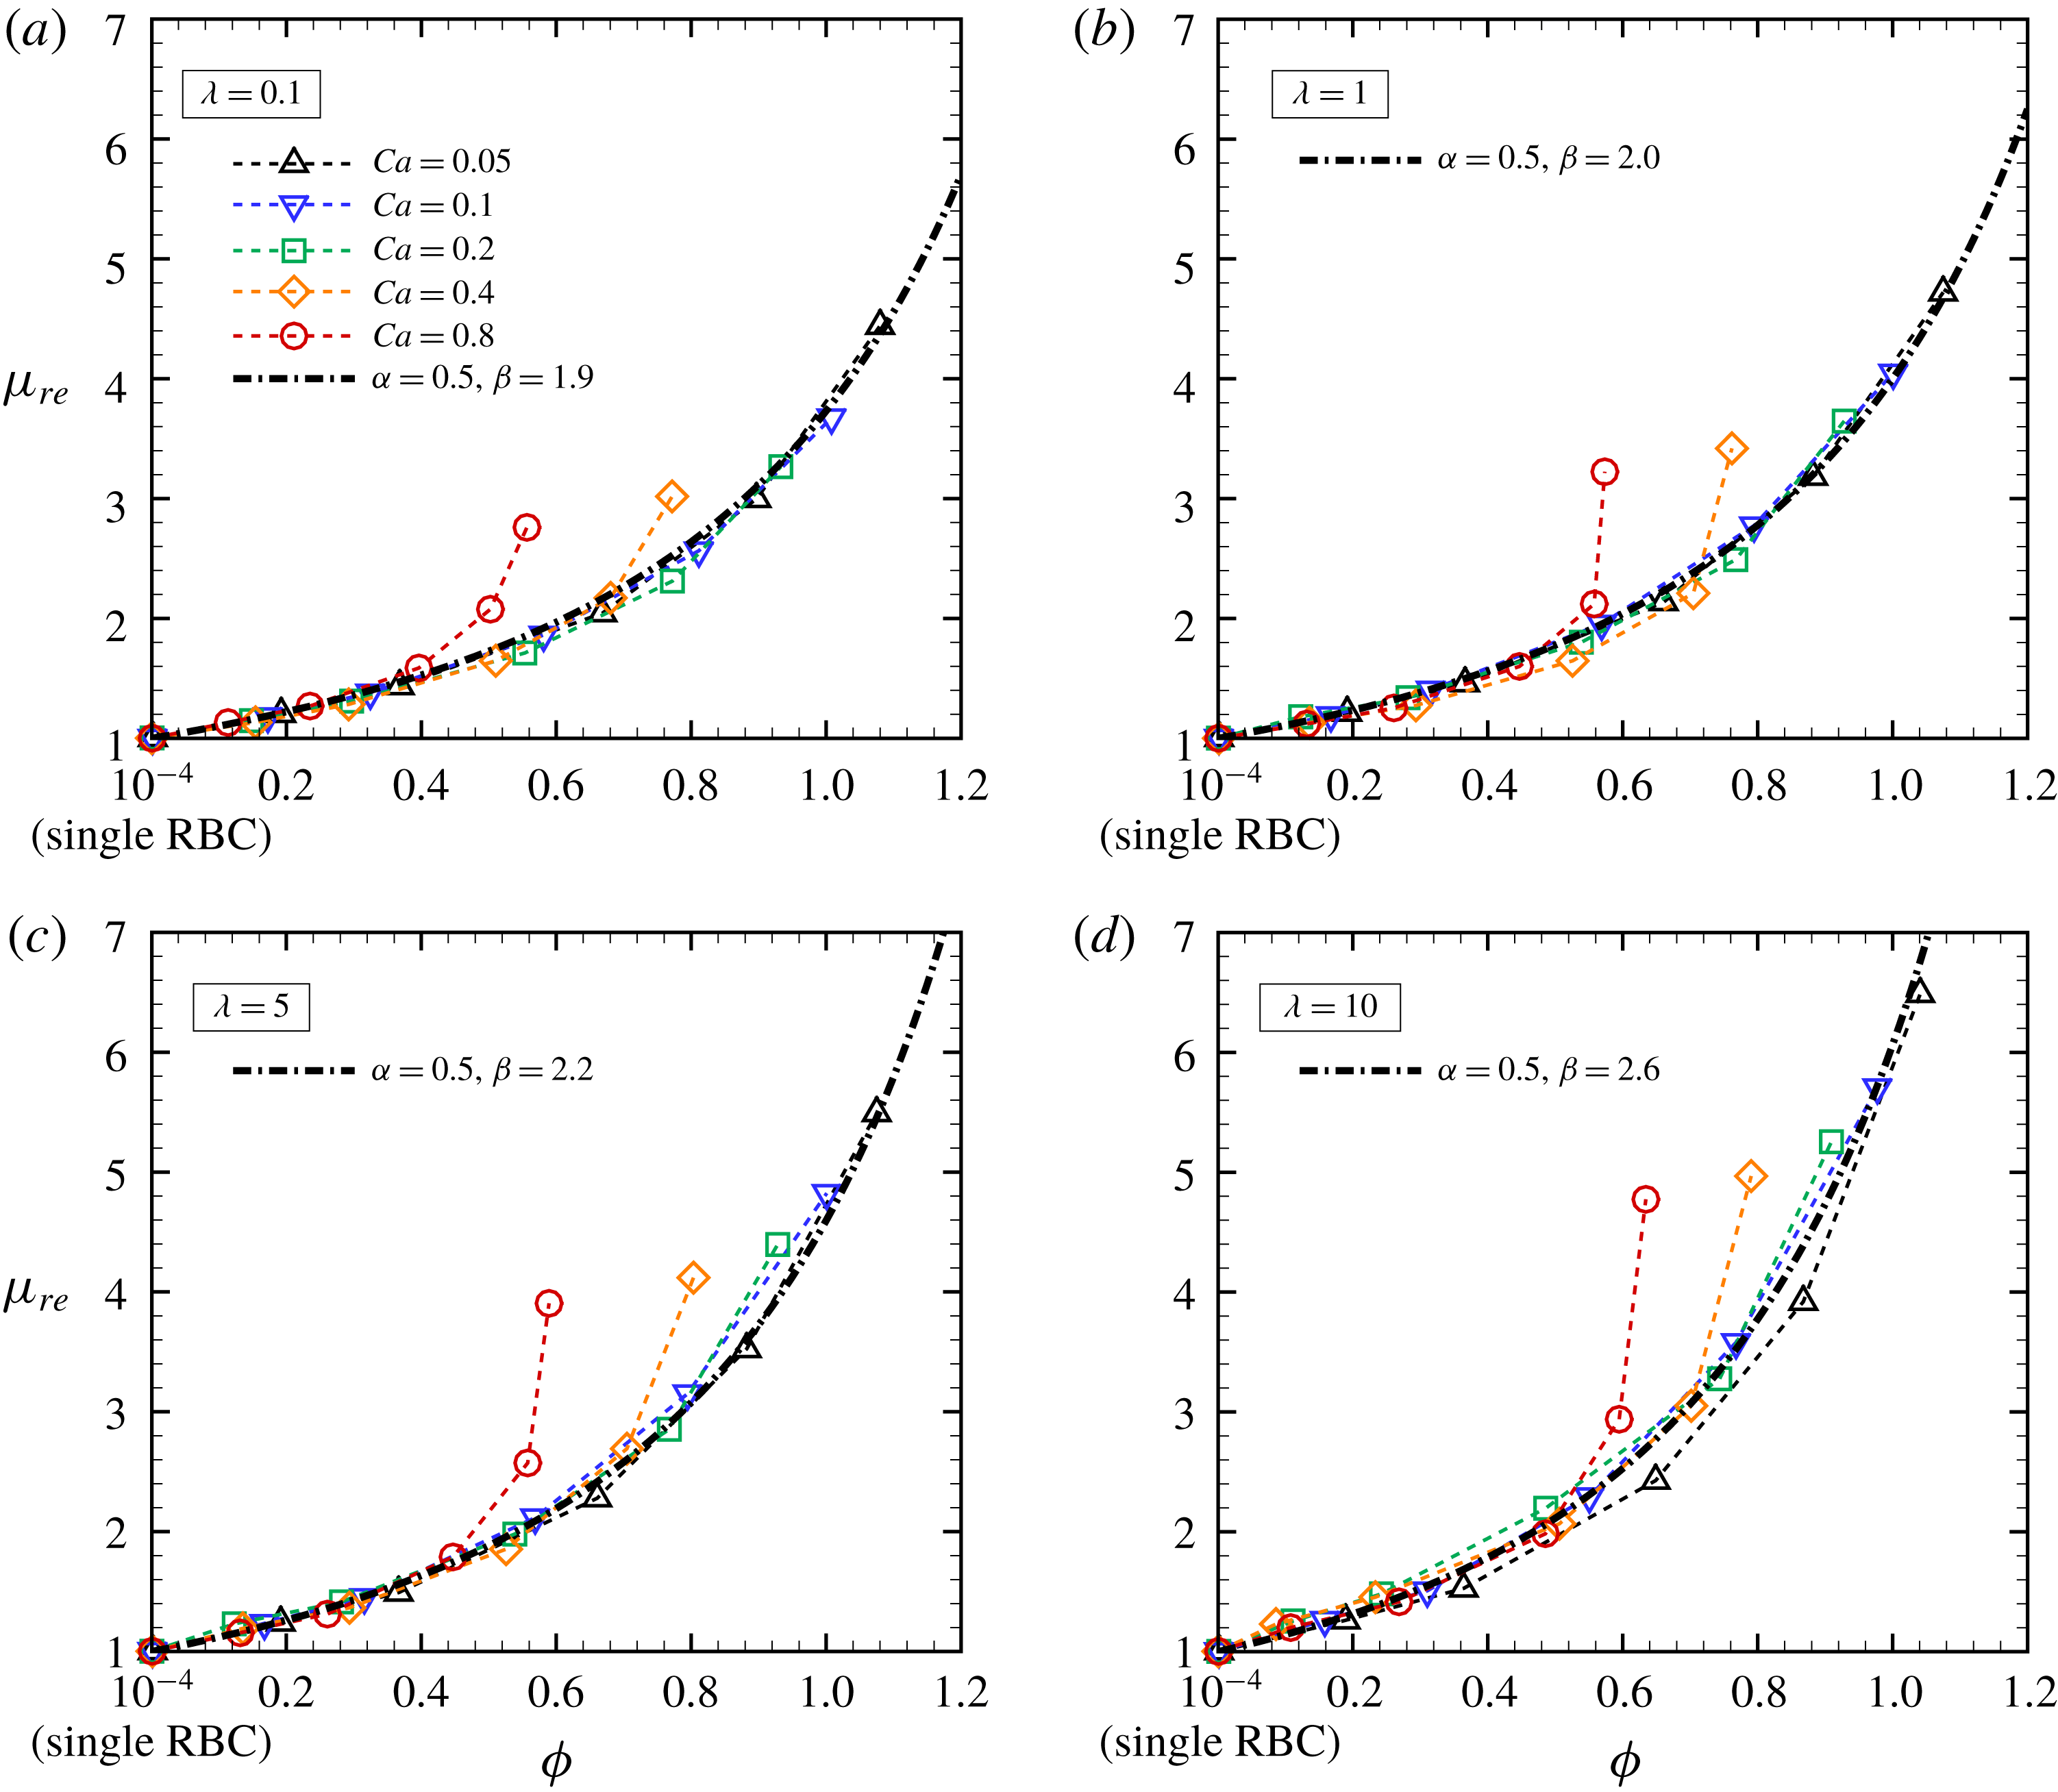
Relative viscosity
 $\unicode[STIX]{x1D707}_{re}$
as a function of the effective volume fraction
 $\unicode[STIX]{x1D719}_{e}$
for different
 $Ca$
at each specific viscosity ratio: (a)
 $\unicode[STIX]{x1D706}=0.1$
, (b)
 $\unicode[STIX]{x1D706}=1$
, (c)
 $\unicode[STIX]{x1D706}=5$
and (d)
 $\unicode[STIX]{x1D706}=10$
. The dash-dotted lines are exponential curves defined as
 $\unicode[STIX]{x1D707}_{re}=(1-\unicode[STIX]{x1D6FC}\unicode[STIX]{x1D719}_{e})^{-\unicode[STIX]{x1D6FD}}$
with
 $\unicode[STIX]{x1D6FC}=0.5$
and
 $\unicode[STIX]{x1D6FD}|_{\unicode[STIX]{x1D706}=0.1}=1.9$
,
 $\unicode[STIX]{x1D6FD}|_{\unicode[STIX]{x1D706}=1}=2.0$
,
 $\unicode[STIX]{x1D6FD}|_{\unicode[STIX]{x1D706}=5}=2.2$
and
 $\unicode[STIX]{x1D6FD}|_{\unicode[STIX]{x1D706}=10}=2.6$
.

4.3 Effective volume fraction
Conventionally, the relative viscosity
 $\unicode[STIX]{x1D707}_{re}$
(
 $=1+\unicode[STIX]{x1D707}_{sp}$
) of dilute and semi-dilute particulate suspensions can be described by a polynomial expression in the volume fraction
 $\unicode[STIX]{x1D719}$
(Einstein Reference Einstein1911; Taylor Reference Taylor1932; Stickel & Powell Reference Stickel and Powell2005). For example, Einstein (Reference Einstein1911) proposed for dilute suspensions of rigid particles that
 $\unicode[STIX]{x1D707}_{re}=1+2.5\unicode[STIX]{x1D719}$
, while Taylor (Reference Taylor1932) proposed a modified law for particles including an internal fluid:
 $\unicode[STIX]{x1D707}_{re}=1+2.5\tilde{\unicode[STIX]{x1D706}}\unicode[STIX]{x1D719}$
, where
 $\tilde{\unicode[STIX]{x1D706}}$
is Taylor’s factor defined as
 $\tilde{\unicode[STIX]{x1D706}}=(\unicode[STIX]{x1D706}+0.4)/(\unicode[STIX]{x1D706}+1)$
. However, our numerical results show that the intrinsic viscosity
 $\unicode[STIX]{x1D702}$
(
 $=\unicode[STIX]{x1D707}_{sp}/\unicode[STIX]{x1D719}$
) of RBC suspensions is not constant but first decreases from dilute to semi-dilute suspensions because of the mode change of RBCs from rolling to tumbling. This suggests that a simple polynomial approach cannot be applied to RBC suspensions even for low volume fractions; this issue cannot be solved by any higher-order expansions, since they necessarily involve particle–particle interactions and thus any higher-order coefficients would depend on the local flow and/or on the local microstructure. For high volume fractions, an exponential expression may be applicable. Rosti & Brandt (Reference Rosti and Brandt2018) proposed that the effective volume fraction
 $\unicode[STIX]{x1D719}_{e}$
, which is a collective volume fraction of spheres whose radius is defined with the semi-minor axis
 $a_{2}$
(here,
 $a_{1}\geqslant a_{3}\geqslant a_{2}$
) of deformed spherical particles, is able to describe the relative viscosity of suspensions of deformable particles. Here, we define the effective volume fraction
 $\unicode[STIX]{x1D719}_{e}$
with the semi-middle axis
 $a_{3}$
of a deformed RBC, i.e.
 $\unicode[STIX]{x1D719}_{e}=N^{R}4\unicode[STIX]{x03C0}a_{3}^{3}/(3V)$
, where
 $N^{R}$
is the number of RBCs in the computational box of volume
 $V$
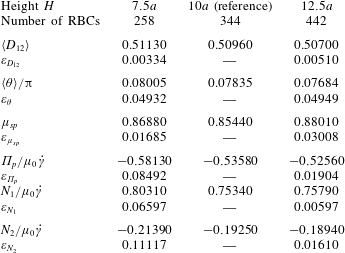
. The length of the semi-middle axis
 $a_{3}$
of the deformed RBC is obtained from the eigenvalues of the inertia tensor of an equivalent ellipsoid approximating the deformed RBC (Ramanujan & Pozrikidis Reference Ramanujan and Pozrikidis1998). Figure 11 shows the relative viscosity
 $\unicode[STIX]{x1D707}_{re}$
as a function of the effective volume fraction
 $\unicode[STIX]{x1D719}_{e}$
: for each
 $\unicode[STIX]{x1D706}$
, the numerical results for
 $\unicode[STIX]{x1D707}_{re}$
successfully collapse on a single nonlinear master curve, except for the case with high
 $Ca\geqslant 0.4$
, where the fit works only in the case of low/moderate volume fraction, and fails in the case of a fully dense suspension. The fail of the fit for high
 $Ca$
and
 $\unicode[STIX]{x1D719}$
is limited to the cases of RBCs showing complex shapes, e.g. multilobes. Indeed, in these cases the shape is mostly asymmetric and its approximation with an equivalent ellipsoid is not reliable. The single nonlinear curves are fitted by a general exponential expression:
 $$\begin{eqnarray}\unicode[STIX]{x1D707}_{re}=(1-\unicode[STIX]{x1D6FC}\unicode[STIX]{x1D719}_{e})^{-\unicode[STIX]{x1D6FD}},\end{eqnarray}$$
where
 $\unicode[STIX]{x1D6FC}=0.5$
and
 $\unicode[STIX]{x1D6FD}|_{\unicode[STIX]{x1D706}=0.1}=1.9$
,
 $\unicode[STIX]{x1D6FD}|_{\unicode[STIX]{x1D706}=1}=2.0$
,
 $\unicode[STIX]{x1D6FD}|_{\unicode[STIX]{x1D706}=5}=2.2$
and
 $\unicode[STIX]{x1D6FD}|_{\unicode[STIX]{x1D706}=10}=2.6$
. The coefficients
 $\unicode[STIX]{x1D6FC}$
and
 $\unicode[STIX]{x1D6FD}$
in (4.2) are related to those in the Krieger–Dougherty formula (4.1) by the following relations:
 $\unicode[STIX]{x1D6FC}=1/\unicode[STIX]{x1D719}_{m}$
and
 $\unicode[STIX]{x1D6FD}=-\unicode[STIX]{x1D702}\unicode[STIX]{x1D719}_{m}$
; Tao & Huang (Reference Tao and Huang2011) proposed the following values for the coefficients:
 $\unicode[STIX]{x1D719}_{m}=0.72$
and
 $\unicode[STIX]{x1D702}=2.3$
. Gross et al. (Reference Gross, Krüger and Varnik2014) proposed a toy model based on the effective medium theory by considering the effects of
 $Ca$
and higher volume fraction
 $\unicode[STIX]{x1D719}$
, but up to now no model has been able to fully predict the behaviour of the relative viscosity. The next challenge may be constructing a model that is able to cover a wide range of viscosity ratios and large deformation of RBCs.
5 Conclusion
We numerically investigate the rheology of a suspension of RBCs in a wall-bounded shear flow for a wide range of volume fractions
 $\unicode[STIX]{x1D719}$
, viscosity ratios
 $\unicode[STIX]{x1D706}$
and capillary numbers
 $Ca$
assuming the Stokes flow regime. The RBCs are modelled as biconcave capsules, whose membrane follows the SK constitutive law. The problem is solved numerically through GPU computing, using the LBM for the inner and outer fluid and the FEM to follow the deformation of the RBC membranes.
A single RBC subjected to low
 $Ca$
tends to orient to the shear plane and exhibits rolling motion as a stable mode associated with higher intrinsic viscosity
 $\unicode[STIX]{x1D702}$
(
 $=\unicode[STIX]{x1D707}_{sp}/\unicode[STIX]{x1D719}$
) than tumbling motion. As
 $Ca$
increases, the mode shifts from rolling to swinging motion, and the intrinsic viscosity
 $\unicode[STIX]{x1D702}$
decreases. Hydrodynamic interactions (higher volume fraction) also allow RBCs to exhibit the tumbling or swinging motions resulting in a decrease of the intrinsic viscosity
 $\unicode[STIX]{x1D702}$
for dilute and semi-dilute suspensions. This suggests that a simple polynomial equation of the volume fraction
 $\unicode[STIX]{x1D719}$
for the relative viscosity
 $\unicode[STIX]{x1D707}_{re}$
(
 $=1+\unicode[STIX]{x1D707}_{sp}$
) cannot be applied to RBC suspensions at low volume fractions. The relative viscosity
 $\unicode[STIX]{x1D707}_{re}$
for high volume fractions, however, can be well described as a function of an effective volume fraction
 $\unicode[STIX]{x1D719}_{e}$
, defined by the volume of spheres of radius equal to the semi-middle axis of the deformed RBC. For all
 $\unicode[STIX]{x1D706}$
considered, the relative viscosity
 $\unicode[STIX]{x1D707}_{re}$
successfully collapses on a single nonlinear curve as a function of
 $\unicode[STIX]{x1D719}_{e}$
except for the case with
 $Ca\geqslant 0.4$
, where the fit works only in the case of low/moderate volume fractions.
We hope that our numerical results will stimulate the numerical and experimental study of haemorheology, aiming to gain insight not only into suspension rheology but also into the precise diagnosis of patients with haematologic disorders.
Acknowledgements
This research was supported by JSPS KAKENHI grant nos JP17K13015 and JP18H04100, and by the Keihanshin Consortium for Fostering the Next Generation of Global Leaders in Research (K-CONNEX), established by Human Resource Development Program for Science and Technology, and also by MEXT as ‘Priority Issue on Post-K Computer’ (Integrated Computational Life Science to Support Personalized and Preventive Medicine) (Project ID: hp180202). M.E.R. and L.B. are grateful for the financial support of European Research Council grant no. ERC-2013-CoG-616186, TRITOS, and of the Swedish Research Council (VR), through the Outstanding Young Researcher Award. Last but not least, N.T. thanks Dr D. Matsunaga and also Dr T. Omori for helpful discussions.
Supplementary movies
Supplementary movies are available at https://doi.org/10.1017/jfm.2019.393.
Appendix A. Numerical set-up
A.1 Behaviour of a single capsule and RBC with different viscosity ratios
To validate our numerical approach to update the viscosity in the fluid lattice, we tested the deformation of a single spherical capsule for different
 $Ca$
and different viscosity ratios
 $\unicode[STIX]{x1D706}$
(
 $=0.2$
, 1, 5 and 10). The capsule deformation is quantified by the Taylor parameter
 $D_{12}$
, which is defined as
 $$\begin{eqnarray}\displaystyle D_{12}=\frac{|a_{1}-a_{2}|}{a_{1}+a_{2}}, & & \displaystyle\end{eqnarray}$$
where
 $a_{1}$
and
 $a_{2}$
are the lengths of the semi-major and semi-minor axes of the deformed capsule (or RBC), and are obtained from the eigenvalues of the inertia tensor of an equivalent ellipsoid approximating the deformed capsule (Ramanujan & Pozrikidis Reference Ramanujan and Pozrikidis1998). Time average starts after the non-dimensional time
 $\dot{\unicode[STIX]{x1D6FE}}t=40$
to reduce the influence of the initial conditions, and continues to
 $\dot{\unicode[STIX]{x1D6FE}}t=100$
. Our numerical results are compared with previous numerical results obtained with the BIM (Foessel et al.
Reference Foessel, Walter, Salsac and Barthés-Biesel2011). The resolutions of the fluid and membrane meshes are the same as in the analysis above. For reasonable comparison with previous numerical study (Foessel et al.
Reference Foessel, Walter, Salsac and Barthés-Biesel2011), the same parameters are considered and the membrane is modelled with the SK constitutive law (2.6) with the area dilation modulus
 $C=1$
and without bending resistance. Figure 12(a) shows that our numerical results are in good agreement with those of Foessel et al. (Reference Foessel, Walter, Salsac and Barthés-Biesel2011).
(a) Time-averaged Taylor parameter
 $D_{12}$
of an SK spherical capsule as a function of
 $Ca$
for different viscosity ratios
 $\unicode[STIX]{x1D706}$
(
 $=0.2$
, 1, 5, and 10); previous numerical results of Foessel et al. (Reference Foessel, Walter, Salsac and Barthés-Biesel2011) are also displayed. The inset represents a tank-treading spherical capsule at
 $Ca=1.0$
and
 $\unicode[STIX]{x1D706}=1$
. (b) Comparison of the deformation of an RBC stretched by optical tweezers in an experiment (Suresh et al.
Reference Suresh, Spatz, Mills, Micoulet, Dao, Lim, Beil and Seufferlein2005) and in our numerical simulation: an RBC membrane with
 $G_{s}=4~\unicode[STIX]{x03BC}\text{N}~\text{m}^{-1}$
,
 $C=10^{2}$
and
 $k_{b}=5\times 10^{-19}$
J is laterally stretched by applying constant forces to two points of the membrane surface of radius equal to
 $1~\unicode[STIX]{x03BC}\text{m}$
. The inset represents the RBC stretched by 100 pN forces. (c) Time-averaged normal stress difference
 $N_{i}/\unicode[STIX]{x1D719}\unicode[STIX]{x1D707}_{0}\dot{\unicode[STIX]{x1D6FE}}$
(
 $i=1$
and 2) for
 $\unicode[STIX]{x1D706}=1$
and 3; previous numerical results of Omori et al. (Reference Omori, Ishikawa, Imai and Yamaguchi2014) are also displayed. The inset represents a tank-treading RBC at
 $Ca=1.0$
and
 $\unicode[STIX]{x1D706}=1$
.

To characterize the surface shear elastic modulus
 $G_{s}$
for RBCs, we performed a numerical simulation reproducing the stretching of RBCs by optical tweezers (Suresh et al.
Reference Suresh, Spatz, Mills, Micoulet, Dao, Lim, Beil and Seufferlein2005); see figure 12(b). An RBC membrane with
 $G_{s}=4~\unicode[STIX]{x03BC}\text{N}~\text{m}^{-1}$
,
 $C=10^{2}$
and
 $k_{b}=5\times 10^{-19}$
J is laterally stretched by applying constant forces to two points of the membrane surface of radius equal to
 $1~\unicode[STIX]{x03BC}\text{m}$
. Modulus
 $G_{s}$
is thus obtained to capture the nonlinear deformation curve obtained from the experiment. Using these parameters, we also tested the behaviour of a single RBC, and compare the normal stress differences
 $N_{i}/\unicode[STIX]{x1D719}\unicode[STIX]{x1D707}_{0}\dot{\unicode[STIX]{x1D6FE}}$
(
 $i=1$
and 2) with those of previous numerical results obtained with the BIM (Omori et al.
Reference Omori, Ishikawa, Imai and Yamaguchi2014) in figure 12(c). Again, our numerical results are in good agreement with those of the literature, although the value of
 $N_{1}/\unicode[STIX]{x1D719}\unicode[STIX]{x1D707}_{0}\dot{\unicode[STIX]{x1D6FE}}$
obtained with
 $\unicode[STIX]{x1D706}=3$
and
 $Ca$
(
 $=1$
) is slightly larger than that of the BIM.
A.2 Effect of the domain size
We have tested the computational domain size, especially the wall-to-wall distance
 $H$
, and investigated its effect on the suspension behaviour. Although the influence of
 $H$
upon particle shear stress and relative viscosity was systematically investigated by Krüger, Varnik & Raabe (Reference Krüger, Varnik and Raabe2011), and the same computational domain size as in our study has been successfully applied to previous numerical studies of particle suspensions (Picano et al.
Reference Picano, Breugem, Mitra and Brandt2013; Rosti & Brandt Reference Rosti and Brandt2018), we also tested several parameters of deformed RBCs for different domain heights
 $H$
(
 $=7.5a$
,
 $12.5a$
and
 $15a$
). The results of each parameter reported in table 1 are compared with those of the reference domain height
 $H=10a$
; in particular, we have analysed the ensemble average of the Taylor parameter
 $\langle D_{12}\rangle$
, the orientation angle
 $\langle \unicode[STIX]{x1D703}\rangle$
, the specific viscosity
 $\unicode[STIX]{x1D707}_{sp}$
, the particle pressure
 $\unicode[STIX]{x1D6F1}_{p}/\unicode[STIX]{x1D707}_{0}\dot{\unicode[STIX]{x1D6FE}}$
and the normal stress difference
 $N_{i}/\unicode[STIX]{x1D707}_{0}\dot{\unicode[STIX]{x1D6FE}}$
(
 $i=1$
and 2). Here, the ensemble average of a parameter
 $\langle \unicode[STIX]{x1D712}\rangle$
is defined as
 $$\begin{eqnarray}\displaystyle \langle \unicode[STIX]{x1D712}\rangle =\frac{1}{MN}\mathop{\sum }_{m}^{M}\mathop{\sum }_{n}^{N}\unicode[STIX]{x1D712}^{m,n}, & & \displaystyle\end{eqnarray}$$
where
 $M$
and
 $N$
are the number of time steps and capsules, respectively. The error for each observable is defined by
 $$\begin{eqnarray}\unicode[STIX]{x1D700}_{\unicode[STIX]{x1D712}}=\left|\frac{\langle \unicode[STIX]{x1D712}\rangle -\langle \unicode[STIX]{x1D712}^{ref}\rangle }{\langle \unicode[STIX]{x1D712}^{ref}\rangle }\right|,\end{eqnarray}$$
where the superscript
 $ref$
indicates the reference values. The results of each parameter and the corresponding relative errors are listed in table 1. Since differences between the case with the largest height (
 $H=12.5a$
) and our reference case are less than 5 % in the orientation angle and 3 % in the others, the results presented in this study are all obtained with the domain height of
 $H=10a$
.
Effect of domain height
 $H$
on the ensemble average of the Taylor parameter
 $\langle D_{12}\rangle$
, the orientation angle
 $\langle \unicode[STIX]{x1D703}\rangle$
, the specific viscosity
 $\unicode[STIX]{x1D707}_{sp}$
, the particle pressure
 $\unicode[STIX]{x1D6F1}_{p}/\unicode[STIX]{x1D707}_{0}\dot{\unicode[STIX]{x1D6FE}}$
and the normal stress difference
 $N_{i}/\unicode[STIX]{x1D707}_{0}\dot{\unicode[STIX]{x1D6FE}}$
(
 $i=1$
and 2). The error of each parameter
 $\unicode[STIX]{x1D700}_{\unicode[STIX]{x1D712}}$
is defined by (A 3). The simulations were performed at
 $\unicode[STIX]{x1D719}=0.21$
,
 $Ca=0.4$
and
 $\unicode[STIX]{x1D706}=5$
.

A.3 Suspension of spherical capsules
(a) Snapshots of numerical results of a suspension of NH spherical capsules for different volume fractions
 $\unicode[STIX]{x1D719}=0.12$
(left),
 $\unicode[STIX]{x1D719}=0.24$
(middle) and
 $\unicode[STIX]{x1D719}=0.35$
(right). Ensemble average of (b) Taylor parameter
 $\langle D_{12}\rangle$
, (c) orientation angle
 $\langle \unicode[STIX]{x1D703}\rangle /\unicode[STIX]{x03C0}$
, (d) specific viscosity
 $\unicode[STIX]{x1D707}_{sp}$
and (e) first and second normal stress differences
 $N_{i}/\unicode[STIX]{x1D707}_{0}\dot{\unicode[STIX]{x1D6FE}}$
(
 $i=1$
and 2) of NH spherical capsules, with viscosity ratio
 $\unicode[STIX]{x1D706}=1$
, subjected to
 $Ca=0.1$
as a function of the volume fraction
 $\unicode[STIX]{x1D719}$
. Our numerical results obtained with
 $\unicode[STIX]{x1D706}=1$
are compared with those reported in a previous numerical study of Matsunaga et al. (Reference Matsunaga, Imai, Yamaguchi and Ishikawa2016).

We simulate suspensions of neo-Hookean (NH) spherical capsules for different
 $Ca$
and
 $\unicode[STIX]{x1D719}$
= (0.12, 0.24 and 0.35), as reference for the results pertaining to RBCs and to further validate our numerical model. The NH constitutive law is given as
 $$\begin{eqnarray}w_{s}^{NH}=\frac{G_{s}}{2}\left(I_{1}-1+\frac{1}{I_{2}+1}\right).\end{eqnarray}$$
The viscosity ratio is set to be
 $\unicode[STIX]{x1D706}=1$
, and the bending modulus is the same as that of the model of RBCs in this study, i.e.
 $k_{b}=5\times 10^{-19}$
J. Our numerical results are compared with previous numerical results of NH spherical capsules simulated by the BIM in an unbounded domain obtained by Matsunaga et al. (Reference Matsunaga, Imai, Yamaguchi and Ishikawa2016).
Figure 13(a) shows the snapshots of our numerical results for different
 $\unicode[STIX]{x1D719}$
. The ensemble averages of the Taylor parameter
 $\langle D_{12}\rangle$
and of the orientation angle
 $\langle \unicode[STIX]{x1D703}\rangle$
of the NH spherical capsules as a function of the volume fraction
 $\unicode[STIX]{x1D719}$
are also shown in figure 13: the values of
 $\langle D_{12}\rangle$
increase with the volume fraction (figure 13
b), while the orientation angle decreases with it (figure 13
c). Both these quantities are in good agreement with the results from the literature (Matsunaga et al.
Reference Matsunaga, Imai, Yamaguchi and Ishikawa2016). Time averages of the specific viscosity
 $\unicode[STIX]{x1D707}_{sp}$
and of the normal stress differences
 $N_{i}$
(
 $i=1$
and 2) are also compared with those reported by Matsunaga et al. (Reference Matsunaga, Imai, Yamaguchi and Ishikawa2016), and depicted in figures 13(d) and 13(e), respectively. The suspension viscosity increases with the particle volume fraction, as the absolute value of the normal stress difference, being the first positive and the second negative. In our simulations, a small bending resistance (
 $k_{b}=5.0\times 10^{-19}$
J) is considered to avoid the membrane buckling. Since our numerical results are in very good agreement with those of the previous study of Matsunaga et al. (Reference Matsunaga, Imai, Yamaguchi and Ishikawa2016), and quantitatively similar to those obtained in a larger domain (§ A.2), we will continue to use the rectangular box that is considered as reference in § A.2 and include a weak bending stiffness.