INTRODUCTION
Radiocarbon (14C) is produced during the normal operation conditions of nuclear reactors in excess of natural production. Natural cosmogenic 14C is produced by the cosmic radiation in the upper atmosphere, where the thermal neutrons absorbed by nitrogen atoms. The natural Δ14C level in the biomass and in the atmospheric CO2 was about 0‰ (0.226 Bq/g carbon) in the preindustrial era and this level close to zero now as well, thanks to the decrease of the atmospheric 14C bomb-peak and increased fossil emissions (Buzinny Reference Buzinny2006; Graven et al. Reference Graven2015; Major et al. Reference Major, Haszpra, Rinyu, Futó, Bihari, Hammer and Molnár2018). 14C is produced in three main ways in nuclear reactors. The most common 14N (n, p)14C reaction generates a significant proportion of the 14C in the fuel, fuel cladding, coolant and moderator and impurity of different types of moderators. 14C is produced in a smaller proportion in the 17O (n, α) 14C reaction in the oxide fuel, coolant and moderator and in the 13C (n, γ) 14C reaction in graphite moderators (Davis Reference Davis, Carter, Moghissi and Khan1979; Chudy and Povinec Reference Chudy and Povinec1982; Povinec et al. Reference Povinec, Chudy and Sivo1986, Reference Povinec, Kwong, Kaizer, Molnár, Nies, Palcsu, Papp, Pham and Jean-Baptise2017; Molnár et al. Reference Molnár, Bujtás, Svingor, Futó and Svetlík2007). The form of the gaseous emission in the nuclear power plants depends on the reactor type. The main form of emission of 14C from boiling water reactors (BWRs) is CO2 in contrast to pressurized water reactors (PWRs) where the 14C is mainly emitted as hydrocarbon (CnHm), methane (CH4) form (90–95%) and only a small amount (5%) is emitted in CO2 (Yim et al. Reference Yim and Caron2006; Molnár et al. Reference Molnár, Bujtás, Svingor, Futó and Svetlík2007; Xu et al. Reference Xu, Cook, Cresswell, Dunbar, Freeman, Hastie, Hou, Jacobsson, Naysmith, Sanderson, Tripney and Yamaguchi2016a). There is no available gaseous 14C release data after the Fukushima accident. The Fukushima accident-derived 14C might be negligible compared with the bomb produced 14C and its production by cosmic rays (Povinec et al. Reference Povinec, Kwong, Kaizer, Molnár, Nies, Palcsu, Papp, Pham and Jean-Baptise2017). Since all of the reactors at the Fukushima Dai-ichi Nuclear Power Plant (FDNPP, 37°25′23″N, 141°01′59″E, Figure 1) are of the BWR type, retrospective monitoring of 14C release is worthy of investigation (Buzinny et al. Reference Buzinny, Los, Talerko and Tsigankov1998; Ješkovsky et al. Reference Ješkovsky, Povinec, Steier, Šivo, Richtarikova and Golser2015; Xu et al. Reference Xu, Cook, Cresswell, Dunbar, Freeman, Hastie, Hou, Jacobsson, Naysmith, Sanderson, Tripney and Yamaguchi2016a, Reference Xu, Cook, Cresswell, Dunbar, Freeman, Hou, Jacobsson, Knich, Naysmith, Sanderson and Tripney2016b). Several studies have been carried out to investigate the past and recent emission of nuclear power plants (NPPs) by tree rings thanks to the relatively long growing season of plants, as the trees record atmospheric CO2 by photosynthesis (Levin et al. Reference Levin, Kromer, Schoch–Fischer, Bruns, Münnich, Berdau, Vogel and Münnich1985; Janovics et al. Reference Janovics, Kern, Güttler, Wacker, Barnabás and Molnár2013).
Map showing the distance between the FDNPP and the sampling site in Koriyama city with locations of tree ring measurements in previous studies, Fukushima prefecture, Japan (based on Xu et al. 2015, Reference Xu, Cook, Cresswell, Dunbar, Freeman, Hastie, Hou, Jacobsson, Naysmith, Sanderson, Tripney and Yamaguchi2016a, Reference Xu, Cook, Cresswell, Dunbar, Freeman, Hou, Jacobsson, Knich, Naysmith, Sanderson and Tripney2016b; Chen et al. Reference Chen, Xu, Cook, Freeman, Hou, Naysmith and Yamaguchi2017).

Through the measurements of the 14C/12C ratio of tree rings, the atmospheric 14C concentration can be reconstructed. During normal operational conditions of NPPs, the 14C emission is relatively constant and low (Veres et al. Reference Veres, Hertelendi, Uchrin, Csaba, Barnabás, Ormai, Volent and Futó1995; Molnár et al. Reference Molnár, Bujtás, Svingor, Futó and Svetlík2007), but during nuclear accidents, an unpredictable amount of 14C and other radionuclides can escape from the reactors into the environment. 14C is considered a primary source of increased human radiation dose rate from industrial nuclear activities, because 14C can easily be incorporated into the food chain and accumulate in the body (IAEA 2001). However, in contrast to short-lived radionuclides, 14C needs a more complex preparation and measurement procedure and equipment like the accelerator mass spectrometry and liquid scintillation counting or gas proportional counting (Theodórsson Reference Theodórsson1991). Most of the 14C tree ring studies examined the area close to FDNPP to the northeast and south (Xu et al. Reference Xu, Cook, Cresswell, Dunbar, Freeman, Hastie, Hou, Jacobsson, Naysmith, Sanderson, Tripney and Yamaguchi2016a, Reference Xu, Cook, Cresswell, Dunbar, Freeman, Hou, Jacobsson, Knich, Naysmith, Sanderson and Tripney2016b; Chen et al Reference Chen, Xu, Cook, Freeman, Hou, Naysmith and Yamaguchi2017). We have little information about the distribution of 14C in the area west of the FDNPP. In this study, 14C concentration was measured in a tree from Koriyama, 60 km west of the FDNPP, a district which was not previously investigated for 14C (37°21′19.98″N, 140°20′35.77″E), to determine the possible effect of the 14C release from the FDNPP after the nuclear accident on 11 March 2011. The Hybrid Single Particle Lagrangian Integrated Trajectory (HYSPLIT) model was used to analyze the wind directions, meteorological conditions and air mass trajectories. These can affect the distribution of gaseous emissions after the nuclear accident (Stein et al. Reference Stein, Draxler, Rolph, Stunder and Ngan2015; Xu et al. Reference Xu, Cook, Cresswell, Dunbar, Freeman, Hastie, Hou, Jacobsson, Naysmith, Sanderson, Tripney and Yamaguchi2016a).
MATERIALS AND METHODS
Tree ring samples were collected from Koriyama city, at the Fukushima Prefecture Forestry Research center 60 km west of the FDNPP (37°21′19.98″N, 140°20′35.77″E). The surrounding area of the tree is urban but situated in a small forest away from the downtown. The majority of the previously published studies investigated the more local and closer effect of the 14C emission (Xu et al. Reference Xu, Cook, Cresswell, Dunbar, Freeman, Hastie, Hou, Jacobsson, Naysmith, Sanderson, Tripney and Yamaguchi2016a, Reference Xu, Cook, Cresswell, Dunbar, Freeman, Hou, Jacobsson, Knich, Naysmith, Sanderson and Tripney2016b; Chen et al. Reference Chen, Xu, Cook, Freeman, Hou, Naysmith and Yamaguchi2017). Xu et al. (Reference Xu, Cook, Cresswell, Dunbar, Freeman, Hastie, Hou, Jacobsson, Naysmith and Sanderson2015) investigated a southern area (Iwaki), 50 km from the FDNPP, but covered only the 2009–2013 period by annual resolution and applied an extrapolated background 14C dataset (NH zone 2). Iwaki area might have also some more impact based on the trajectories. Our study area may represent a still relatively close but likely least affected zone out from the possible pathways of the FDNPP 14C emission. Our secondary aim was to complete and assess the 14C level in Japanese tree rings for the period of 1990–2014 because the lack of environmental 14C results in the Japanese island that time. The tree was cut out and yearly tree rings was sliced. A standard BABAB (basic-acid-basic-acid-bleaching) cellulose preparation method was used to prepare the samples for the combustion (Nemec et al Reference Nemec, Wacker, Hajdas and Gäggeler2010; Molnár et al. Reference Molnár, Janovics, Major, Orsovszki, Gönczi, Veres, Leonard, Castle, Lange, Wacker, Hajdas and Jull2013a). MnO2 reagent was used as an oxidizing agent to convert the pure cellulose to CO2 at 550°C, 12 hr (Janovics et al. Reference Janovics, Futó and Molnár2018). The released gas was purified in a vacuum line with dry ice-isopropyl alcohol mixture and liquid nitrogen trap to collect the pure CO2 gas separately from H2O and other contaminants. Then, a sealed tube graphitization method was used to generate graphite for the accelerator mass spectrometry (AMS) measurements (Rinyu et al. Reference Rinyu, Molnár, Major, Nagy, Veres, Kimák, Wacker and Synal2013). The AMS measurements were performed in the Hertelendi Laboratory of Environmental Studies (HEKAL) laboratory, Isotope Climatology and Environmental Research Center, Debrecen, Hungary by a MICADAS (mini carbon dating system) type AMS (Molnár et al. Reference Molnár, Rinyu, Veres, Seiler, Wacker and Synal2013b). Δ14C data was expressed as per mil (‰) and compared with the Jungfraujoch, Switzerland (JFJ) atmospheric CO2 data (Hammer et al. Reference Hammer and Levin2017), which was used to represent the atmospheric background CO2 14C concentration (Levin and Kromer Reference Levin and Kromer2004). Anthropogenic (fossil or nuclear) component ratio in percent was calculated from the raw data based on the equation given by Suess (Reference Suess1955).
 $${\rm{Anthropogenic \,\,component}}\left( \% \right):\left( {\left( {1 - {{\Delta {{14}_{{C_{tr}}}} - \Delta {{14}_{{C_f}}}} \over {\Delta {{14}_{{C_{bg}}}} - \Delta {{14}_{{C_f}}}}}} \right) \times - 1} \right) \times 100$$
Where the Δ14C is the per mil 14C depletion/enrichment with regard to standard and normalized for isotope fractionation and the age of the sample (Stenström et al. Reference Stenström, Skog, Georgiadou, Grenberg and Johansson2011), the Δ14Ctr is the 14C content of the tree ring, Δ14Cf is the 14C content of fossil emissions (equal to –1000‰, as it is 14C free) and Δ14Cbg is the 14C content of the atmospheric CO2 which represent the Δ14C activity of CO2 samples from the high latitude background station (JFJ as Jungfraujoch, Switzerland). We used JFJ as a background reference as we wanted to compare our result to the previously published papers (Xu et al. Reference Xu, Cook, Cresswell, Dunbar, Freeman, Hastie, Hou, Jacobsson, Naysmith and Sanderson2015, Reference Xu, Cook, Cresswell, Dunbar, Freeman, Hastie, Hou, Jacobsson, Naysmith, Sanderson, Tripney and Yamaguchi2016a, Reference Xu, Cook, Cresswell, Dunbar, Freeman, Hou, Jacobsson, Knich, Naysmith, Sanderson and Tripney2016b; Chen et al. Reference Chen, Xu, Cook, Freeman, Hou, Naysmith and Yamaguchi2017) which all used NH zone 2 and Shauisland (SIL) as background reference data. No available any other continuous Japanese atmospheric 14CO2 background data for the investigated period (1990–2014).
A similar equation was proposed by Suess (Reference Suess1955) to determine the extent of the local anthropogenic Suess effect, which now works in the same way (just the opposite direction) for the quantification of the excess anthropogenic 14C. If the anthropogenic component is negative this indicates an input of fossil carbon. Furthermore, if the difference between the Δ14Ctr and Δ14Cbg is positive, this could indicate the emission of anthropogenic 14C from a nuclear source.
Trajectory Model
A Hybrid Single Particle Lagrangian Integrated Trajectory (HYSPLIT) backward and forward model was used to calculate the air particles trajectories after the Fukushima Dai-ichi nuclear accident based on meteorological, pressure data. The Archive Global Data Assimilation System (GDAS) meteorological dataset was used to run the trajectory models. The GDAS0P5 archive dataset has 0.5° horizontal resolution and 55 vertical layers (Lin Su et al. Reference Su, Yuan, Fung and Lau2015). Backward trajectories can demonstrate the sources of the air masses, while forward trajectories can calculate the future route of the air mass from a known source (Pirouzmand et al. Reference Pirouzmand, Kowsar and Dehghani2018). In this study, 36- and 72-hr-long forward trajectories were run four times every day (00UTC, 06UTC, 12UTC, and 18UTC). They model the airflows from the power plant during March and the growing season from the FDNPP in 2011. Additionally, 72-hr-long backward trajectories with the same resolution (started at 00UTC, 06UTC, 12UTC, and 18UTC in every day) were run in the growing season (7 months, March–September) to model the sources of the air masses. We used the clustering tool of the HYSPLIT model to make clusters from the typical trajectories. Generally, we allowed the model to generate five different typical clusters from the individual trajectories for more accurate separation of source areas for the investigated period (Draxler et al. Reference Draxler and Hess1998; Xu et al. Reference Xu, Cook, Cresswell, Dunbar, Freeman, Hou, Jacobsson, Knich, Naysmith, Sanderson and Tripney2016b).
RESULTS AND DISCUSSION
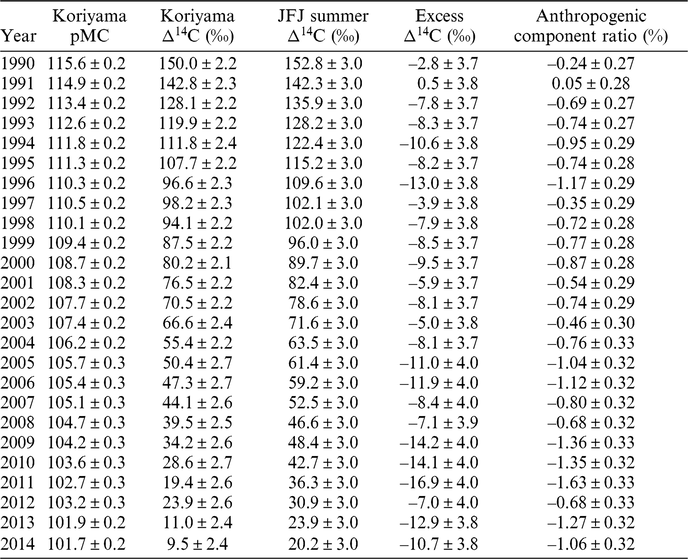
Comparing our 14C results with literature data (Xu et al. Reference Xu, Cook, Cresswell, Dunbar, Freeman, Hastie, Hou, Jacobsson, Naysmith and Sanderson2015, Reference Xu, Cook, Cresswell, Dunbar, Freeman, Hastie, Hou, Jacobsson, Naysmith, Sanderson, Tripney and Yamaguchi2016a, Reference Xu, Cook, Cresswell, Dunbar, Freeman, Hou, Jacobsson, Knich, Naysmith, Sanderson and Tripney2016b; Chen et al. Reference Chen, Xu, Cook, Freeman, Hou, Naysmith and Yamaguchi2017), there is a detectable Suess effect in our study. As shown in Table 1 and Figure 2, in the 2011 tree ring, there is a greater decrease in the Δ14C activity in Koriyama. The decline of the Koriyama curve is relatively continuous from 2004, except in 2011, when a larger decrease was observed. We suggest this rapid decrease occurred because of the increased usage of fossil resources after the Japanese nuclear accident, when most of the reactors were shut down and the required energy was replaced mainly by fossil energy resources (EIA 2017). As Table 1 and Figure 3 show, the calculated anthropogenic component ratio varies between +0.5 and –1.6%, with the average of –0.83 ± 0.01% and the highest fossil component ratio was observed in the year of the accident, 2011. The fossil component ratio slightly rises in the Koriyama samples, presumably mainly related to increased consumption of fossil resources. The measured tree-ring results do not show any excess 14C activity compared with the background atmospheric data from Jungfraujoch during the growing season, but rather they are slightly depleted.
Results of whole tree-ring cellulose AMS measurements, background atmospheric data, calculated excess Δ14C and anthropogenic component ratio

Temporal variation of Δ14C values of background CO2 (JFJ), whole Koriyama tree ring cellulose data and earlier data at a) Okuma 1 km (a) SW (Xu et al. Reference Xu, Cook, Cresswell, Dunbar, Freeman, Hastie, Hou, Jacobsson, Naysmith, Sanderson, Tripney and Yamaguchi2016a); b) Okuma 1km (b) SW (Chent et al. Reference Chen, Xu, Cook, Freeman, Hou, Naysmith and Yamaguchi2017); c) Okuma 2 km (a) SW (Chen et al. Reference Chen, Xu, Cook, Freeman, Hou, Naysmith and Yamaguchi2017); d) Okuma 2 km (b) SW (Chen et al Reference Chen, Xu, Cook, Freeman, Hou, Naysmith and Yamaguchi2017); e) Futaba 2.5 km NW (Xu et al. Reference Xu, Cook, Cresswell, Dunbar, Freeman, Hou, Jacobsson, Knich, Naysmith, Sanderson and Tripney2016b); f) Namie 8 km N (Xu et al. Reference Xu, Cook, Cresswell, Dunbar, Freeman, Hou, Jacobsson, Knich, Naysmith, Sanderson and Tripney2016b); g) Tomioka 9 km (a) S (Chen et al. Reference Chen, Xu, Cook, Freeman, Hou, Naysmith and Yamaguchi2017); h) Tomioka 9 km (b) S (Chen et al. Reference Chen, Xu, Cook, Freeman, Hou, Naysmith and Yamaguchi2017); i) Takase 11 km NW (Xu et al. Reference Xu, Cook, Cresswell, Dunbar, Freeman, Hou, Jacobsson, Knich, Naysmith, Sanderson and Tripney2016b); j) Ogaki 14 km NW (Xu et al Reference Xu, Cook, Cresswell, Dunbar, Freeman, Hou, Jacobsson, Knich, Naysmith, Sanderson and Tripney2016b); k) Shimotsushima 32 km NW (Xu et al. Reference Xu, Cook, Cresswell, Dunbar, Freeman, Hou, Jacobsson, Knich, Naysmith, Sanderson and Tripney2016b); l) Yamakiya 38 km NW (Xu et al. Reference Xu, Cook, Cresswell, Dunbar, Freeman, Hou, Jacobsson, Knich, Naysmith, Sanderson and Tripney2016b); m) Iwaki 50 km SW (Xu et al. 2015).

Temporal variation of anthropogenic component (%) of tree ring samples from Koriyama.

The difference between the JFJ summer (May–August) and Koriyama data is increasing with time between 1990 and 2014, as it is also shown in the increasing of fossil component ratio (Table 1), however the increasing of the ratio is not constant. This is because the ratio depends on the weather, meteorological conditions and both local and global fossil CO2 emissions. As the Suess effect dilutes the local 14C concentration by 14C-free fossil CO2, this effect may have masked the 14C signal from urban radioactive releases and nuclear accidents.
Our results do not show any detectable nuclear release of 14C observed in the Koriyama tree ring, 60 km from the Fukushima Dai-ichi nuclear power plant, nor any other more distant nuclear power plants located in the coastal zone of Japan. The Suess effect was close to zero in 1990 and 1991 but after then, the fossil contribution exceeded –1.0%, then in 2011, after the FDNPP nuclear accident, this effect was the highest at –1.63% (Figure 3).
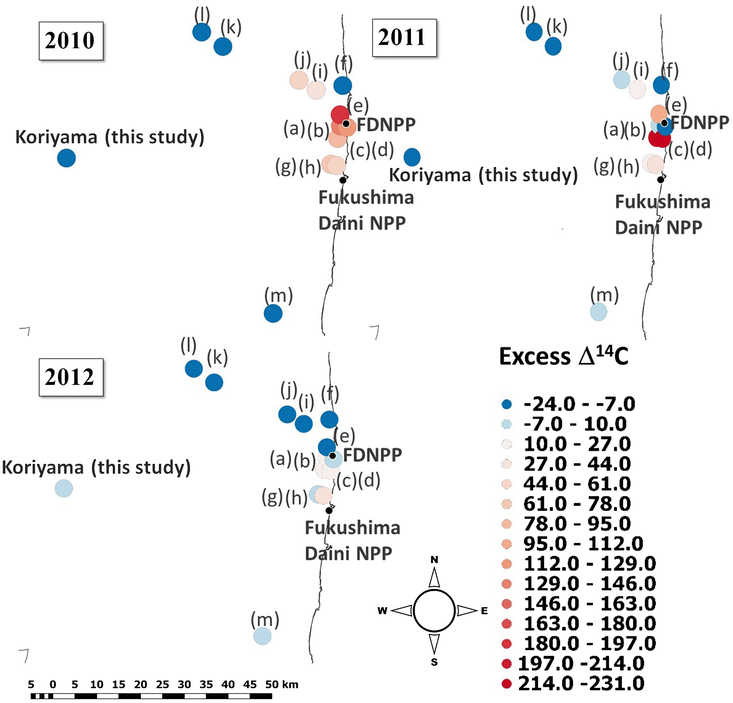
Figure 4 shows the temporal changes in 14C concentrations in tree rings from 2010 to 2012, and includes data from Xu et al. (Reference Xu, Cook, Cresswell, Dunbar, Freeman, Hastie, Hou, Jacobsson, Naysmith and Sanderson2015, Reference Xu, Cook, Cresswell, Dunbar, Freeman, Hastie, Hou, Jacobsson, Naysmith, Sanderson, Tripney and Yamaguchi2016a, Reference Xu, Cook, Cresswell, Dunbar, Freeman, Hou, Jacobsson, Knich, Naysmith, Sanderson and Tripney2016b) and Chen et al. (Reference Chen, Xu, Cook, Freeman, Hou, Naysmith and Yamaguchi2017), along with our measurements on the map. The vicinity of the FDNPP was relatively enriched in 14C between 2010 and 2011, but after the FDNPP accident, in 2012, the vicinity of the power plant was observably depleted in 14C. This means the 14C excess could be higher close to the power plant than the calculations estimate by the subtraction of background level, because the local or regional fossil-fuel emissions could hide > 10‰ 14C as the relatively highly depleted northern area shows in the figure. This consideration suggests that the 14C load estimated from global atmospheric background stations, such as JFJ, may not be completely correct for Japan.
Excess Δ14C map based on literature data and our investigations: (a) Okuma 1 km (a) SW (Xu et al. Reference Xu, Cook, Cresswell, Dunbar, Freeman, Hastie, Hou, Jacobsson, Naysmith, Sanderson, Tripney and Yamaguchi2016a); (b) Okuma 1 km (b) SW (Chent et al. Reference Chen, Xu, Cook, Freeman, Hou, Naysmith and Yamaguchi2017); (c) Okuma 2 km (a) SW (Chen et al. Reference Chen, Xu, Cook, Freeman, Hou, Naysmith and Yamaguchi2017); (d) Okuma 2 km (b) SW (Chen et al Reference Chen, Xu, Cook, Freeman, Hou, Naysmith and Yamaguchi2017); (e) Futaba 2.5 km NW (Xu et al. Reference Xu, Cook, Cresswell, Dunbar, Freeman, Hou, Jacobsson, Knich, Naysmith, Sanderson and Tripney2016b); (f) Namie 8 km N (Xu et al. Reference Xu, Cook, Cresswell, Dunbar, Freeman, Hou, Jacobsson, Knich, Naysmith, Sanderson and Tripney2016b); (g) Tomioka 9 km (a) S (Chen et al. Reference Chen, Xu, Cook, Freeman, Hou, Naysmith and Yamaguchi2017); (h) Tomioka 9 km (b) S (Chen et al. Reference Chen, Xu, Cook, Freeman, Hou, Naysmith and Yamaguchi2017); (i) Takase 11 km NW (Xu et al. Reference Xu, Cook, Cresswell, Dunbar, Freeman, Hou, Jacobsson, Knich, Naysmith, Sanderson and Tripney2016b); (j) Ogaki 14 km NW (Xu et al Reference Xu, Cook, Cresswell, Dunbar, Freeman, Hou, Jacobsson, Knich, Naysmith, Sanderson and Tripney2016b); (k) Shimotsushima 32 km NW (Xu et al. Reference Xu, Cook, Cresswell, Dunbar, Freeman, Hou, Jacobsson, Knich, Naysmith, Sanderson and Tripney2016b); (l) Yamakiya 38 km NW (Xu et al. Reference Xu, Cook, Cresswell, Dunbar, Freeman, Hou, Jacobsson, Knich, Naysmith, Sanderson and Tripney2016b); (m) Iwaki 50 km SW (Xu et al. 2015).

Comparison of the data from other studies (Xu et al. Reference Xu, Cook, Cresswell, Dunbar, Freeman, Hastie, Hou, Jacobsson, Naysmith and Sanderson2015, Reference Xu, Cook, Cresswell, Dunbar, Freeman, Hastie, Hou, Jacobsson, Naysmith, Sanderson, Tripney and Yamaguchi2016a, Reference Xu, Cook, Cresswell, Dunbar, Freeman, Hou, Jacobsson, Knich, Naysmith, Sanderson and Tripney2016b; Chen et al. Reference Chen, Xu, Cook, Freeman, Hou, Naysmith and Yamaguchi2017) with our measurements clearly shows that the 14C activity rapidly decreases with distance from the FDNPP (Figures 4 and 5). After the accident in 2011, the 14C concentration returns to the atmospheric background or even lower levels. Close to the power plant, there was more than 200‰ excess 14C, which rapidly decreased with the distance, but between 8 and 20 km, there is a visible and measurable excess 14C in the tree rings in Tomioka, Takase and Ogaki (Xu et al. Reference Xu, Cook, Cresswell, Dunbar, Freeman, Hou, Jacobsson, Knich, Naysmith, Sanderson and Tripney2016b; Chen et al. Reference Chen, Xu, Cook, Freeman, Hou, Naysmith and Yamaguchi2017). Beyond 30 km, there is no detectable 14C signal, neither in our studies nor in other investigations (Xu et al. Reference Xu, Cook, Cresswell, Dunbar, Freeman, Hastie, Hou, Jacobsson, Naysmith and Sanderson2015, Reference Xu, Cook, Cresswell, Dunbar, Freeman, Hastie, Hou, Jacobsson, Naysmith, Sanderson, Tripney and Yamaguchi2016a, Reference Xu, Cook, Cresswell, Dunbar, Freeman, Hou, Jacobsson, Knich, Naysmith, Sanderson and Tripney2016b; Chen et al. Reference Chen, Xu, Cook, Freeman, Hou, Naysmith and Yamaguchi2017). Points (g) and (h) are located close to the Fukushima Daini Nuclear Power plant, which may cause this observable 14C signal at those locations, 9 km from the FDNPP. For the better understanding the results of AMS measurements, we modeled the possible pathways of air masses from the FDNPP by forward trajectories and to the sampling point by backward trajectories (Figures 6 and 7).
Distance dependence of excess 14C: [A] south of the FDNPP; [B] north of the FDNPP (a) Okuma 1 km (a) SW (Xu et al. Reference Xu, Cook, Cresswell, Dunbar, Freeman, Hastie, Hou, Jacobsson, Naysmith, Sanderson, Tripney and Yamaguchi2016a); (b) Okuma 1 km (b) SW (Chent et al. Reference Chen, Xu, Cook, Freeman, Hou, Naysmith and Yamaguchi2017); (c) Okuma 2 km (a) SW (Chen et al. Reference Chen, Xu, Cook, Freeman, Hou, Naysmith and Yamaguchi2017); (d) Okuma 2 km (b) SW (Chen et al Reference Chen, Xu, Cook, Freeman, Hou, Naysmith and Yamaguchi2017); (e) Futaba 2.5 km NW (Xu et al. Reference Xu, Cook, Cresswell, Dunbar, Freeman, Hou, Jacobsson, Knich, Naysmith, Sanderson and Tripney2016b); (g) Tomioka 9 km (a) S (Chen et al. Reference Chen, Xu, Cook, Freeman, Hou, Naysmith and Yamaguchi2017); (h) Tomioka 9 km (b) S (Chen et al. Reference Chen, Xu, Cook, Freeman, Hou, Naysmith and Yamaguchi2017); (i) Takase 11 km NW (Xu et al. Reference Xu, Cook, Cresswell, Dunbar, Freeman, Hou, Jacobsson, Knich, Naysmith, Sanderson and Tripney2016b); (j) Ogaki 14 km NW (Xu et al Reference Xu, Cook, Cresswell, Dunbar, Freeman, Hou, Jacobsson, Knich, Naysmith, Sanderson and Tripney2016b); (k) Shimotsushima 32 km NW (Xu et al. Reference Xu, Cook, Cresswell, Dunbar, Freeman, Hou, Jacobsson, Knich, Naysmith, Sanderson and Tripney2016b); (l) Yamakiya 38 km NW (Xu et al. Reference Xu, Cook, Cresswell, Dunbar, Freeman, Hou, Jacobsson, Knich, Naysmith, Sanderson and Tripney2016b); (m) Iwaki 50 km SW (Xu et al. 2015).

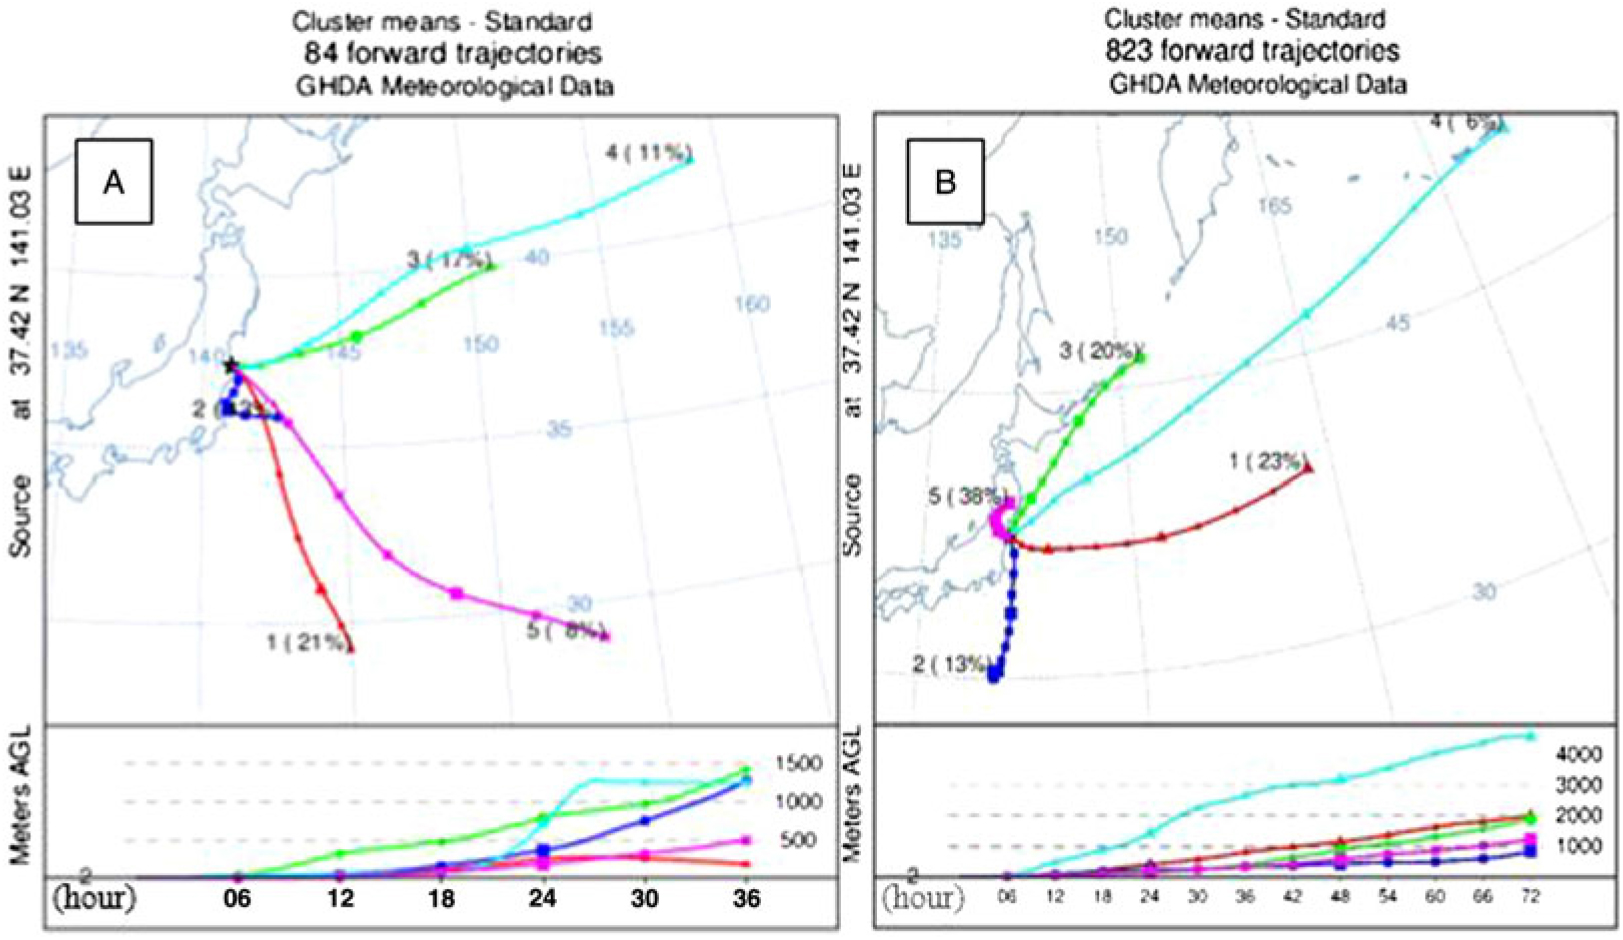
(A) Forward trajectory clusters from March 11–31, 2011, started from the FDNPP and 2 m above ground level; (B) forward trajectory clusters for the growing season (March–September) in 2011, started from the FDNPP, 2 m above ground level.

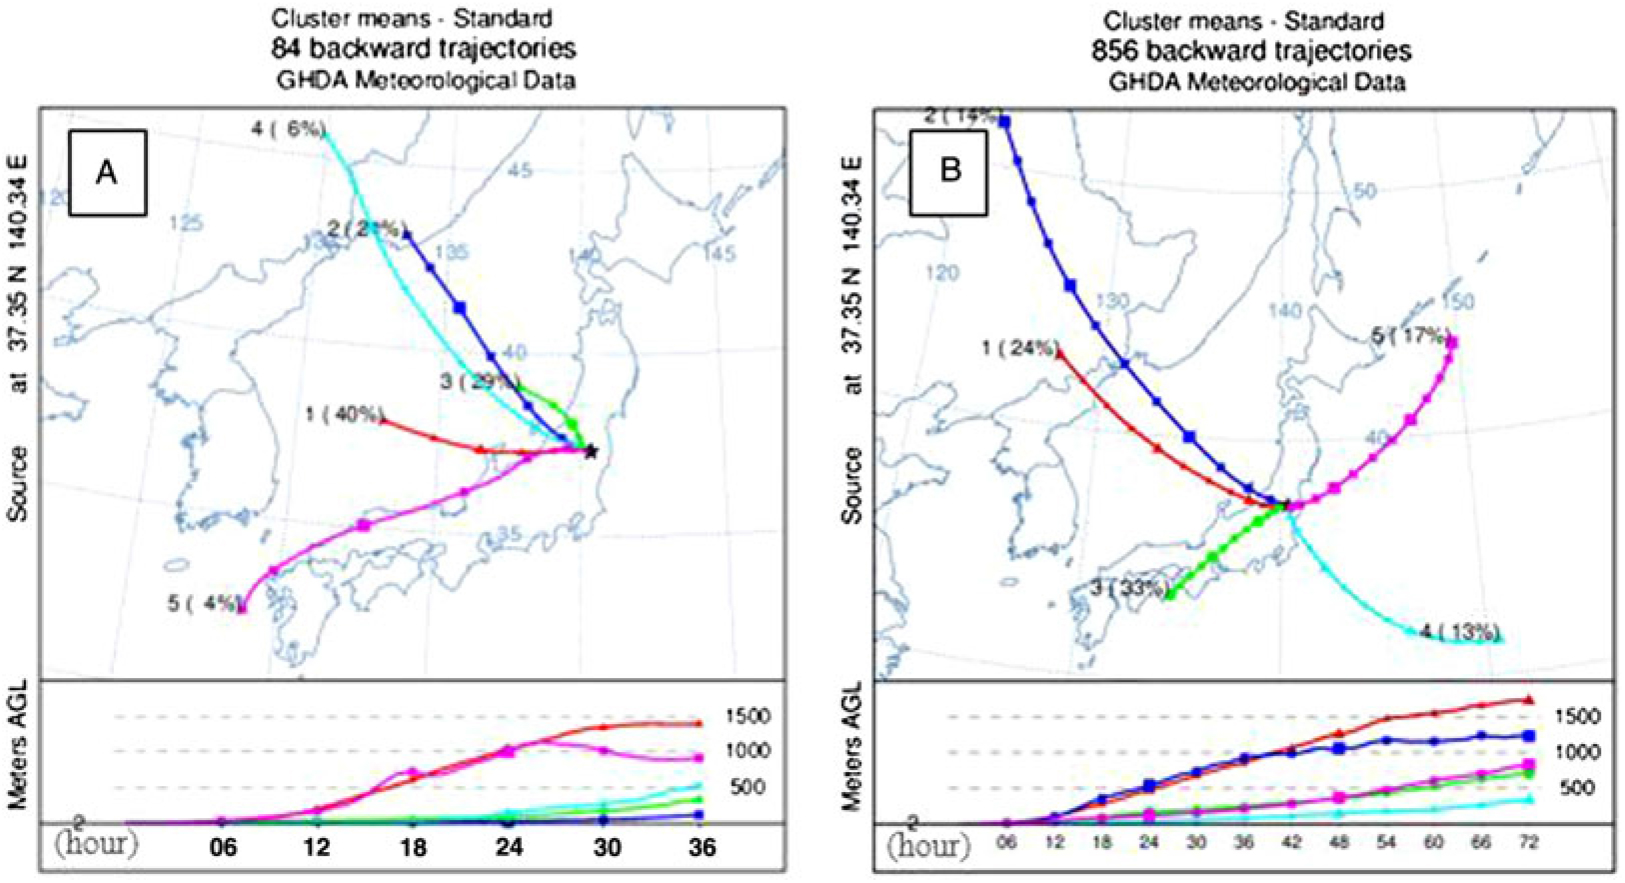
(A) Backward trajectory clusters to Koriyama from March 11–31, 2011; (B) backward trajectory clusters to Koriyama clusters for the growing season (March– September) in 2011, started from Koriyama, 2 m above ground level.

After the day of the accident, and from March 11–31, 2011, the trajectories show that the air masses moved eastward to the Pacific Ocean (Figure 6a). Major parts of the 36 hr long trajectories (Figure 6a, Cluster 2, 43%) stayed close to the coastal region and started to move southward, but after 24 hr, these trajectories also turned to the Pacific Ocean. During the whole growing-season period (March–September 2011), the trajectories show similar properties as observed in March (Figures 6a and 6b). The only exception is cluster 5 in Figure 6b, which shows that dominant part of the air masses went to NW during the growing season. The air mass data suggest that the excess 14C in the tree rings could not come specifically from the days of accident, but possibly came from longer term pre-and post-accident NPP operation. The largest part of the air masses went to the direction of Pacific Ocean during the whole growing season, as only 38% of the 72-hr-long trajectories moved N–NW (direction of the land). Similar effects could also explain the visible 14C excess in 2010, well before the accident (see points [i] and [j] in Figure 4, section 2010).
Regarding the Koriyama sampling location, the backward trajectory clusters show that the largest part of the air masses did not come from the east, where the FDNPP is located (Figure 7). The main sources of the air masses in Koriyama are the western and southern area of Japan both in March 2011, after the accident (Figure 7a) and during the whole growing season (March–September 2011, Figure 7b). Note that in March (Figure 7a), the backward trajectories showed the air masses mainly came from west, not from the direction of the FDNPP. Presumably, this is the main reason why the effects of the FDNPP accident and excess 14C are undetectable in the tree rings from this region. As the southern part of Japan is more densely populated, the air masses move close to the ground level, and can collect more fossil CO2 loaded air masses originating in those locations. The air particles of clusters 3 and 4 (Figure 7) moved closed to the ground level, through different densely populated coastal and inland regions, Ibaraki and Aichi prefectures (during their last 48 hours’ flight along the trajectory). Clusters 3 and 4 represent 43% of the air mass, which suggests that the detected high fossil contribution observed might be due to the air masses from the urban area, where the local background 14C level can be even lower due to local fossil sources.
Previous FDNPP-related tree ring 14C studies (Xu et al. Reference Xu, Cook, Cresswell, Dunbar, Freeman, Hastie, Hou, Jacobsson, Naysmith and Sanderson2015, Reference Xu, Cook, Cresswell, Dunbar, Freeman, Hastie, Hou, Jacobsson, Naysmith, Sanderson, Tripney and Yamaguchi2016a, Reference Xu, Cook, Cresswell, Dunbar, Freeman, Hou, Jacobsson, Knich, Naysmith, Sanderson and Tripney2016b; Chen et al. Reference Chen, Xu, Cook, Freeman, Hou, Naysmith and Yamaguchi2017) do not deal with the possible effect of another NPP, the Fukushima Daini Nuclear Power Plant, which is located 12 km southward from FDNPP and close to the Okuma (10 km) and Tomioka (3.5 km) sampling sites. The 14C surplus in 2010 and 2011 at the Tomioka sampling location may came from the normal operation of Fukushima Daini Nuclear Power Plant, a BWR type reactor similar to the FDNPP. The forward trajectories confirm that air masses can transfer the 14C release from the Fukushima Daini NPP or connect and amplify the effect of FDNPP. A lower but visible excess 14C was measured at this site in 2012 as well, much later than the accident at FDNPP.
CONCLUSION
All of the measured tree ring samples from a Japanese cedar in Koriyama shown lower 14C activity than the continental background (Jungfraujoch) and even lower than similar FDNPP related studies (Xu et al. Reference Xu, Cook, Cresswell, Dunbar, Freeman, Hastie, Hou, Jacobsson, Naysmith and Sanderson2015, Reference Xu, Cook, Cresswell, Dunbar, Freeman, Hastie, Hou, Jacobsson, Naysmith, Sanderson, Tripney and Yamaguchi2016a, Reference Xu, Cook, Cresswell, Dunbar, Freeman, Hou, Jacobsson, Knich, Naysmith, Sanderson and Tripney2016b; Chen et al. Reference Chen, Xu, Cook, Freeman, Hou, Naysmith and Yamaguchi2017). The 14C concentrations in 1990–2014 tree rings follow the exponential decline of the global atmospheric bomb curve. The detected local Suess effect is not constant but has a small variability and the anthropogenic component ratio varies between +0.5 and –1.6%, average –0.83 ± 0.01%. The HYSPLIT model shows that the air masses mainly moved to the Pacific Ocean from the Fukushima Dai-Ichi power plant during the growing season in 2011. Therefore, we can conclude that the main part of the 14C activity went in the direction of the ocean after the nuclear accident March 11, 2011. Furthermore, there was a detectable fossil fuel contribution in almost every tree ring from Koriyama. This could also mask a possible accidental 14C release signal. Additionally, the backward trajectories from the sampling point show that the examined tree samples are from the opposite direction, from southern and western parts of Japan. The analysis of the trajectory clusters shows that only 17% of the air masses came from the direction of the Fukushima Dai-ichi power plant. The other 83% came from different, more urbanized areas towards Koriyama. These densely populated sites can cause a higher Suess effect due to the higher urban activity and more fossil CO2 emission. This study shows that the 14C effect in the area of the nuclear accident of the Fukushima Dai-ichi nuclear power plant is not detectable at 60 km distance to the west. This study shows that any detected surplus 14C in Japanese inland tree rings at Fukushima prefecture mainly came from the pre- and post-accidental period and partly from the long-term operation of the nearby Fukushima Daini Nuclear Power Plant. In 2012, after the accident, when FDNPP was already shut down, a 14C excess was still visible at Tomioka, 3.5 km from the Daini NPP.
We also conclude that the excess 14C level estimation relative to high distance global atmospheric background 14CO2 data is not completely correct, as the intensifying local fossil emissions can hide the excess 14C releases. We therefore recommend using local, Japanese tree rings as a background reference level for these types of studies.
ACKNOWLEDGMENTS
The research was supported by the European Union and the State of Hungary, co-financed by the European Regional Development Fund in the project of GINOP-2.3.2-15-2016-00009 “ICER”. This work was carried out also in the frame of the VKSZ_14-1-2015-0021 National Nuclear Research Program, supported by the National Research, Development and Innovation Office of Hungary.